A data visualisation can be created with a visualisation tool, then exported as SVG and finally included in a web page. But an SVG visualisation can also be generated directly from data in the browser.
For this, two things need to happen: the browser needs to load the data for the visualisation, and the data needs to be transformed into SVG elements. Both can be done with JavaScript, the language with which you can make web pages dynamic and interactive.
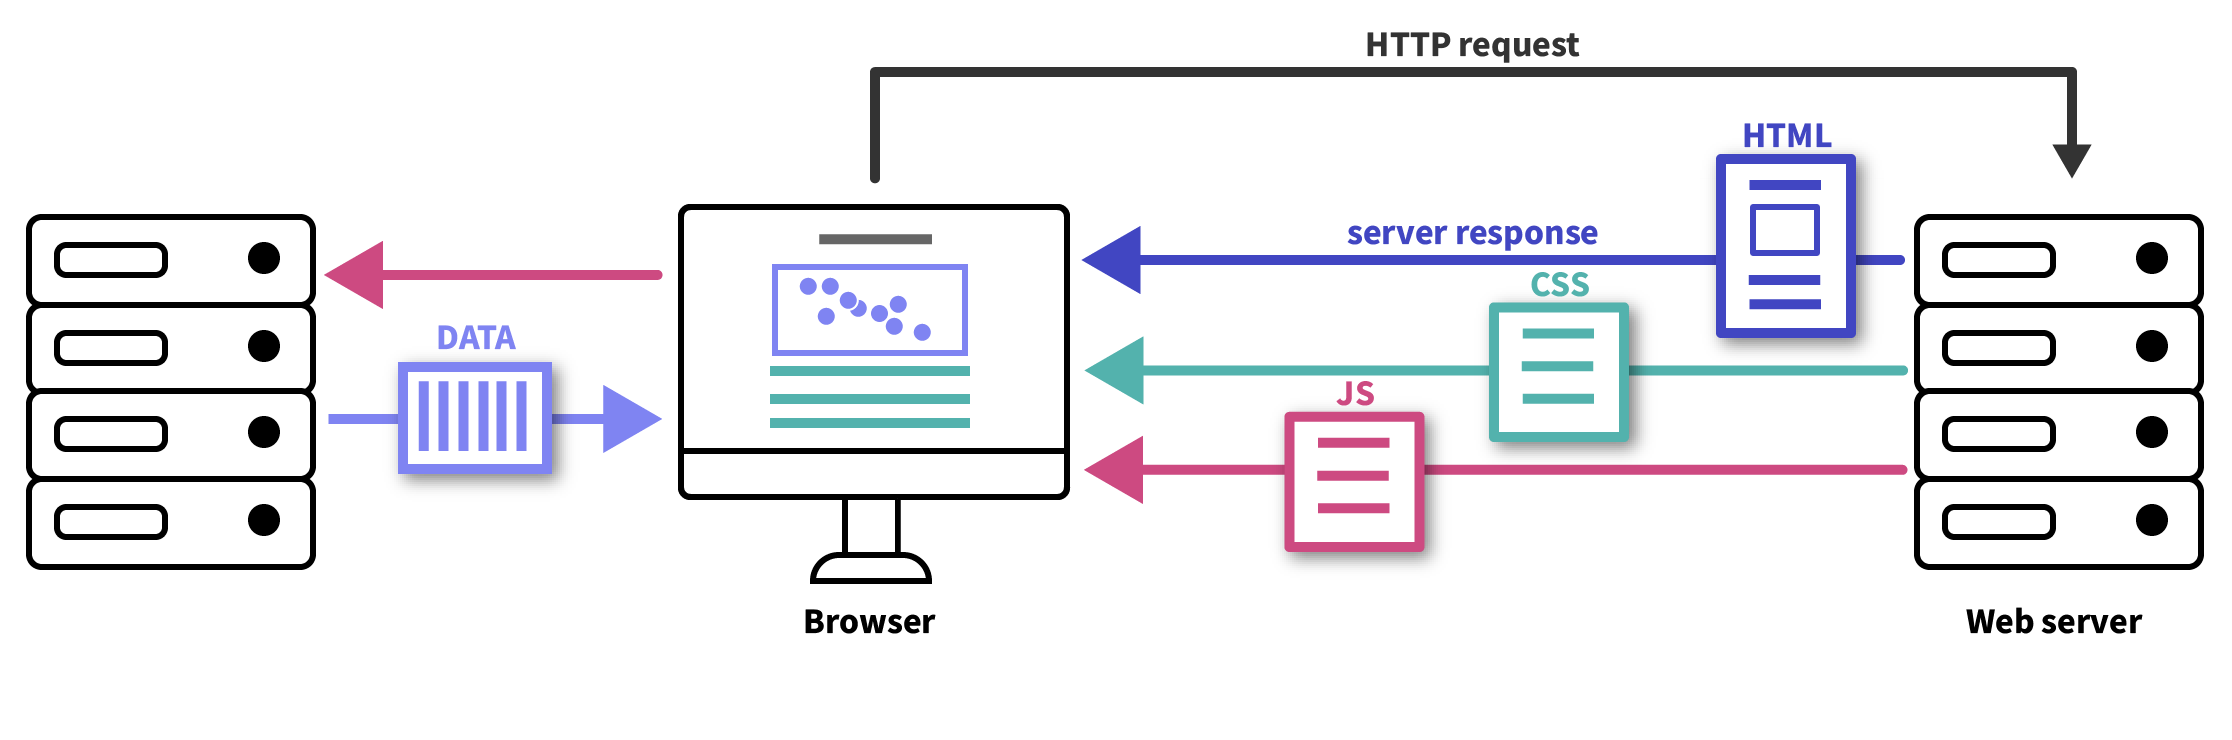
Source: Maarten Lambrechts, CC BY SA 4.0
With JavaScript, data files (usually JSON or CSV) are requested from a web server. From there, the SVG elements (circles, lines, paths,…) and their attributes and styling are computed in the JavaScript. Then finally, the elements are added to the page and drawn on screen.
This approach of dynamically generated SVG has some advantages over static SVG:
- the data for the visualisation can be dynamic: depending on user interactions, like filtering, the data and the resulting SVG can be updated
- updating the source data (after correction, or when new data is available) only requires to update the data: the visualisation will update automatically, because it is generated from the data by the browser each time the web page is opened
- because the JavaScript can measure the space on the page the visualisation should fit into, the SVG visualisation can be made responsive and made to respond to the dimensions of its container.