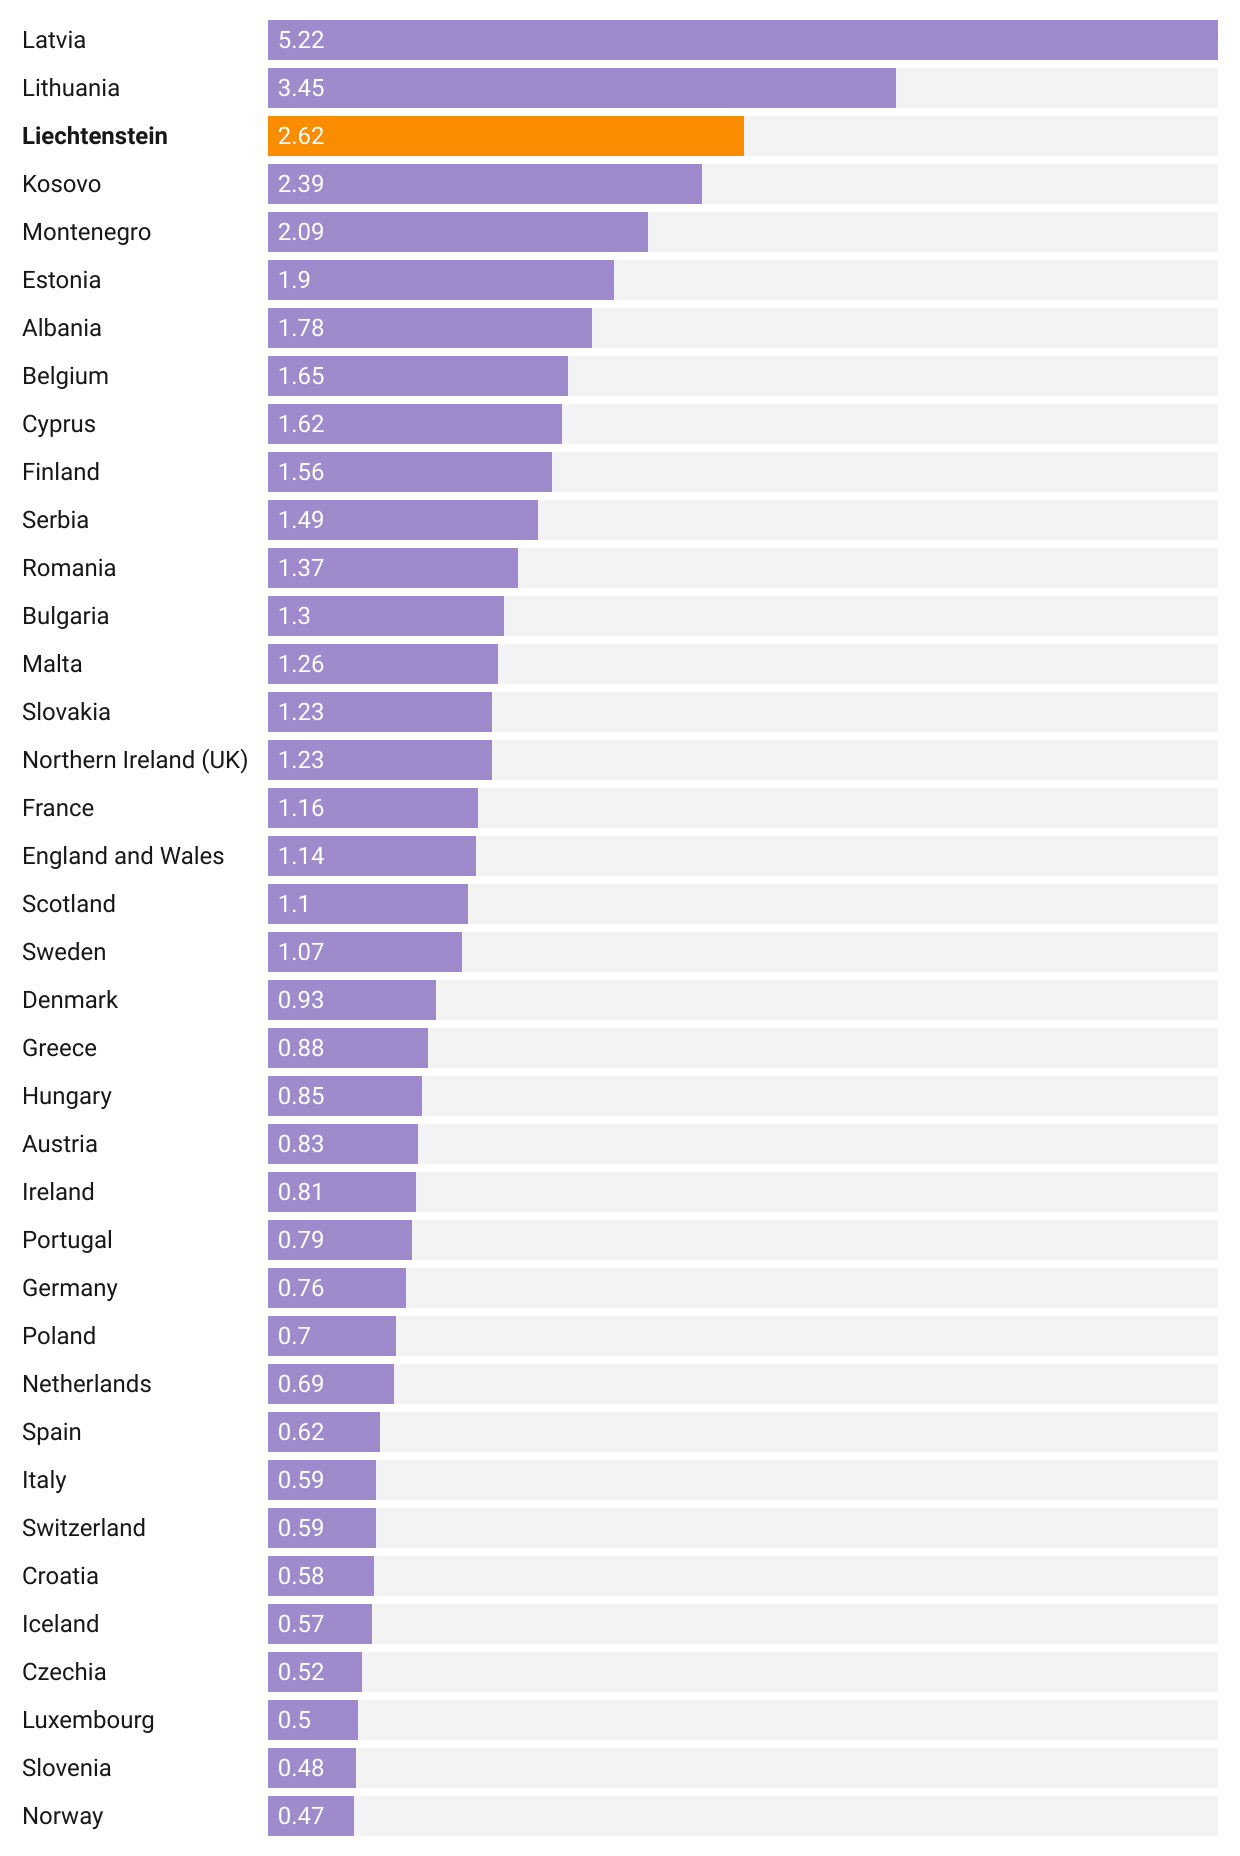
Based on the following chart, you might conclude that Liechtenstein is a dangerous place to live: in 2018 it had the third highest homicide rate in Europe.
Source: Recorded offences by offence category - police data, Eurostat
But in order to interpret the homicide rate correctly, you also need to consider the denominator. The homicide rate is expressed as the number of homicides per 100.000 inhabitants, but in 2018 Liechtenstein only had 38.378 inhabitants. So its homicide rate of 2,62 only represents a single murder.
A year later, Liechtenstein didn’t register any murders, so its homicide rate was 0.
Source: Crime statistics, Eurostat
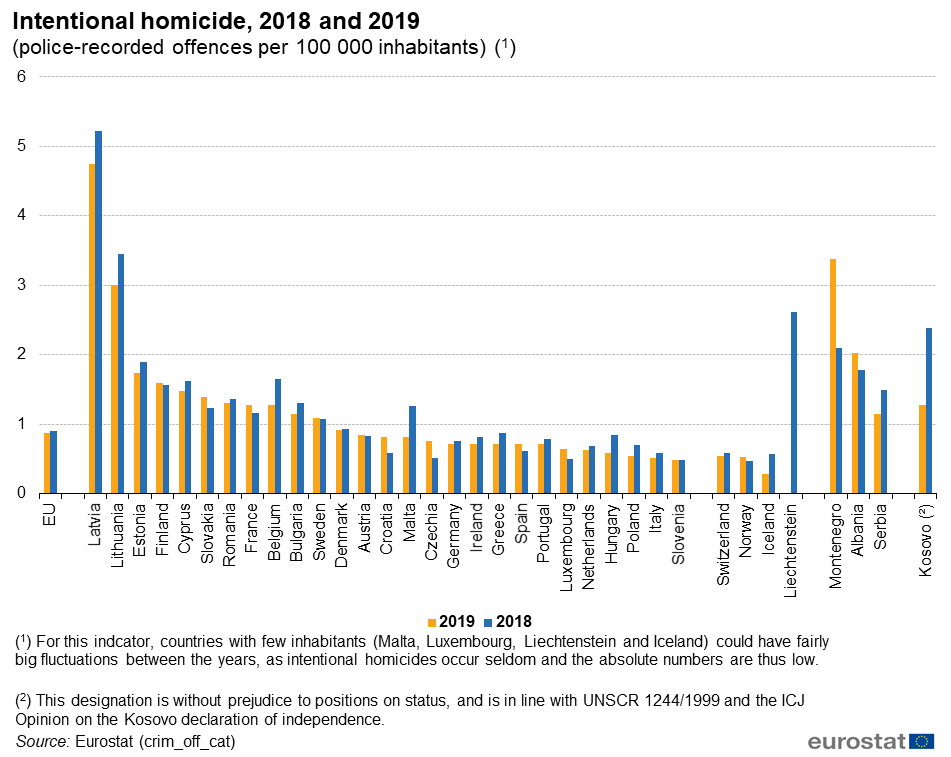
Pay attention to the first note at the bottom of the chart above. As a warning for the values of small countries, Eurostat mentions that these can show big fluctuations. This effect is seen in many fields: cities, regions and countries with small populations tend to show more extreme (very high and very high) numbers. Rare events, or the lack of them, can swing numbers significantly up or down because of the small population.