Unlocking the potential of open data
European countries make progress
Unlocking the potential of open data: European countries make progress
Every year, European countries improve their open data practices
Europe is making progress when it comes to open data. Our yearly Open Data Maturity assessment shows how European countries are performing in terms of open data by evaluating their level of maturity and tracking their progress over time. Participating countries use it as a benchmark to find areas for improvement and to compare themselves to others. Year after year the Open Data Maturity assessment measures 4 dimensions: policy, portal, impact, and quality.
Over the years, European countries have improved their scores from an average maturity score of 44 % in 2015 to 81 % What has changed in these years?
Key trends
We see that national open data portals become more user-friendly, the quality of the data improves, open data policies are increasingly taken up, and more impact is created. Many countries shifted their focus from quantity of data to quality of data. We also noticed that open data portals prioritise publishing datasets that are most relevant for their users and datasets that serve a public interest and benefit society. Datasets that are of high value for society might be health-related for example, such as the French dataset on COVID-19 vaccination data, or related to the environment, such as the Irish water levels dataset for instance.
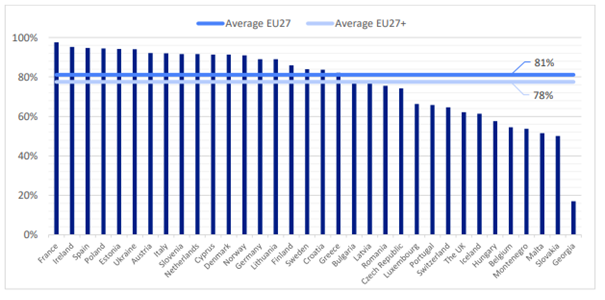
Figure 1: The open data maturity scores of the 2021 assessment
How did we get here? Let’s look back on 7 years of Open Data Maturity assessment and the progress on each dimension.
From 2015 to 2021, scores on all four measured dimensions increased every year, yet some dimensions improved faster than others. See how they developed in figure 2.
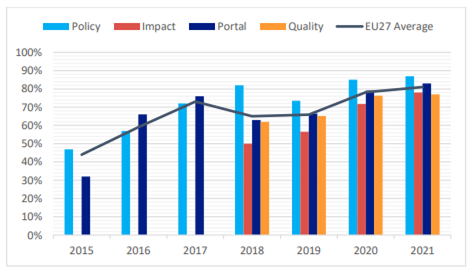
Figure 2: The open data maturity scores of the EU27
EU policy efforts boost open data reuse
The dimension policy focuses on the countries’ policies and strategies to foster open data at the national level. It has always been the best developed. Moreover, it improved the fastest to reach an average of 86,9 % in 2021. The high scores on this dimension can be explained by the positive impact of EU policy. The publication of the Public Sector Information (PSI) Directive, in 2003 and its recent revision: The Directive on open data and the re-use of public sector information stimulated open data re-use across the EU. Slovenia performs best on this dimension with a score of 99,2 %. Denmark, France, Ukraine, and Italy follow closely with scores of 98,5 %. These countries are well aware and up-to-date with the current legislation and regulation in their country and stay on top of policy developments.
Impact of open data grows
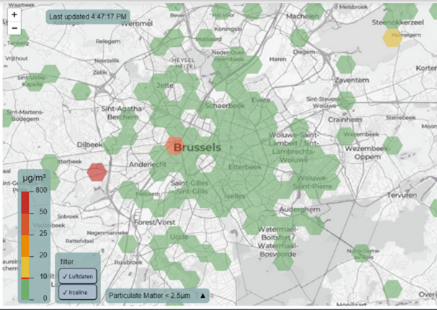
The dimension Impact investigates how open data creates impact through re-use. Think of applications that make use of open data to measure air quality, such as InfluencAir.
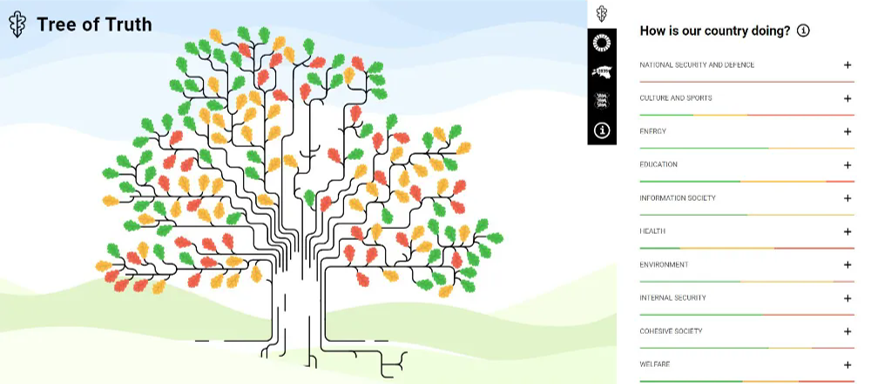
Rather than simply monitoring re-use, countries now pay substantial attention to researching and studying the impact of re-use, resulting in a significant increase of the maturity score from an average of 78 % in 2020 to 81 % in 2021. In 2021, Estonia, Spain, Finland, Ireland, Italy, and Poland did exceptionally well on this dimension, achieving a perfect score of 100 %. These countries presented great examples of open data re-use, clearly demonstrating how open data creates economic, political, environmental, and social impact. The Estonian application, Tree of Truth for example helps the government monitor progress towards national goals such as reducing emissions.
Many portals are automating with APIs
The dimension Portal looks at the national open data portals in terms of their features. This dimension for example assesses how a portal enables interaction between data providers and re-users, and how user-friendly the platform is. In 2020 and 2021 we observed that countries are increasingly automating their portal with APIs. An API enables advanced users to access the metadata programmatically, for example by writing software that performs searches automatically to identify new datasets.
There is still room to improve on quality
In 2021, countries scored lowest on Quality. This dimension explores if national portals have a systematic and automated approach to harvesting data, the currency, and reliability of metadata, as well as compliance with the metadata standard DCAT-AP.
What drives the success of the top performers?
Spain, a top performer from the very start
In 2015 and 2016 Spain ranked number 1. Why did and does the country rank amongst the top performers? The fact that Spain has a national open data policy in place, and a draft of the national data strategy, contributes for a large part to their success. Also, Spain is exceptionally active in the open data community and hosts roughly 10 events throughout the year. This significantly boosts their impact score. The signing of the International Open Data Charter by the city of Madrid in 2015 also contributed to Spain’s success. Madrid was the first European city to sign this charter, which is a set of principles and best practices for the release of public sector data. In the same year, the city launched the Madrid Open Data Portal and, a little later, the Transparency Portal. The latter shows citizens clearly how the city government is organised and what actions they are taking for the city in terms of urban planning and mobility for instance.
Ireland, a leading example of a user-friendly and high-tech portal
In 2017, 2018, and 2019 Ireland ranked number 1. One of the reasons for their success is the user-friendliness of the portal and technical advances such as automatic harvesting. In addition, similar to Spain, Ireland hosts regularly open data policy events. Their national open data strategy pushes all public service organisations to create publication plans and revise them every two years to keep them up to date.
A nice example of how Ireland creates impact with open data is Where Your Money Goes, an online tool that anyone can use to monitor government expenses. With this visually appealing and user-friendly tool, citizens can quickly get a sense of how public money is spent.
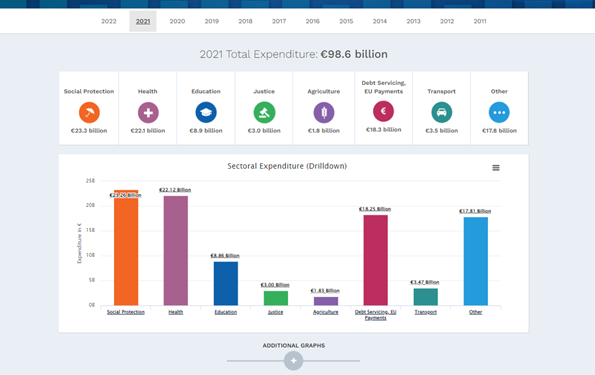
Figure 3: The Irish Government’s tool for monitoring expenditure: Where Your Money Goes.
France, making the government more effective thanks to open data
The 2021 winner, France, provides another great example for improving government effectiveness. According to the Inter-ministerial Directorate for Digital Affairs: ‘We developed an observatory where citizens can check how the 250 top administrative procedures score on 8 criteria, including satisfaction and accessibility. Publishing the evaluation of the procedures helps improve the delivery of services and increases transparency for citizens’.
Conclusion and next steps
From a bird’s eye view, we see that most European countries continue to evolve in terms of open data policy, impact, portal, and quality. The public sector in Europe is becoming more data-driven, digital, and citizen-centric. Value is not just created by public bodies anymore but co-created with citizens and private organisations. Yet the approaches for how to get there vary as the examples show. By assessing and showing the developments across Europe, national bodies can learn from each other, and incentivise each other to do better.
As countries are reaching higher scores every year, the assessment methodology approaches its limits. Therefore, it will be reviewed in 2022. Stay tuned for the publication of the 2022 edition to discover what changed. In the meantime, check out the Open Data Maturity section on data.europa.eu.
Looking to stay tuned for more news and events? Follow us on Twitter, Facebook, and LinkedIn, or subscribe to our newsletter.