
Story #4
The Geography of Risk
Exploring the risk of humanitarian and natural hazards through high-value datasets
Published on 25 September 2025
This story, the fourth in a series, presents an example of how risk datasets may, or not, be correlated to high-value sociodemographic datasets, allowing the reader to explore their relationship in an interactive manner.
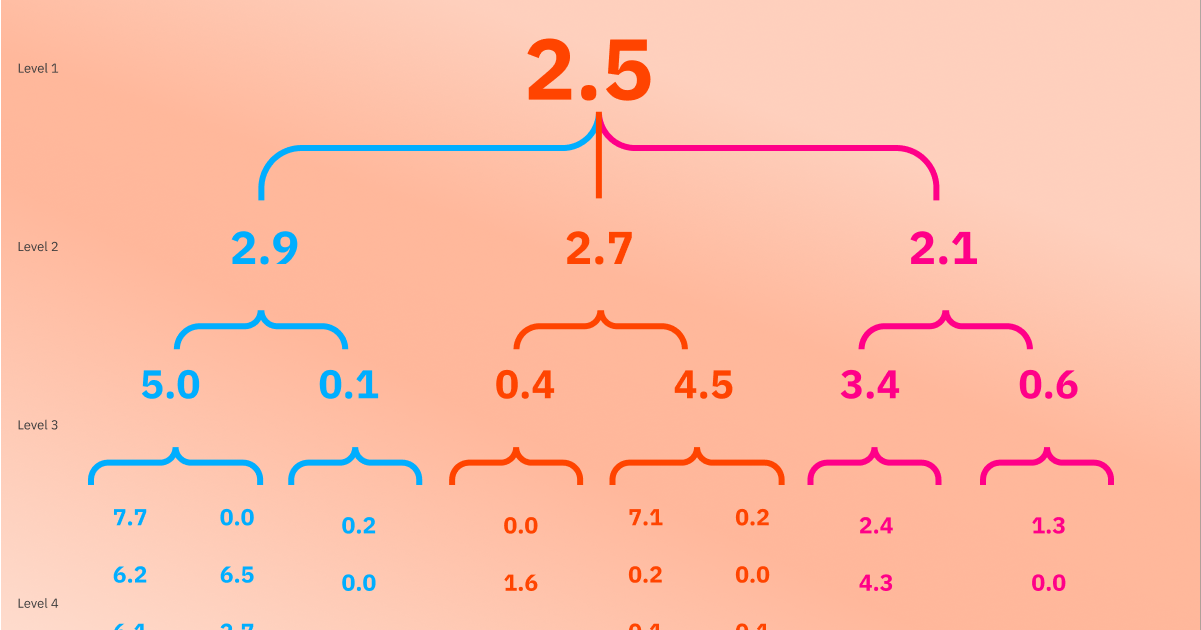
The probability of facing a natural disaster or humanitarian crisis varies depending on where you live. The European Commission's Inter-Agency Standing Committee Reference Group on Risk, Early Warning and Preparedness measures these risks through the INFORM Risk Index, which spans from 0 (very low risk) to 10 (very high risk). To learn more about how this index is calculated, consult this story's visualisation notes.
Navigate the following map to learn about your country's INFORM Risk level.

European countries rank low on the INFORM Risk Index in comparison to the rest of the world, but that doesn't mean that risk is non-existent.

In the second story of this series we learned about scatter plots, charts that can help us visualise the association between different variables.
In the following interactive scatter plot you can see how the different dimensions within the INFORM Risk Index relate to several high-value datasets.
Notice, for instance, that lack of governmental coping capacity is related to a country's gross domestic product. This means that, in general, the richer a country is, the lower the likelihood that that country's government will be unable to deal with a crisis effectively. Now try changing the variables to explore other associations.
While reading these charts and maps, remember that, like many other national-level statistics, the INFORM Risk Index and high-value datasets offer general information about countries, but not about individual people; individuals in the same country can be exposed to varying levels of risk.
Datasets used in this story
- INFORM Risk Index 2025
- High-value dataset: Climate related economic losses – values at constant 2022 prices
- High-value dataset: Share of renewable energy in gross final energy consumption by sector
- High-value dataset: Population connected to at least secondary wastewater treatment
- High-value dataset: Inequality of income distribution
- High-value dataset: Purchasing power adjusted GDP per capita
- High-value dataset: Relative median at-risk-of-poverty gap
- High-value dataset: Investment share of GDP by Institutional Sectors
- High-value dataset: Real GDP per capita
Visualisation Notes