
Visualisation Notes #4
Visualising indexes
From individual observations to high-level indicators
Published on 25 September 2025
This fourth story in our series explores the association between the INFORM Risk Index and several high-value datasets.
But what is an "index"?
Broadly speaking, an index is a composite indicator created to provide a general understanding of several interrelated phenomena.
When it comes to the INFORM Risk Index, imagine that it is an "average" of several types of risk a country may be exposed to. Each one of those risks can be measured separately, but if we try to compare many of them to each other at the same time, things can get complicated rather quickly. Therefore, it's often useful to come up with an aggregate measure — a single number — that summarises all those risks. That's the index.
The INFORM Risk Index weighs more than 50 variables grouped into three dimensions. First, the probability of humanitarian crises or hazards; second, the vulnerability of people in each country; and third, how prepared (or not) a country is to cope with a crisis.
In other words, this index weighs the risk of occurrence of catastrophes (risk of what, and where), the risk dependent on the living conditions of people on each country (risk to whom) and the relative strength or weakness of each country's institutions.
Each of these three dimensions is weighed equally to come up with a single number that spans from 0 (very low risk) to 10 (very high risk).
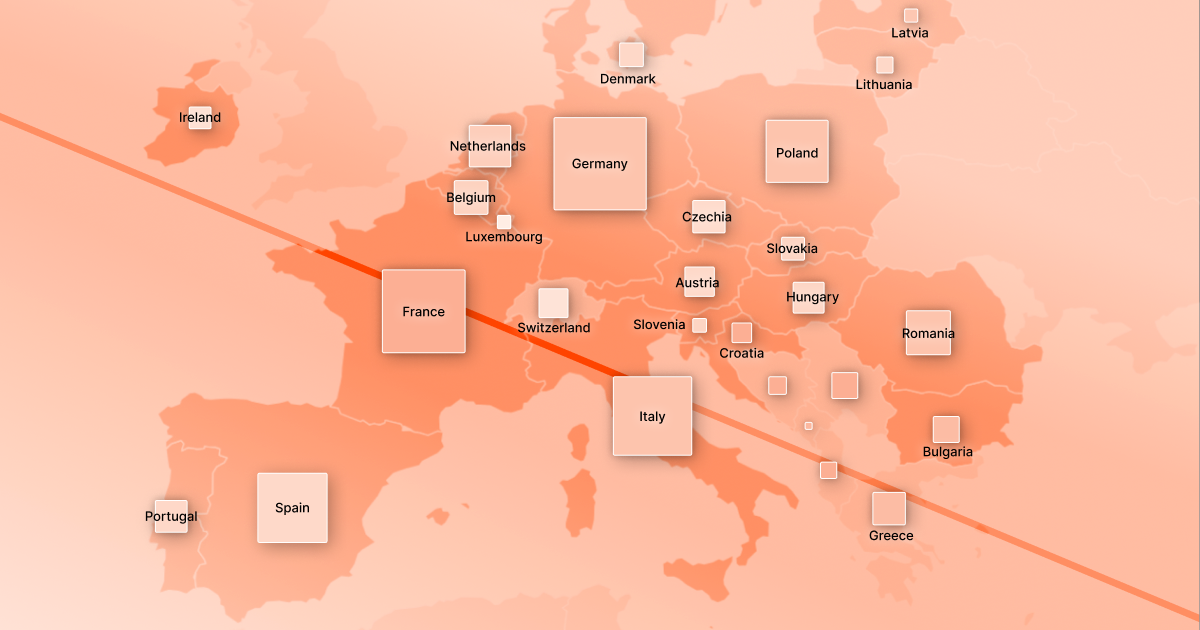
The following diagram shows the multi-layered structure of the INFORM Risk Index. Let's use Italy as an example. Italy's risk level is small, just 2.5. Keep scrolling to reveal the diagram.
Here are Italy's scores on each of the three main dimensions of the INFORM Risk Index. Please continue scrolling.
In the diagram's third and fourth levels you may notice that Italy's risk of earthquakes and coastal floods is moderate to high, but this is mitigated, for instance, by low socio-economic vulnerability and by governmental institutions that are prepared to cope with hazards.
As is often the case with charts and statistics, a single figure may not tell the entire story!
Story #4