
Story #5
Who can afford silence?
Listen to the unequal distribution of noise complaints through high-value datasets
Published on 20 October 2025
This story about noise complaints in the EU is the fifth and final one in a series that illustrates the power of high-value datasets to inform discussions about issues of public interest. Each story is paired with a visualisation note – an article that introduces the reader to the language of data visualisation. Read all our stories here.
From sprawling urban centres to small rural villages, it may seem like silent environments are scarcer than ever.
A 2020 study from the European Environment Agency claims one in five Europeans are being exposed to harmful levels of noise pollution, which, besides being a general annoyance, is linked to cardiovascular and metabolic issues and sleep disturbances.
One of the key objectives of the EU's zero pollution action plan is to reduce noise. To achieve that goal, we need to understand how this data is currently distributed. Who gets to enjoy silence and who is forced to regularly endure noise within each Member State?
We can get a glimpse of this data from the percentage of people reporting noise from neighbours or from the street each year.
The data comes from the European Union Statistics on Income and Living Conditions (EU-SILC) which, among other variables, asks the respondent if they feel that noise from neighbours or from outside is a problem for the household.
More than just visualising this data, we can hear it as well to try to better understand this phenomenon.
You can learn more about charts you can hear in this story's accompanying visualisation notes.
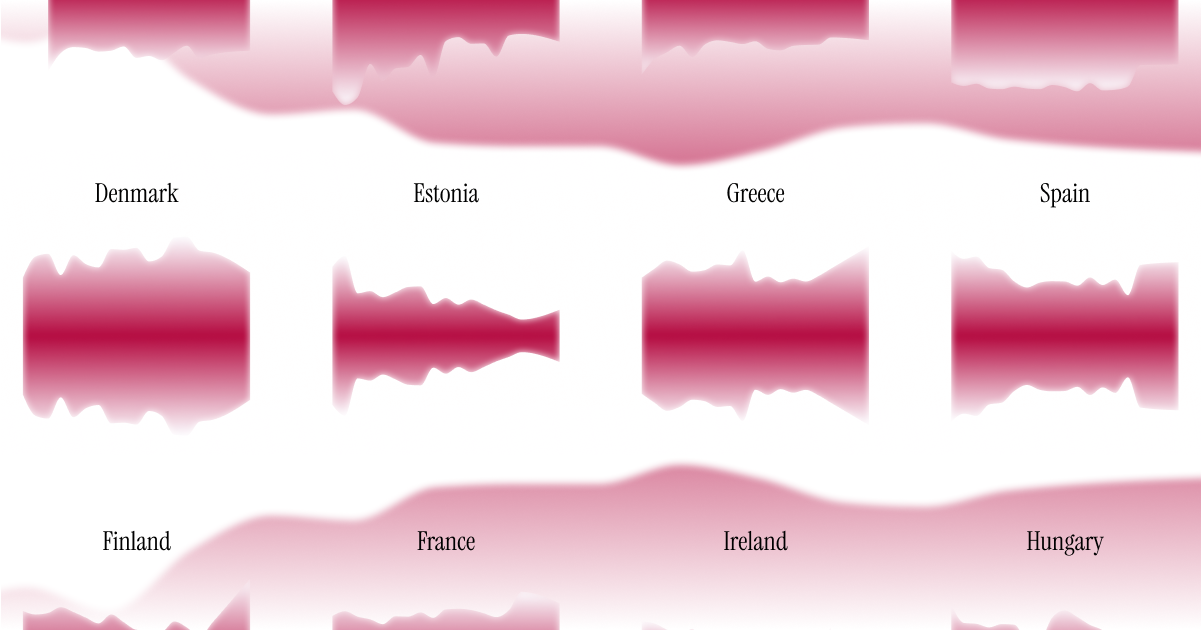
The size of these graphics are proportional to the percentage of people reporting noise from neighbours or from the street.
Overall, there are less complaints coming from high-income households, although in certain countries -like Italy, Lithuania, Poland- the percentage of complaints is more or less the same. Estonia, however, reported both the lowest and highest percentage of complaints, in different years, among all the countries shown in this story.

The circle width and the pitch of the sound represent the percentage of people that consider noise from neighbours or from the street to be a problem

Move the cursor around to highlight the sounds of a single country
Note: Montenegro, North Macedonia, Albania, Serbia, Kosovo are not shown in this story because they have too few data points
Datasets used in this story
- High-value dataset: Noise from neighbours or from the street (EU-SILC)
Visualisation Notes