
How tiles and mosaics make fairer maps for uneven areas
Does the size of a country affect how we perceive its data? We invited data visualisation expert Xaquín González Veira to explore how an alternative way of mapping Europe can reveal patterns that conventional maps may hide. Using open data from European, national and local levels, he shows how tile grid maps give every place equal visual weight and why the way we choose to visualise data can change what we see in it.
By Xaquín González Veira, data visualisation expert
When you open most data maps of Europe, your eye lands on France, Italy or Sweden before you read a single number. Not because those countries matter more, but because they are just bigger. Geography sets the visual hierarchy, and the data has to argue its way out from under it.
That is not a problem for navigation maps, where the landmass is the point. It is a problem, though, for recurring maps of public communication – election results, unemployment rates, broadband coverage, vaccination rates, energy mixes – where, as readers, we are meant to compare places, not measure areas. On those maps, every reader is, without realising it, being asked to weigh Luxembourg against Spain on a scale where one of them is two hundred times larger.
Tile grid maps are one answer to that asymmetry. The form replaces irregularly shaped territories with a regular set of equal-sized tiles – most often squares, though hexagons and other shapes are also used – arranged so the geography still feels familiar. Portugal remains west of Spain. Denmark sits above Germany. The silhouette is still recognisable, but every territory now claims the same attention.
Figure 1. A conventional map of the European Union (left) compared with a tile-grid map (right), where all 27 Member States are represented by equal-sized squares, giving smaller countries the same visual prominence as larger ones.
The result can look odd at first. Coastlines disappear. Borders become sharp and straight. Islands swim closer to the mainland. Yet something is gained in return: visual equity. Every territory receives the same visual weight, whether it is geographically vast or physically tiny. A reader no longer has to squint at Luxembourg or search for Malta.
Tile grid maps had a moment a little over a decade ago and have since become a staple of election graphics, census reporting and even Eurovision visualisations. They also have a tiny but lively literature, for example Cities Squared – Making urban data legible explored how gridded representations can make urban systems more legible, and tools like geofacet helped popularise tile layouts for statistical graphics.
Tile grid maps as small multiples
The simplest tile grid maps encode a single value per tile: one number, one colour, one position on a scale.
But a tile can hold any chart.
That is perhaps the format’s most powerful capability. Each tile becomes a small panel: a bar chart, a line graph, a histogram or a dot plot. The layout remains intact, but each location now displays a full dataset rather than a single value. You are no longer reading one variable across a map, but an entire distribution, a time series or a breakdown by category, simultaneously, across every place.
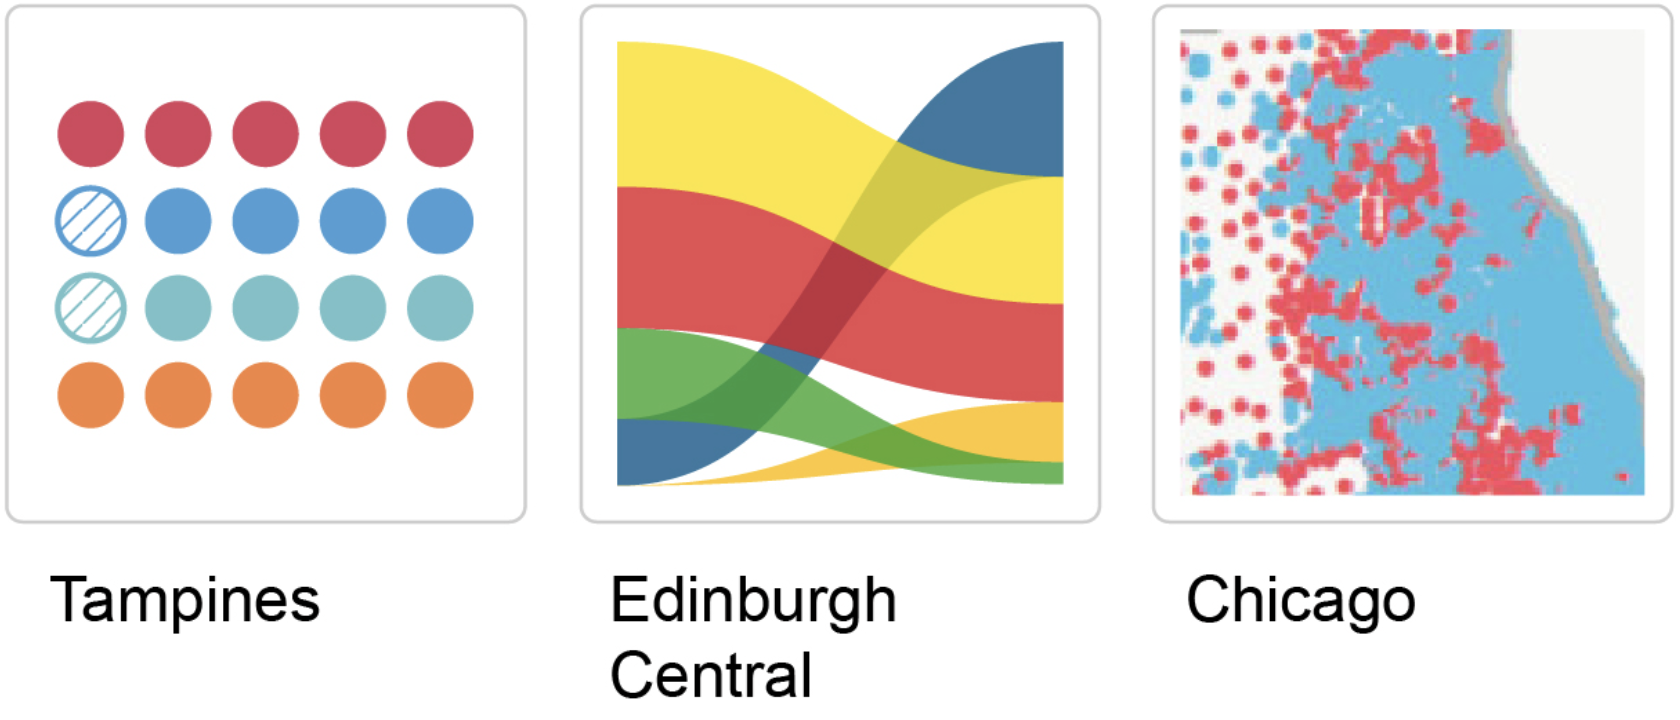
Figure 2. Examples of different chart types used within map tiles: a waffle chart of election candidates in Tampines, Singapore (The Straits Times); a Sankey diagram of voting shifts in Edinburgh Central, Scotland (The Guardian); and a dot map of voting patterns in Chicago, United States (The Washington Post).
We call them small multiples or facets: the same chart type, repeated across a grid, so that visual differences become readable as differences in value. Tile grid maps give that grid spatial meaning. A rise sweeping across a continent, a cluster around a capital region or a divide between north and south – those patterns become apparent immediately.
The only real constraint is legibility. Every extra mark competes for limited space. A national grid with a dozen regions may comfortably hold miniature charts; a dense city grid may not. Good design means deciding what each tile can realistically carry – and stopping there.
Used well, small multiples are the point at which tile grid maps stop being a cleaner choropleth and become something rarer: a map capable of showing complexity without surrendering comparison.
Europe, one tile at a time
How do you show 20 years of change across 27 EU Member States in a single view? Trends over time would call for a line or area chart, losing the spatial distribution (differences across places would call for a map) and the time distribution. Combining them into a single interface – without losing either distribution – is the challenge.
Tile grid maps to the rescue! Because each Member State is represented by a tile of equal size, each one has room to hold a small chart of its own: a sparkline of a 20-year trajectory. The layout still reads as Europe, but every Member State now has its own time series, side by side and on equal terms.
When read this way, the European renewable transition turns out to be two stories, not one. The countries at the top of the ranking in 2024 are not, for the most part, the countries that changed the most.
Europe’s renewable pioneers still lead, latecomers surge
Figure 3. The evolution of renewable energy shares across the 27 EU Member States from 2004 to 2024. Each tile contains a small area chart, allowing readers to compare national trends and see how some countries started with high renewable shares while others experienced rapid growth.
Latvia, Finland and Sweden began the period already above 30 %, drawing on long-established hydro and biomass resources. Their sparklines rise, but gently. The steepest climbs belong elsewhere: Belgium, Ireland and the Netherlands have each more than doubled their renewable share, building new capacity rather than counting existing assets.
Aligning the tiles also makes a quieter contrast legible. Germany and France, two of the EU’s largest Member States, sit in the middle of the distribution of renewable shares rather than at the top. On a conventional map, the size of these countries draws the eye and distorts the data. On a tile grid, each Member State occupies one square, and the distance between climate prominence and renewable share becomes a feature of the data the reader can see directly.
A country rearranged
France contains a contradiction that no conventional map of the country can show – a small metropolitan region by area receives more visitors than almost any place in the world. France’s largest regions, by contrast, receive comparatively few. The country most associated with tourism is, in practice, a country whose tourism is concentrated into a handful of squares. On a standard map, that fact is invisible.
Île-de-France – the Paris Region – covers roughly 2 % of metropolitan France. On a map drawn to scale, it is a small, irregular shape near the northern centre, tucked between Normandy and Grand Est. The tourism data tells a different story: in a typical recent year, the region accounts for close to a third of arrivals at tourist accommodations in France. One of the smallest regions on the map is one of the largest destinations in the world.
A tile grid resolves the contradiction. Île-de-France becomes a single square, the same size as Nouvelle-Aquitaine, which is about seven times larger in land area. The visual hierarchy disappears, and what replaces it is the data: a single tile, near the top of the grid, carrying a value that dwarfs almost everything around it.
International visitors flock to Paris; domestic tourists spread out
Figure 4. Tourist arrivals across France’s regions, distinguishing domestic (blue) and international (orange) visitors. The tile-grid map highlights the concentration of tourism in the Paris Region, which stands out for its high number of arrivals and substantial international tourism.
Once that tile is read correctly, the rest of the country falls into place around it. A second cluster appears along the Mediterranean – Provence-Alpes-Côte d’Azur and Occitanie – carrying the coastal and cultural tourism of the south. Auvergne-Rhône-Alpes carries the Alps. Beyond these, arrivals thin out quickly. The large interior regions that dominate a standard map of France – Nouvelle-Aquitaine, Centre-Val de Loire, Bourgogne-Franche-Comté – recede into the background of the data, exactly as they should.
French tourism is not evenly distributed across French territory; it is concentrated in a region that the map of France tends to hide. A tile grid makes the asymmetry legible, which, for a dataset that drives regional investment, employment and infrastructure decisions, is no small thing.
A city seen differently
Who lives in Barcelona, and where? The city has roughly 1.7 million people, having grown over time, but the growth has been uneven, and the composition has changed just as unevenly. The Barcelona that has emerged since the year 2000 has not arrived everywhere equally.
A conventional district map cannot show this. Barcelona’s ten districts vary wildly in physical size – Sarrià-Sant Gervasi and Horta-Guinardó stretch across the upper city; Ciutat Vella and Gràcia are compact and central – and on a standard map, area sets the hierarchy before any value is read. The districts where the demographic story has actually happened are precisely the ones the map shrinks.
Equalise the tiles, and the city appears differently. Ciutat Vella, dense and small, occupies the same square as Sarrià-Sant Gervasi, which spans several times as much land and has fewer people. What each district actually contains – its trajectory, its composition – becomes the basis for comparison.
Barcelona’s old town is its most international district
Figure 5. Population trends across Barcelona’s ten districts over the past 25 years, shown in a tile-grid map. Stacked area charts distinguish residents by origin: Spain (yellow), the rest of the world (purple) and the rest of the EU (blue). Ciutat Vella stands out for its particularly high proportion of residents born outside Spain.
For a city audience, this can be disorienting in the right way. The geography remains recognisable enough to orient yourself, but the data becomes easier to compare.
Equalising the tiles is not only a readability move; it is a decision about what deserves to be seen on equal terms. A district’s transformation does not become smaller because the district is smaller, and a map that lets size dominate misleads the reader about where the city is changing. The map stops behaving like a street plan and becomes an analytical tool.
How designers make tile grid maps
A good tile grid map is arranged, not generated.
Behind its tidy appearance, there is a sequence of decisions about which geographies to preserve and which to simplify – and those decisions often collide. Preserving every real-world neighbourhood can distort the overall shape. Keeping the silhouette intact may separate places that share a border. Pulling islands closer improves readability while reducing geographic realism.
The tile itself can change, too. Squares align neatly into rows and columns; hexagons create smoother neighbourhood relationships and a less rigid visual rhythm.
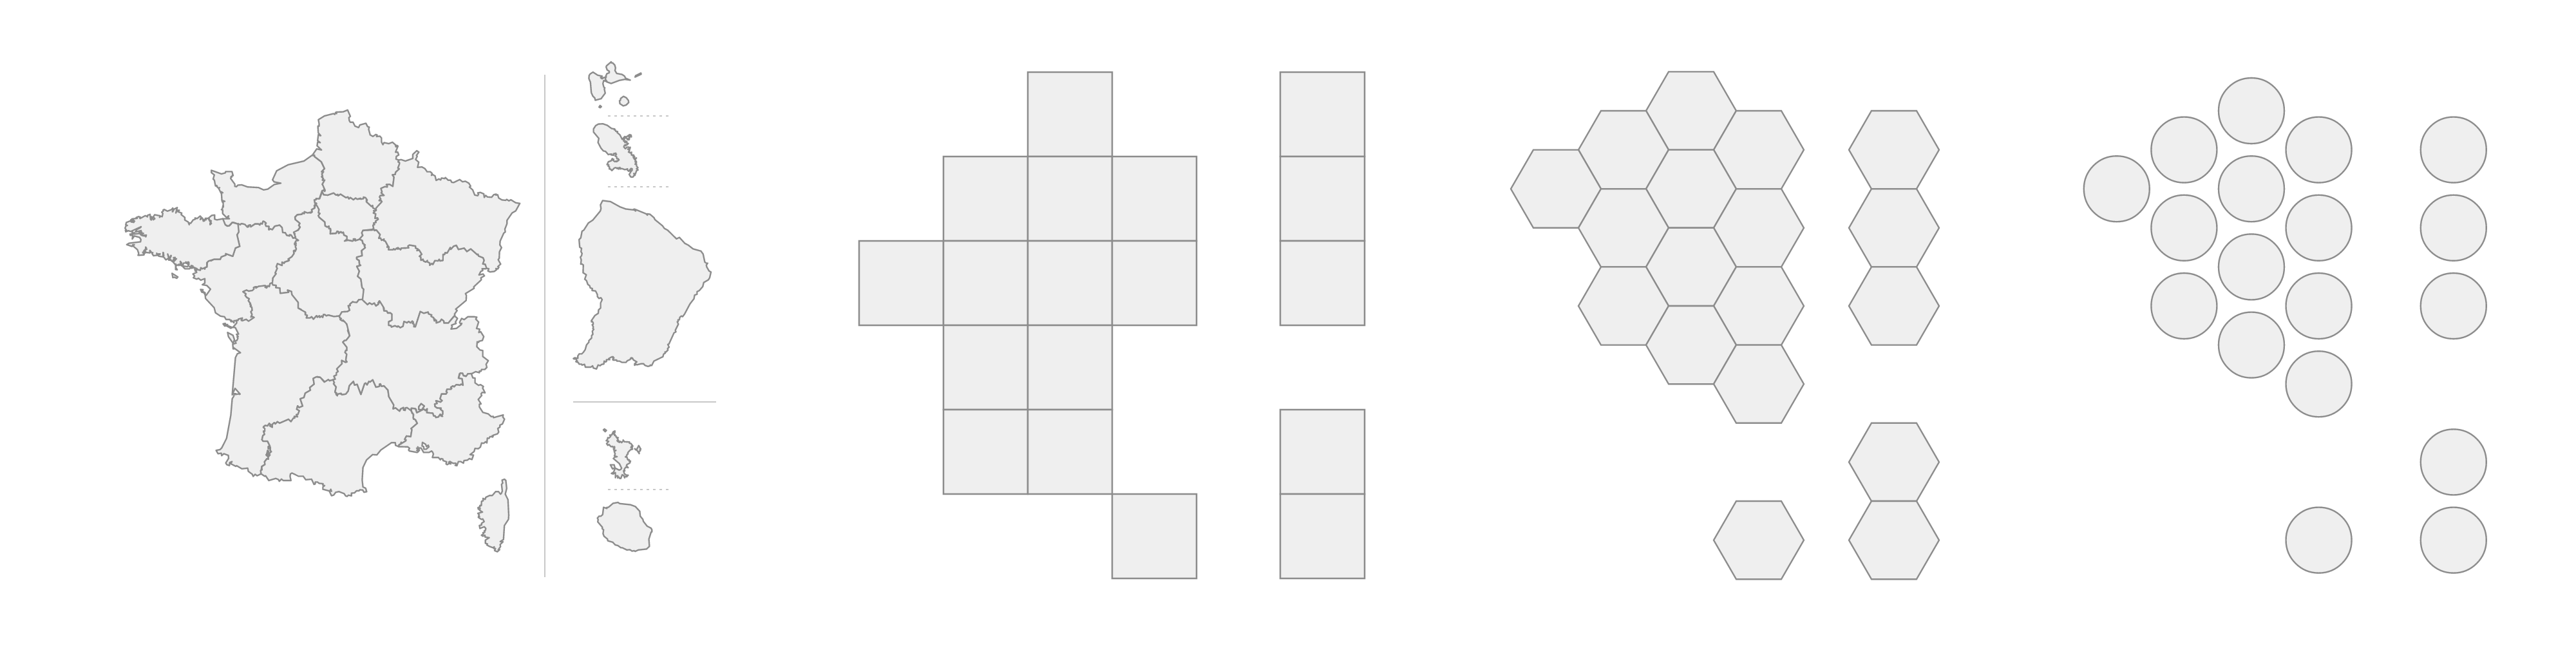
Figure 6. Different ways of representing France’s regions: a conventional geographic map (left) and three tile-grid alternatives using equal-sized squares, hexagons and circles, illustrating how different shapes can simplify geography while preserving approximate spatial relationships.
Three methods describe how these are actually built.
The lowest tech is also the most fun: sticky notes on a wall, one per territory, arranged by whoever is in the room. The trade-offs become physical, and the argument becomes collective.
Once a layout settles, it usually moves into a spreadsheet – Jon Schwabish’s Excel walkthrough is canonical – where cells become tiles and conditional formatting carries the colour.
And for those who prefer their trade-offs formal, Jo Wood’s Grid map allocation notebook treats the whole thing as an optimisation problem: write down what you mean by ‘better’ and let a solver assign territories to cells accordingly.
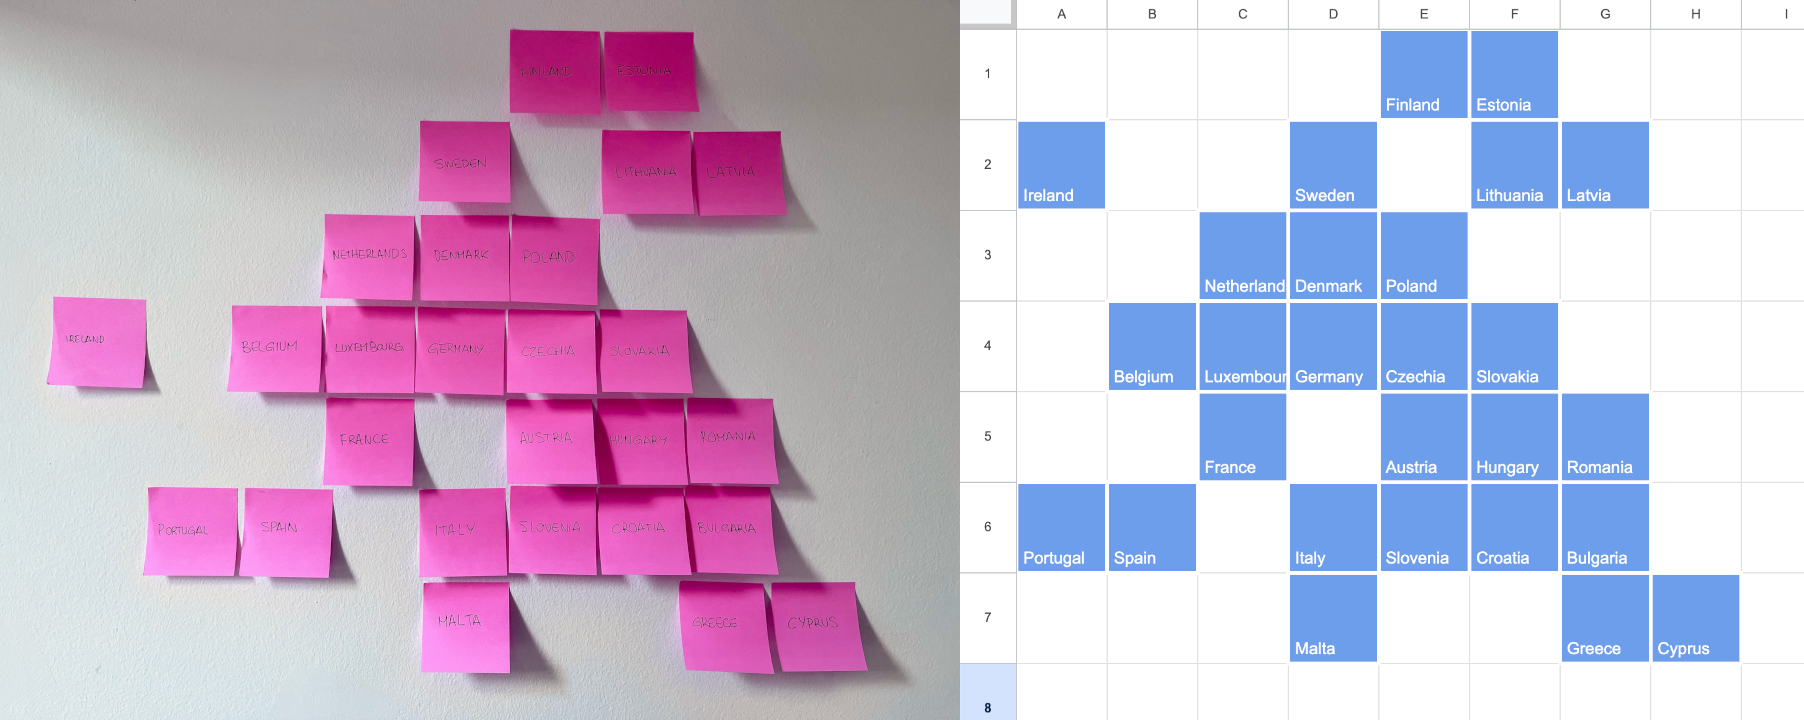
Figure 7. Two approaches to creating a tile-grid map of the European Union: arranging sticky notes by hand (left) and organising countries into a spreadsheet grid (right). Both methods involve balancing geographic recognisability with clarity and comparability.
In practice, judgment remains central. Designers weigh recognisability against clarity, geographic memory against analytical usefulness. The final layout is often the result of many small adjustments invisible to the reader. That invisibility is part of the craft.
When tile grid maps work best
Tile grid maps are strongest when geography matters, but not too much – when the place anchors the comparison without dictating it. If location is irrelevant, an ordered chart is more efficient for comparing values. If borders, distance or terrain matter, a conventional map remains the better tool.
That middle ground is what most public data is about. Elections, public health, housing, education, emissions and broadband access – subjects in which people care where the phenomenon occurs, yet land area means nothing. It is also where space is tight: on a phone screen, in a dashboard, in a small newspaper panel, tiny territories vanish from conventional maps. A tile grid keeps them visible.
Most of all, the format works when every territory deserves equal attention.
Closing thoughts
Every map is an argument about what matters.
Some prioritise physical land. Some prioritise routes and distances. Tile grid maps prioritise comparability. They reduce geographic complexity to clarify the data within it.
That reduction can feel strange at first, because we are used to mistaking familiar shapes for neutral truth. Yet conventional maps are full of design choices: projection, scale, colour, boundaries and emphasis. Tile grid maps surface that abstraction rather than conceal it.
I might be obsessed with the form in ways that escape cartography. Tile grid maps recall ancient mosaics, where tiny, coloured tesserae combined into a captivating whole. They also remind me of my hometown of A Coruña, where Xerión mosaics – modern urban art for some, vandalism for others – dot walls and public spaces. I once confessed my obsession to Tim Wallace, who printed it in his dissertation on cartographic journalism. The tesserae and the Xerión tiles share a visual logic with the squares of a tile grid map: every piece carries the same weight as every other. Only in their arrangement do they become an image.
Tile grid maps remind us that a map is not a mirror of the world, but a tool for thinking about it – and that when the task is to compare places fairly, a grid of equal squares can tell the truth more clearly than the coastline ever could.
Assets
- Reusable CSV tile grids for Barcelona’s districts, France’s regions and the European Union.
- Observable notebook with code used to create the tile grid maps in Plot.
- Renewable energy statistics available at https://ec.europa.eu/eurostat/statistics-explained/index.php?title=Renewable_energy_statistics#Source_data_for_tables_and_graphs.
- Arrivals at tourist accommodation establishments by NUTS 2 (nomenclature of territorial units for statistics) region available at https://ec.europa.eu/eurostat/databrowser/view/tour_occ_arn2/default/map?lang=en.
- Barcelona population by origin available at https://portaldades.ajuntament.barcelona.cat/ca/estad%C3%ADstiques/f4cbsy3pil?view=table.
References
After the Flood, Cities Squared – Making urban data legible, After the Flood, London, October 2019.
Brooks, L. and Carrell, S., ‘Holyrood elections see rise of “Team Ruth” and demise of Labour vision’, The Guardian, 6 May 2016, accessed 22 April 2026, https://www.theguardian.com/politics/2016/may/06/holyrood-elections-see-rise-of-team-ruth-and-demise-of-labour-vision.
Chua, C., Ong, H., Kurohi, R., Sverdan, R. and Adeline, S., ‘GE2025 surprises and new faces: Who are the election candidates you will be voting for’, The Straits Times, 29 April 2025, accessed 28 April 2026, https://www.straitstimes.com/multimedia/graphics/2025/04/singapore-ge2025-candidate-analysis/index.html.
DeBelius, D., ‘Let’s tesselate: Hexagons for tile grid maps’, NPR Visuals + Editorial Graphics Blog, 11 May 2015, accessed 24 April 2026, https://blog.apps.npr.org/2015/05/11/hex-tile-maps.html.
Gamio, L., ‘The Emoji States of America’, Axios, 17 May 2017, accessed 24 April 2026, https://www.axios.com/2017/12/15/the-emoji-states-of-america-1513302318.
Lambrechts, M., ‘Making-of: The Eurosearch Song Contest’, 3 May 2017, accessed 22 April 2026, https://www.maartenlambrechts.com/2017/05/03/the-eurosearch-song-contest-making-of.html.
Schwabish, J., ‘The world tile grid map’, PolicyViz, 12 October 2017, accessed 22 April 2026, https://policyviz.com/2017/10/12/the-world-tile-grid-map/.
Soffen, K., Mellnik, T., Granados, S. and Muyskens, J., ‘What one swing state can teach us about political polarization in America’, The Washington Post, 4 November 2016, accessed 27 April 2026, https://www.washingtonpost.com/graphics/politics/2016-election/nc-precincts/.
Veira-González, X., ‘Dia 25: Mapes, més mapes i no tant mapes’, Observable, 24 July 2025, accessed 29 April 2026, https://observablehq.com/@fndvit/dia-25-mapes-mes-mapes-i-no-tant-mapes.
Wongsuphasawat, K., ‘Quality metrics for tile grid maps’, Twitter, Inc., 2016, accessed 22 April 2026, https://kristw.yellowpigz.com/file/paper/paper_gridmap.pdf.
Wood, J., ‘Grid map allocation’, Observable, 15 August 2021, accessed 10 May 2026, https://observablehq.com/@jwolondon/gridmap-allocation.