Sustainability of (Open) Data Portals Infrastructures reports pt. 2
This is the second piece in a series about the “Sustainability of (Open) Data Portal Infrastructures” reports. In this highlight, the focus is on “Developing Microeconomic Indicators Through Open Data Reuse”.
Over the coming months, all six reports included in the ”Sustainability of (Open) Data Portals Infrastructure” will be summarized into featured highlights. This particular article will focus on the second report: “Developing Microeconomic Indicators Through Open Data Re-use”. This report discusses the importance of measuring the economic impact of open data, the use of microeconomic metrics, and how the re-use of open data can support in this matter.
The Value of Open Data Re-use
Ensuring a sustainable future for open data, and securing governments ongoing commitment to such work, requires evidence of the societal impact of open data, including (but not limited to) its economic impact. However, effectively measuring the economic impact of open data is still an existing challenge. This challenge concerns identifying the chain of causal links, devising appropriate tools and methodology for measurement, and having sufficient resources to carry out the evaluation.
The re-use of open government data creates value for both the public and private sector in delivering services and insights. The challenges of tracking value are in applying the appropriate measures to data re-use. Microeconomic indicators have been developed, and are summarised in the report, that track value creation and measure the impact from the perspective of both the government and the private sector.
Methodology & Results
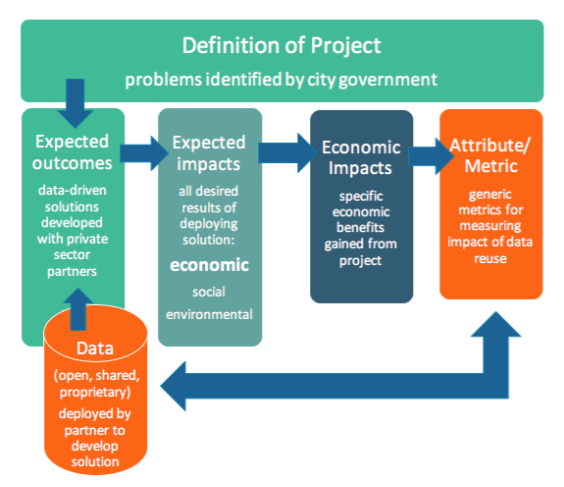
To develop appropriate microeconomic indicators, four cities were analysed that were creating solutions to public sector challenges with open data. They did this through open innovation projects: publishing their data openly and co-creating public sector solutions with external SMEs. The aim of the projects was to understand what impact they were hoping to achieve and how they would assess this. By following the open data innovations, a transferable method for identifying and measuring the impact of individual open data projects was developed, shown in the figure below.

Figure 1: Information captured in case studies
The results of this method are summarised per city in the report, focussing on the economic impact proposed in the smart city solutions. The generalisable metrics extracted from the experiment are categorised according to the accessibility project owners and developers have to the data for measurement – operations data (in-house), related public services data (held by other public services) and private sector data (financial and business data).
These results should encourage public sector portal owners to collect and publish these metrics. Not only can public sector portal owners increase public spending and efficiency transparency for their citizens, but as more data is published it can be used cumulatively to assess impact over a broader area and timescale. Policy makers should encourage the creation and sharing of these metrics, possibly by making it a requisite of funding of such data reuse projects.
As stated, this article focused on a few key findings of the report. For more information on developing macro- and microeconomic indictors through re-use and assessing different methods and metrics, for example, explore the full report “Developing Microeconomic Indicators through Open Data Re-use” on the EDP website.
Keep an eye out for our next the EDP team’s third featured highlight on 2 September 2020 that will focus on “Data Re-use: A Method for Transforming Principles into Practice”. Missed our first piece about “Measuring Use and Impacts of Portals”? Read the first piece in the series that discusses the importance of measuring open data; issues to take into consideration when selecting a metric; examples of metrics to measure the use and impact of portals; and examples of lessons and best practices.
For more information or examples on open data, explore the European Data Portal’s (EDP) news archive and featured highlight section. Aware of open data examples or stories? Share them with us via mail, and follow up on Twitter, Facebook or LinkedIn to stay up to date!
