What did you say?
Measures and solutions for noise pollution
Police sirens, cars accelerating. A major source of the noise you hear comes from traffic passing by. But how loud are these sounds exactly? And how is noise pollution different in various parts of the city or region? European Open Data Portal datasets tell you the answers on these questions for several countries. This article highlights four country examples.
The city of Dublin (Ireland) has measured the noise pollution during day and nighttime on the roads and published this data in the report Revision of Noise Maps and Action plans. During daytime, the band starts at 55 decibels, whereas the band starts at 50 decibels for the nighttime.

Figure 1 Cropped map of the city of Dublin: red highlights an undesired sound level, yellow a satisfactory level and green a desirable sound level, find the map here.
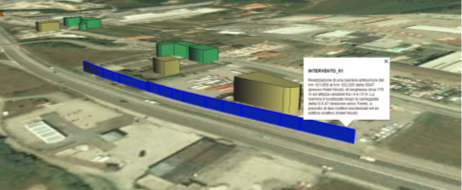
In Italy, certain urban areas suffer from too much noise pollution. In order to solve this issue, an action plan was introduced. The solution was to adopt a directive related to the assessment and management of the environmental noise. In the picture below, you can find a computer simulation of what that means in practice.

Figure 2 The Italian government decided to place a sound wall to decrease noise pollution. You can find more details on this solution here.
A noise overview from the Netherlands makes no distinction between noise during day and night. It includes a calculation of weighted noise per day. This score is compared to the requirements of the Noise Abatement Act, to decide whether there is too much noise or not. In the area of Brussels (Belgium), monitoring stations were installed to measure the noise level. Curious about the measurement results? Take a look at this dataset.
Whenever you are interested in the noise levels within your city or area or will soon move to a new city and would like to take the noise level into account, it can pay off to browse through the available datasets in the European Open Data Portal.
