
Executive summary
For a decade, the open data maturity (ODM) assessment has served as one of the primary benchmarking tools for public sector data policy in Europe. It has successfully monitored the progress of European countries in developing open data ecosystems, assessing key dimensions: policy frameworks, governance, portal development and the quality and impact of published data. The assessment has supported the implementation of Directive (EU) 2019/1024 (the Open Data Directive) by monitoring national developments and encouraging the adoption of best practices across Member States. However, as the European data ecosystem matures from a phase of establishment to one of operational performance, the methodology (developed in 2015 and updated since) requires further iteration.
This report presents the findings of a comprehensive methodological exploration of how to design the next generation of the ODM assessment. Grounded in a four-phase analytical approach (phase 1: scoping and comparative diagnosis; phase 2: option design and stakeholder consultation; phase 3 strategic refinement; phase 4 finalisation and implementation roadmap) it proposes a path to evolve the assessment so it remains a credible and strategic steering tool both for the European Commission and most importantly the Member States/ participating countries.
The diagnostic phase of the study identified five friction points that threaten the continued relevance of the assessment.
- The legislative framework is constantly developing at both the EU and the national levels, requiring careful (re)alignment of the ODM assessment to avoid confusion or redundancy.
- High-performing participants to the ODM assessment are in some cases reaching the limits of what was asked of them (i.e. they are scoring at the upper limit for some categories).
- The reliance on self-assessment methods with centralised verification creates a risk of ‘optimistic bias’, where high maturity scores may reflect the perspective of the reporting authority rather than the reality of the technical implementation or the experience of data reusers. External scrutiny (for example from the Centre for European Policy Studies in 2024) has highlighted instances where policy claims can diverge from on-the-ground user experience.
- The necessary expansion of the questionnaire has created some administrative fatigue and the volume of questions could now be reduced. There is a related perception of overlap with the Organisation for Economic Co-operation and Development’s (OECD) Open, Useful and Re-usable Data Index, which asks national teams to report similar data points to two different international bodies.
- Technical analysis conducted for this study revealed that high scores in the ‘Quality’ dimension do not always correlate with objective metrics. A country may report full compliance with metadata standards, while automated tools detect issues with machine-readability and application programming interface uptime.
To address these challenges, the study developed and communicated three potential theoretical future models.
A moderated self-assessment (option A) – designed as the continuity choice. It would retain the four-dimensional structure (Policy, Portal, Quality, Impact) and the self-assessment questionnaire as the primary instrument for data collection. This preserves the granular longitudinal data series that allows participating countries to track progress on specific indicators (e.g. ‘Strategy implementation’ or ‘Data provision’) over time. However, it would also introduce a rigorous statistical validation layer in the back end to mitigate score inflation.
A balanced scorecard (option B) – a structural decoupling of the assessment. It acknowledges that maturity is a multi-dimensional concept that cannot be neatly compressed into a single ranking without losing nuance. This model abandons the idea of aggregated ranking in favour of a balanced scorecard approach, presenting countries with a dashboard of distinct performance indices that are assessed and scored independently.
A fully automated single score (option C) – the most radical departure from current practices. It aims to fully resolve any potential credibility gap by integrating all data sources into a single, definitive open data performance score. This model would treat objective metrics and external user as direct, weighted components of the final score for each dimension.
Stakeholder consultation with Member States revealed a decisive preference. Member States rejected a purely automated score (option C) in favour of maintaining the longitudinal continuity and engagement levels of the current system. They also acknowledged that maintaining the status quo was not desirable.
Consequently, this report recommends pursuing a moderated self-assessment model over the short-to-medium term, with specific enhancements taken from other options where they fall into the ‘low risk and clearly beneficial’ category. The suggested strategy rests on three pillars.
- Structural consolidation. A radical streamlining of the questionnaire to reduce redundancy and shift focus from the existence of policies (binary yes/no) to the degree of their implementation (graduated maturity scales).
- Expert validation. The introduction of an annual independent peer review of the questionnaire itself to eliminate ambiguity, and the possible integration of the open data impact measurement framework to enrich reported impact narratives with model-based economic estimates (GVA (gross value added) and employment).
- Algorithmic moderation. The introduction of a composite index named the technical quality index (TQI), comprised of automated metrics from the ‘output’ indicators developed under the common EU framework for open data impact measurement (2026). This index will not replace any national score, but will act as a shadow rating. Divergences between self-reported maturity and the TQI components will be used as the basis for moderation and validation discussions with Member States.
Immediate priorities
Even if the strategic direction (set out in detail in the body of the report) is somewhat ambitious, the implementation must be pragmatic. The study proposes a phased roll-out, distinguishing between immediate ‘low effort, high value’ actions for the upcoming cycle and advanced technical features for the medium-to-long term.
Short-term recommendations include the following.
- Implement the optimised questionnaire. Deploy the consolidated question set proposed in this study. Use the space created by removing or consolidating legacy questions to introduce targeted, experimental indicators / question sets on AI readiness and real-time data while still decreasing the overall burden.
- Optimise pre-filling. Shift the role of national coordinators from data entry to verification by continuing to pre-populate the questionnaire with the previous year’s validated responses and assessing the feasibility of developing a systematic procedure (and toolset) for AI pre-filling from phase 2.
- Initiate a dialogue on OECD alignment. Open a formal dialogue with the OECD working group to discuss the definitions of overlapping indicators, paving the way for future data sharing under a single submission model (but only where possible and relevant).
- Calibrate the TQI and prepare to integrate the common EU open data impact measurement framework. Run selected automated metrics in shadow mode during the phase 1 cycle to establish a baseline of technical performance in some geographies, preparing for deployment as a moderation tool from phase 2.
A roadmap in three phases, including more detailed implementation recommendations, is also provided to guide the medium-term development of the ODM assessment. By adopting this approach, the European Commission can secure the future of the ODM assessment primarily by ensuring value for Member States. The proposed methodology updates ensure continued analytical credibility through automation; reduce administrative friction through streamlining, and ensures that the assessment remains a relevant monitor for the consolidated data economy rules of the future.
1. Introduction
The Open Data Maturity (ODM) assessment is an annual benchmarking exercise coordinated by the European Data Portal, evaluating how European countries progress in publishing, managing and reusing public sector data. It serves as a strategic benchmarking tool across four dimensions: policy, portal, quality and impact, each containing indicators that reflect national efforts in open data governance, infrastructure and reuse facilitation. The assessment provides comparative scores, identifies strengths and gaps and supports efforts of European countries to improve open data governance, infrastructure and reuse (1).
1.1. The strategic role of the open data maturity assessment in the EU data landscape
The ODM assessment operationalised the priorities of the Directive (EU) 2019/1024 (the Open Data Directive). This directive replaced the earlier Directive (EU) 2019/1024 (the Public Sector Information (PSI) Directive) and established a legal framework for the reuse of public sector data across the EU (2). It introduced the concept of high-value datasets, mandated machine-readable formats and emphasised the role of national data portals, all of which are directly reflected in ODM’s indicators (3).
Because of the Open Data Directive’s emphasis on reuse and interoperability, Regulation (EU) 2022/868 (the Data Governance Act (DGA)) was introduced in 2022. The DGA complements the directive by creating mechanisms for data altruism, data intermediaries and trusted sharing environments (4). These concepts expand the scope of open data beyond public sector reuse and their implementation is increasingly monitored through ODM’s impact and governance indicators (5).
After the DGA was adopted, Regulation (EU) 2023/2854 (the Data Act) followed in 2023, aiming to regulate business-to-government and business-to-business data sharing (6). The Data Act reinforces the strategic importance of data availability and reuse, influencing national open data strategies and portal functionalities assessed under ODM (7).
The European data strategy (2020) was launched to unify these legislative efforts into a coherent vision for a single European data space. The European data strategy envisions a single market for data that enables the free flow of data across sectors and borders, empowering public services, businesses and citizens through data-driven innovation (8). ODM serves as a key monitoring tool for this strategy, offering evidence of participating countries’ readiness, infrastructure and governance maturity.
Finally, the ODM assessment’s portal and quality dimensions also reflect the technical and semantic standards promoted under the earlier digital single market strategy (2015), which laid the groundwork for a unified EU digital space (9). The ODM assessment’s portal and quality dimensions reflect the technical and semantic standards promoted under this strategy (10).
In November 2025, the European Commission responded to this fragmentation with the Digital Omnibus Regulation proposal. This legislative package marks a strategic pivot from expansion to rationalisation. Crucially, it proposes to repeal the Open Data Directive and the DGA as standalone instruments, consolidating their operative provisions into a restructured and expanded Data Act. The objective is to create a single, simplified rulebook that reduces administrative burden and clarifies the interplay between public sector information, data-sharing obligations and technical standards.
Consequently, the ODM assessment stands at a critical juncture. A methodology designed to monitor a specific directive (the Open Data Directive) is no longer sufficient in a landscape moving towards a unified Data Act. To remain relevant, the ODM assessment should clearly evolve from a tool for a single directive into a holistic monitor of the consolidated EU data framework. It must support Member States in this transition, mirroring the simplification objectives of the Digital Omnibus Regulation by reducing reporting duplication and focusing on the practical implementation along with the impact of these converged data rules.
The ODM assessments must navigate the constraints of Regulation (EU) 2016/679 (the General Data Protection Regulation (GDPR)). While the GDPR predates the directive, its requirements on personal data protection shape how open data is anonymised, structured and made reusable (11). The tension between openness and privacy is a recurring theme in ODM assessments, particularly within the quality and impact dimensions (12).
Emerging from these developments is the data union strategy, a conceptual strand within the European data strategy that emphasises citizen empowerment, trust and participatory governance (13). While still evolving, its principles are increasingly embedded in ODM’s impact dimension, especially regarding feedback mechanisms and inclusive data reuse (14).
Effects of the open data maturity assessment
Beyond tracking progress, ODM actively feeds back into policy by generating structured evidence that informs legislative refinement, strategic alignment and targeted investment. These insights highlight disparities and systemic gaps in national open data ecosystems, offering evidence that can guide updates to EU data legislation and inform the refinement of national strategies (15). By tracking how Member States align with overarching EU priorities (such as the European data strategy, the Open Data Directive and the Digital Decade targets) ODM provides a benchmark for strategic coherence and progress (16).
Moreover, the assessment supports targeted funding and capacity-building by identifying countries or areas in need of support (17), thereby informing the allocation of resources through instruments like the Digital Europe Programme (18) and the Connecting Europe Facility (19). At the national level, ODM results can be used to stimulate reform: governments can draw on their scores and recommendations to revise open data strategies, strengthen governance structures and set new performance targets that reinforce EU-wide digital transformation goals (20).
Slovakia’s 2024 performance illustrates how ODM recommendations can inform strategic adjustments. Following 2023 feedback highlighting gaps in data provision, decentralization and reuse visibility (21), Slovakia launched a new national portal that allows community members to submit reuse cases and actively harvests data from major municipalities (22). This directly addressed prior concerns about dataset availability and local integration. Additionally, Slovakia published its first open data impact report, detailing downloads, application programming interface (API) access and user profiles for high-value datasets, fulfilling the 2023 call for more transparent reuse measurement. These targeted actions contributed to an 8.8 % increase in portal maturity and a 9.1 % rise in reuse measurement, jumping from 19th to 6th place (23).
France’s continued leadership in the 2024 ODM assessment (24) reflects both consistency and innovation. Building on its 2023 strengths, France addressed the only notable gap – metadata currency and completeness – raising the score from 80 % to 100 % (25). France introduced new strategic initiatives such as the data roadmap for ecological planning, integrating datasets from energy, transport and waste sectors to support environmental decision-making. The data and territories report enhanced regional data access, while the co-developed digital and data roadmap, shaped by over 300 public employees, demonstrates adaptive governance and inclusive policy design (26). These developments resulting from the ODM assessments show how recommendations can inspire not just technical upgrades but also thematic expansion and participatory governance, reinforcing open data’s role in national transformation.
The ODM assessment guides reform through tailored recommendations grouped into four clusters: beginners, followers, fast-trackers and trend-setters. This stratification ensures that each group receives actionable guidance aligned with its current capabilities, helping governments prioritise next steps. Each cluster includes multiple recommendations. Various country examples illustrate successful uptake; Malta, as a beginner, launched its Public Administration Data Strategy 2023–2027, aligning open data with national digital and economic goals to foster trust and innovation (27). Denmark, a follower, continuously updates its strategy to reflect EU legislation and coordinates across government levels to adapt policies and harmonize metadata (28). Estonia, a fast-tracker, activated a broad network of data officers and stewards, enabling monitoring and reuse practices across over 600 stakeholders (29). As a trendsetter, Ukraine advanced portal sustainability through technical audits, feasibility studies and a strategic roadmap with defined actions and responsible actors (30). These examples demonstrate how ODM recommendations translate into concrete governance reforms, infrastructure upgrades and cross-sectoral alignment.
Recent feedback on the open data maturity assessment
While the ODM assessment has demonstrated value in guiding reform and strategic alignment across Member States, some academic and policy commentators have raised concerns about its methodological robustness, practical feasibility and long-term reliability.
Zuiderwijk et al. (2021) offer a critical analysis of open government data benchmarks that is directly relevant to the ODM assessment. They highlight that many benchmarks (including those similar in structure to ODM) rely on constructed or proxy indicators to measure complex concepts such as data reuse and impact. These dimensions, which are also central to ODM, are difficult to quantify objectively and may introduce ambiguity into scoring (31). The Centre for European Policy Studies (CEPS) reinforces this concern by arguing that the ODM scoring system lacks transparency and analytical rigor, particularly in how it accounts for actual data reuse and the societal value generated from open data (32). Additionally, CEPS critiques the equal weighting of the four dimensions – policy, portal, impact and quality – without clear justification, suggesting that this undermines the credibility of the overall ranking.
A recurring concern across multiple sources is the reliance on self-assessment within open data benchmarks, including the ODM assessment. Zuiderwijk et al. (2021) highlights that expert-based and self-reported data can introduce inconsistencies in how countries interpret and present their progress, potentially undermining the reliability of comparative analysis (33). This critique is particularly relevant to ODM, where national representatives are responsible for completing the questionnaire. Rajamäe-Soosaar et al. (2024) reinforce this point by emphasising the subjectivity of self-assessment, noting that responses often reflect institutional perspectives rather than implementation realities (34). CEPS adds that this reliance may lead to inflated scores or strategic reporting, especially when governments lack external validation mechanisms (35).
Another concern is about the comparability of ODM results over time. Zuiderwijk et al. (2021) caution that methodological variability, especially changes in indicators and scoring methods, can undermine the consistency of cross-country and year-on-year comparisons (36). This issue is echoed by Rajamäe-Soosaar et al. (2024), who note that Estonia’s rise to trendsetter status in the ODM ranking coincides with significant revisions to the questionnaire and scoring dimensions, particularly since 2019 (37). While these updates have improved internal consistency, they also make longitudinal analysis more difficult, limiting the ability to track progress reliably across years.
Concerns have also been raised about the practical feasibility and inclusiveness of the ODM assessment, particularly in relation to resource constraints and governance coverage. Rajamäe-Soosaar et al. (2024) point out that the ODM assessment’s national-level focus fails to account for disparities at the local level, where smaller municipalities often lack the technical capacity, funding or expertise to engage meaningfully in open data provision (38). This creates a maturity gap that is not captured by the current framework, suggesting a need for more granular, multi-tiered assessment mechanisms. In parallel, CEPS highlights the excessive length and complexity of the ODM questionnaire, warning that governments (especially those with limited administrative capacity) may struggle to complete it thoroughly.
In light of these critiques, CEPS call for a fundamental rethink of the framework, including independent validation, clearer definitions of indicators and stronger emphasis on measurable outcomes. Zuiderwijk et al. (2021) call for greater transparency in benchmark design and suggest that combining methodological strengths across models could enhance the reliability and policy relevance of assessments like ODM.
1.2. The case for methodological evolution
The mandate for this revision stems from a convergence of external scrutiny, technological opportunity and the need for greater operational efficiency.
External analysis has increasingly challenged the robustness of the ODM assessment’s reliance on self-assessment. A notable critique by CEPS argued that the ranking risked becoming a ‘shoddy’ metric due to unchecked self-reporting. It is important to clarify that this critique is not entirely accurate; the current methodology does include a rigorous validation process, where the European Data Portal research team manually verifies claims against provided evidence (URLs, documents) and challenges inconsistencies. However, this manual validation is resource-intensive and necessarily limited in depth. As open data ecosystems grow in complexity, manual checks cannot scale to verify every dataset or portal feature. The challenge, therefore, is not a lack of validation, but the scalability and visibility of that validation. To maintain unquestioned credibility, the methodology must move from manual verification of claims to automated verification of technical reality.
The ODM assessment has received constructive feedback from a limited set of academic, government and policy communities, particularly regarding its methodology and validation processes. One recurring concern is the reliance on self-assessment by participating countries, which some argue may introduce bias or strategic reporting. However, this feature is also a core strength of the ODM assessment. By allowing participating countries to respond directly, the assessment captures exclusive insights that only national administrations can provide, such as internal governance structures, implementation challenges and contextual priorities. This approach ensures continued engagement and reinforces the collaborative nature of the ODM assessment as a two-way instrument for both evaluation and capacity-building.
Nonetheless, the critique is taken seriously and improvements have been carefully considered. To enhance independence and credibility, one proposed measure is to introduce an academic review of the questionnaire itself, such as validation by independent experts or professors. Additionally, while the ODM assessment already includes a three-round validation process, there is recognition that transparency around this mechanism could be improved. Updating the methodological paper to clarify validation procedures and evidence requirements is an obvious immediate step.
Participating countries face a growing reporting burden. As open data matures, the complexity of the questionnaire has necessarily increased, requiring extra resources from national teams to complete. There is a perception that this issue is compounded specifically by overlap with the OECD’s Open, Useful and Re-usable Data Index (OURdata) Index. The mandate explicitly calls for a rationalisation of indicators/questions to minimise redundancy. This includes exploring opportunities to streamline definitions and selected elements of ODM’s self-assessment component in a way that ensures coherence and interoperability with the OECD framework, while preserving the distinct objectives and added value of each instrument.
Refinements were explored to address assessment fatigue and improve survey design. These included replacing binary (yes/no) questions with scaled responses to reduce score inflation, combining related questions to ease the burden of respondents and providing contextual explanations to clarify why specific features matter. Modularising the questionnaire could also allow differentiated response frequencies, aligning with national capacities and priorities.
The rapid maturation of artificial intelligence (AI) and automation tools presents a new mandate for the ODM assessment. Unlike in 2015, we now, in theory, possess the technological capability to measure technical maturity directly. Large language models (LLMs) can now assist in analysing policy documents, while automated scripts can test API latency, metadata quality and portal performance at scale. This technological shift offers a solution to the ‘breadth versus depth’ dilemma. By delegating technical verification to automated tools (such as an expanded metadata quality assessment), the ODM assessment can increase the rigour of the assessment while simultaneously reducing the reporting burden on national teams.
The current methodology was primarily designed for an era of readiness (checking for the existence of policies, portals and basic governance). With many participating countries now consistently scoring above 90 % (the ‘trendsetters’), the methodology faces a ceiling effect in some specific dimensions. It can struggle to fully differentiate between countries that have merely established frameworks and those that are effectively driving data reuse and impact. A revision is necessary to shift the analytical focus from the presence of infrastructure to its performance and usage, ensuring the benchmark remains challenging and relevant for mature data ecosystems.
1.3. Objectives and scope of the study
The study analyses, designs and operationalises the next methodological iteration of the ODM assessment. The analytical scope is grounded in the existing EU data legislative framework, primarily the Open Data Directive and Implementing Regulation (EU) 2023/138. Furthermore, the scope addresses the broader data economy rules currently in force, including the DGA and the Data Act. The study methodology accounts for the strategic direction set by the Digital Omnibus Regulation proposal, which seeks to rationalise and streamline these existing instruments rather than replace them.
Strategic objectives
The overarching goal is to evolve the ODM assessment from a readiness tool into a performance framework that measures verified quality, usability and impact. The study pursues four strategic imperatives.
- Shift toward objective measures. Reduce reliance on self-assessment or enhance its effectiveness by introducing measurable and verifiable indicators.
- Enhance credibility. Integrate external validation mechanisms to cross-check national performance and validate examples.
- Ensure relevance. Challenge high-performing countries while providing a clear development path for those that are earlier in their journey.
- Embed reuser perspectives. Systematically include input from key data reuser groups to begin to reflect the on-the-ground reality of data usability.
Operational objectives
The study also addresses five specific operational objectives:
- conduct a comprehensive analysis of methodological options to evaluate the trade-offs between continuity and innovation;
- design robust mechanisms for external validation, including peer-reviewed expert surveys and structured consultations with data reuser communities;
- assess the feasibility of integrating verifiable quantitative metrics (ideally from the forthcoming open data impact measurement framework), such as the metadata quality assessment (MQA), automated portal performance tests and AI-powered web scraping;
- evaluate sustainability and resource implications to maximise automation potentials and reduce the reporting burden on Member States, aligning with the burden reduction goals of the Digital Omnibus Regulation;
- deliver a definitive, revised ODM methodology alongside a phased implementation roadmap starting in the 2026 assessment cycle.
2. Methodology and evidence base
The recommendations presented in this report are grounded in a rigorous, multi-methodological study executed over a five-month period. Moving beyond theoretical analysis, the research team adopted a structured approach designed to test the practical feasibility of new indicators while securing stakeholder buy-in. This chapter outlines the methodology employed, detailing the evidence base constructed through legislative mapping, technical stress-testing of automated tools and direct consultation with Member States.
2.1. Overview of the phased analytical approach
The study followed a structured four-phase methodology, moving from a diagnostic assessment of the existing ODM framework to the co-design of a revised model that addresses the specific operational realities of Member States.
Phase 1: scoping and comparative diagnosis
The initial phase established the evidential baseline by situating the ODM assessment within the broader landscape of international indices. The research team mapped the ODM assessment against the evolving EU legislative framework (specifically the DGA and the Data Act) to ensure the new methodology captures compliance with emerging obligations. A comparative analysis was conducted against major frameworks, including the OECD OURdata Index, the World Bank GovTech Maturity Index (GTMI) and the Global Data Barometer. This identified specific areas where the ODM assessment potentially duplicated efforts, particularly regarding the OECD assessment and areas where it could adopt best practices in validation. Crucially, this phase questioned the ‘return on investment’ for participating countries, investigating who uses the data and whether the outcome justifies the reporting cost.
Phase 2: option design and stakeholder consultation
Three distinct theoretical options were developed and stress-tested: (a) statistically moderated self-assessment, (b) balanced scorecard, and (c) single hybrid score. These were subjected to a rigorous consultation process to determine political and operational feasibility. A comprehensive stakeholder survey conducted in late 2025 yielded responses from 26 countries. The results provided further direction for the study.
- Rejection of purely automated scoring. There was minimal appetite for a single hybrid score (option C), which was viewed as methodologically opaque and disruptive to longitudinal tracking.
- Preference for continuity. A strong majority (88.5 %, top-2 share) favoured option A, valuing its practicality and comparability.
- The ‘burden’ constraint. Respondents emphasised that any methodological change must reduce, not increase, the administrative burden. There were specific requests to address the overlap with the OECD OURdata reporting to prevent duplication of work.
Phase 3: strategic refinement
Based on the consultation evidence, the study moved away from radical structural changes towards a ‘no regrets’ operational strategy, defining an ‘enhanced option A’. This phase focused on refining the self-assessment model to address credibility gaps without breaking continuity. The questionnaire was streamlined to map directly to the OECD OURdata framework where possible, allowing for single-source reporting. Simultaneously, the study designed the technical quality index (TQI) not as a replacement score but as a background validation mechanism. This ensures that objective signals (from MQA and portal tests) trigger moderation only when self-reports diverge significantly from the technical reality.
Phase 4: finalisation and implementation roadmap
The final phase translated the selected methodology into a concrete operational plan. A phased roadmap was developed to introduce changes gradually, starting with ‘no regrets’ streamlining in 2026 before introducing more advanced validation mechanisms. The team produced the final technical specifications for the revised questionnaire and communication assets to support Member States, specifically addressing how the new method improves the cost-benefit ratio of participation.
2.2. Key data sources
The study relied on three evidence streams: a legislative gap analysis, technical feasibility testing of automated tools and a targeted stakeholder consultation.
2.2.1. Legislative mapping activity
The research team conducted a comprehensive mapping of the European data legislative framework to ensure the revised ODM methodology reflects both current legal obligations and the strategic direction of future EU policy (39). This analysis distinguishes between the existing baseline (what Member States must currently implement) and the future consolidation proposed by the Digital Omnibus Regulation.
The current ODM methodology focuses heavily on the transposition of the Open Data Directive. However, the entry into force of Implementing Regulation (EU) 2023/138 (the High-Value Dataset (HVD) Implementing Regulation) in June 2024 shifted the compliance landscape from broad policy principles to specific technical mandates.
Member States must make datasets in six thematic categories available via APIs and bulk download, under specific open licences. The study identified this regulation as the primary driver for automating the quality and portal dimensions. Because the requirements are technical and binary (e.g. ‘Is the API available?’), the revised ODM methodology moves away from asking countries if they have published HVDs to verifying how they are published using automated scripts.
Since the last ODM revision, the DGA and the Data Act have entered into application. These acts expand the scope of government data policy beyond simple open data to include the reuse of protected public sector information and business-to-government data sharing. The DGA mandates the establishment of national single information points to facilitate the reuse of protected data. The Data Act creates mechanisms for public sector bodies to access private sector data in exceptional circumstances. The policy dimension of the ODM assessment was updated to assess the operational status of these governance bodies (e.g. competent bodies for data altruism). The Portal dimension analysis confirmed that while national single information points can be separate entities, the ODM assessment must assess the interoperability and discoverability of these protected assets via the main national open data portals.
The study incorporated the strategic trajectory set by the Digital Omnibus Regulation proposal (COM(2025) 837 final). While not yet law, this proposal signals a move towards legal consolidation. It proposes repealing the Open Data Directive and the DGA as standalone acts and integrating their provisions into a unified Data Act. The proposal narrows the scope of business-to-government sharing to ‘public emergencies’, simplifies the registration regime for data intermediaries and extends small and medium-sized enterprise cost-reduction privileges to small and mid-caps. To future-proof the assessment, the study removed draft indicators that focused on bureaucratic requirements likely to be repealed (such as national rulebooks for data altruism). Instead, the revised methodology focuses on market uptake indicators (e.g. number of intermediaries) which remain relevant under both the current and future regimes. Furthermore, the impact dimension was adjusted to specifically capture reuse benefits for small and mid-caps, anticipating their elevated status in the emerging legal framework.
Open data maturity assessment as a strategic steering tool
As the EU data acquis shifts from the siloed Open Data Directive to the consolidated frameworks of the DGA and the future unified Data Act, the ODM assessment should continue to help translate complex legal obligations into measurable operational targets. It can still provide Member States with a structured roadmap for implementation, ensuring that national strategies align not only with current mandates (such as the technical requirements for HVDs) but also with the strategic rationalisation proposed by the Digital Omnibus Regulation. It should allow national teams to identify compliance gaps early, reducing the risk of infringement and ensuring their national frameworks remain interoperable within the single market.
The comparative nature of the assessment provides national open data teams with the evidence required to secure political support and funding. By benchmarking performance against peers, Member States can justify resource allocation for technical upgrades (e.g. API infrastructure) or governance reforms. The detailed scoring allows administrations to demonstrate return on investment to national treasuries, shifting the internal narrative from the cost of data publication to the value of digital infrastructure.
The integration of automated metrics (the TQI) transforms the assessment from a retrospective reporting exercise into a diagnostic tool. By monitoring API stability, metadata quality and machine readability, the ODM assessment will provide Member States with actionable technical feedback. This allows portal managers to detect and rectify interoperability issues that hinder cross-border reuse, ensuring their national infrastructure connects effectively with the broader European data space without requiring manual audits.
Finally, the revised assessment should support participating countries in answering the critical question of usage. By systematically gathering reuse cases and integrating feedback from the reuser community, the ODM assessment shifts the focus from the supply of data (volume) to the demand for data (value). This helps national administrations understand which datasets generate economic and societal value, enabling them to prioritise high-impact domains and foster a data culture that delivers tangible benefits to citizens and businesses.
2.2.2. Technical feasibility assessment of objective data sources
To determine the viability of reducing reliance on self-assessment, the research team conducted a multi-layered feasibility assessment. This process involved an audit of historical data, a stress test of existing automated infrastructure and a pilot of proposed new metrics.
Longitudinal analysis of historical open data maturity data
The study began by analysing the dataset of previous ODM assessments (2018–2024) to identify structural weaknesses in the current self-reporting model. A saturation analysis of longitudinal scoring trends revealed that scores in the policy dimension have become compressed at the top end of the scale, with many countries consistently scoring 100 %. This ceiling effect reduces the assessment’s ability to differentiate between high-performing countries and confirms the need for more granular, objective metrics in mature dimensions. Furthermore, an analysis of year-on-year volatility highlighted that the impact dimension fluctuates significantly due to the subjective interpretation of what constitutes a reuse case. This reinforces the need for a tighter, evidence-based definition of impact.
Stress-testing the metadata quality assessment
The study assessed the readiness of the MQA dashboard to serve as a primary scoring mechanism for the quality dimension. Statistical correlations run between countries’ self-reported quality scores and their actual MQA performance revealed a divergence, where some participating countries reporting high maturity received low MQA scores. While MQA (in theory) provides a standardised, cross-border metric for findability and accessibility, the study identified a critical dependency on the harvesting pipeline. Technical errors in harvesting can artificially lower a country’s score regardless of the actual data quality. Consequently, MQA scores are feasible as a validation signal to trigger moderation but are not yet robust enough to serve as a stand-alone replacement score without a dispute resolution mechanism. The use of MQA continues to improve, but is not yet fully reliable.
Automated portal performance and application programming interface analysis
Building on the pilot indicators introduced in 2024, the study tested the scalability of automated scripts to measure the portal dimension. Standardised tests for site speed, mobile friendliness and accessibility proved to be highly robust, binary metrics that require no manual interpretation. The team also explored the feasibility of scraping national portal APIs to verify data provision claims. This proved technically complex due to the diversity of portal architectures across the EU. The study concluded that maintaining bespoke scrapers for 35 different architectures is not cost-effective for the central team.
Feasibility of impact metrics
The study integrated findings from the parallel research project ‘Measuring Open Data Impact’ to assess whether impact can be consistently measured quantitatively. The pilot confirmed that macroeconomic indicators such as GVA and employment are feasible if necessary coefficients calculated centrally. A model-based approach, where the Commission ideally suggests a central set of coefficients which Member States apply to national baselines, was proven to be a low-burden method ensuring high comparability. Conversely, attempts to measure strategic autonomy by analysing traffic logs (in detail) to identify non-EU data harvesting were deemed infeasible due to GDPR restrictions on processing IP addresses. Broad geographic location can be logged, but it is unclear how accurate the dataset would be given broad use of VPNs (virtual private networks) and other masking activity. Similarly, the automated scraping of reuse cases was deemed unreliable as a primary indicator because national reuse repositories are often outdated and non-representative. Measuring reuse requires active curation and resource allocation rather than passive scraping.
2.2.3. Targeted stakeholder consultation
To validate the initial diagnostic findings and co-design a feasible path forward, the study employed a structured consultation strategy. This engagement was designed to move beyond general feedback and gather specific, operational insights from the national teams responsible for implementing the ODM assessment.
The stakeholder survey (2025)
The primary instrument for consultation was a comprehensive online survey distributed to the public sector information (PSI) expert group. The survey was structured to capture both quantitative preferences and qualitative insights on the future of the assessment. The survey received 26 responses from national representatives, providing a robust sample size that reflects the diversity of the European open data landscape. Participants included a mix of ‘trendsetter’ nations (e.g. France, Poland, Spain) and countries with developing open data programmes (e.g. Malta, Hungary, Slovakia), ensuring that the resulting recommendations address the needs of both advanced and resource-constrained administrations.
The questionnaire interrogated four dimensions:
- value and usage, i.e. how Member States currently utilise ODM results (e.g. for political leverage versus internal benchmarking);
- strategic direction, i.e. preferences for future methodological models (e.g. option A versus option C).
- operational burden, i.e. feedback on the resource implications of the current questionnaire versus potential automated alternatives.
- new priorities, i.e. identification of emerging topics for inclusion, such as AI readiness and digital sovereignty.
To complement the survey data, the research team conducted a series of semi-structured interviews with selected national coordinators. These deep-dive sessions focused on clarifying the practical implications of proposed changes, particularly regarding the feasibility of automated harvesting and the integration of national portal APIs.
The 2025 data providers workshop
A dedicated workshop session with open data experts from all EU Member States was held in Tallinn. This session served as a validation checkpoint, allowing the research team to present preliminary findings and test the ‘enhanced option A’ concept in a live setting. The discussion provided critical qualitative context, particularly regarding the need for better alignment with OECD initiatives and the practical limitations of ‘single score’ automation.
NB: A detailed analysis of the consultation results, including specific preferences for methodological options and feedback on indicator design, is presented in section 4.2.
3. Diagnostic: the case for change
As the focus of European data policy shifts from initial setup to operational performance and impact, the structural limitations of the current methodology have become increasingly apparent. This chapter presents a diagnostic review of the existing framework, synthesising evidence from external critiques, relevant research and stakeholder feedback.
The analysis identifies three friction points that necessitate a methodological revision. First, the reliance on self-assessment (although it has many benefits) potentially creates an increasing credibility gap, where subjective reporting carries a risk of an upward drift in scores and misaligned incentives. Second, the administrative burden on Member States needs to be minimised, including by reducing overlaps with the OECD OURdata Index and other initiatives if possible. Finally, there can be a gap between policy claims and technical (reuser) reality, where high maturity scores do not always correlate with the functional quality of data provision reusers expect. Addressing these issues is the prerequisite for ensuring the ODM assessment remains a trusted and relevant benchmark for the next decade. And most importantly continues to deliver value for Member State actors.
3.1. Addressing any limitations of the current self-assessment model
The ODM assessment was originally designed as a capacity-building instrument. By allowing participating countries to self-report on their progress, it encouraged national coordinators to take ownership of their data strategies and internalise the requirements of Directive (EU) 2019/1024 (the Public Sector Information Directive). As the policy context has evolved and expectations around digital performance have increased, there is an opportunity to further enhance the methodology’s value for stakeholders. In particular, complementing self-assessment with more automated metrics and a stronger user-centric perspective could improve efficiency, usability and the operational relevance of results. The diagnostic phase of this study indicates that the current approach may be influenced by optimistic bias, whereby scores can reflect reporting capability as well as underlying technical maturity. Addressing this through more data-driven and user-oriented mechanisms would support more consistent insights while strengthening confidence in the assessment as a by-product.
External scrutiny, most notably the 2024 critique by the CEPS, has highlighted the inherent vulnerability of the ranking to strategic reporting. Because high performance in the ODM assessment is frequently used by national administrations to demonstrate digital leadership to ministers and the public, there is a strong incentive to interpret qualitative questions in the most favourable light. The CEPS analysis pointed to specific anomalies, such as rapid year-on-year jumps in maturity rankings that did not correspond with observable changes in the data ecosystem, or the citation of low-quality evidence (such as student theses) to substantiate national impact claims. While the current methodology includes a manual validation round, the sheer volume of qualitative claims makes it impossible for central researchers to forensically verify every response. This structural weakness risks reducing the ODM assessment to a measure of ‘compliance reporting’ rather than actual operational maturity.
This inflationary pressure is empirically visible in the scoring distribution. Historical analysis of ODM results from 2018 to 2024 reveals a distinct ‘ceiling effect’. In the policy dimension specifically, a significant proportion of participating countries now consistently score near 100 %. This saturation occurs because the current questionnaire largely measures the existence of frameworks (e.g. ‘Do you have a strategy?’) rather than the quality of their implementation. For example, in the survey, France highlighted that this is becoming a challenge, as the open data topic is perceived as already sufficiently advanced and therefore no longer a priority. This further underlines the need to approach ODM from the perspective of maintaining its relevance for stakeholders, by ensuring it continues to provide tangible value rather than being seen as a purely reporting exercise. Once a country has ticked the ‘Yes’ box, the methodology offers little room to differentiate between a static document and a dynamic, effective strategy. Consequently, the assessment is losing its power to distinguish between the very best performers, reducing its utility as a strategic steering tool for advanced data ecosystems.
The technical feasibility pilots conducted during this study provided quantitative evidence of this credibility gap. By correlating self-reported scores in the quality dimension against objective metrics from for example the MQA dashboard, the research team identified divergences. Several participating countries that self-assessed as having ‘advanced’ quality assurance processes recorded mediocre scores on objective metrics such as link accessibility and machine-readability. This disconnect suggests that either: national coordinators evaluate their maturity based on the intent of their policies rather than the output of their portals; or the MQA outputs are not yet reliable enough to be used for validation. In any case: without an objective technical baseline to anchor these self-assessments, the ODM assessment risks presenting a distorted picture of European data integration.
The stakeholder consultation conducted in late 2025 confirmed that this potential credibility gap is a concern for Member States themselves. While national coordinators value the autonomy of the self-assessment, survey responses indicated a recognition that the current system lacks rigour. When asked about the value of strengthening validation, a significant segment of respondents supported the introduction of peer review processes and automated checks, noting that the current results can be ‘too high-level’ or disconnected from ‘real reuse’. This feedback underscores that the legitimacy of the ranking is paramount; if the scores are perceived as inflated or unverifiable, the ODM assessment loses its value as a tool for securing political support and budget for national data teams. Therefore, evolving the validation mechanism is not just a methodological rectification, but a necessary step to maintain the political capital of the assessment.
3.2. Administrative friction and reporting fatigue
While the depth of the ODM assessment provides granular insights, the cost of generating this intelligence falls in part on national administrations. The diagnostic review reveals that the administrative burden has grown, creating a friction that threatens the sustainability of the assessment. This burden is composed of three distinct structural pressures: the complexity of the instrument, increasing internal coordination costs and strategic duplication.
The ODM assessment questionnaire has necessarily expanded over its decade-long lifespan. What began as a readiness check has evolved into an audit like activity comprising hundreds of data points, requiring detailed qualitative justifications. The stakeholder consultation identified ‘high costs or limited staff capacity’ and ‘time-intensive processes’ as the top barriers to participation, cited by nearly 80 % of respondents.
The current format (primarily a manual, offline Excel-based exercise) exacerbates this fatigue. National coordinators report that the binary nature of many questions (‘Do you have X?’) forces them to produce lengthy narrative justifications to explain nuances or partial implementation, turning the assessment into a significant copywriting exercise. For administrations with smaller teams (e.g. Malta, Cyprus) or those facing budget cuts, the sheer volume of questions required to ‘prove’ maturity diverts resources away from actual data publication and portal maintenance.
The burden is not merely the time spent filling in cells; it is the cost of internal coordination. As the scope of the ODM assessment has widened to cover impact, quality and regional governance, the data required to answer the questionnaire no longer sits within a single team. To answer questions on portal traffic, API usage or specific reuse cases, national coordinators must solicit data from technical teams, statistical offices and line ministries. Feedback from interviews highlighted that national coordinators spend a disproportionate amount of time ‘chasing’ internal stakeholders for data points that could (in the perception of stakeholders) be automated. Some stakeholders identified issues with obtaining data regarding local and regional data availability, where central federal teams often lack direct visibility and must conduct their own internal surveys to report back to the Commission. There is the potential for an increasing ‘survey within a survey’ dynamic that multiplies the administrative workload.
Strategic duplication? The Organisation for Economic Co-operation and Development overlap
While not the sole source of burden, the lack of alignment with the OECD OURdata Index potentially represents an inefficiency (in the perception of stakeholders). Both instruments measure essentially the same phenomenon (public sector data maturity), but do so using different taxonomies (for example on HVDs), timelines and definitions. The question from stakeholders is then ‘what should remain specific to the EU and what should remain specific to the OECD?’ The perception is that Member States are effectively asked to report on their open data strategy or HVD compliance twice. The stakeholder survey explicitly highlighted this as a frustration, with respondents asking if a ‘single submission’ model was possible. The friction is not just duplication but divergence. Small differences in definitions (e.g. how ‘data reuse’ is defined by the OECD versus the ODM assessment) force national teams to maintain two sets of compliance logic, potentially increasing the cognitive load and the risk of inconsistent reporting between international bodies. The extent of this problem does, however, tend to be overstated, as we explore in further detail later in this report.
Effort–value balance
Burden should be considered in relation to value. While a relatively high workload can be acceptable where it delivers strong strategic insights, the assessment indicates a declining balance between effort and value for some consistently high-performing countries. Survey results similarly suggest that a notable share of stakeholders perceive that the benefits do not fully justify the effort required. The qualitative feedback indicates that while the ranking (the final score) provides political leverage, the feedback provided is often perceived as too generic or high-level to drive operational improvements. While the assessment can require a significant level of effort, this should be considered in relation to the value it delivers. Some feedback suggests that, in a limited number of cases, stakeholders perceive the outputs as more descriptive than operational, which can influence how the effort–value balance is experienced. This points to an opportunity to further enhance the practical usability of results, for example by strengthening actionable insights or complementary diagnostics. A gradual evolution in this direction could help ensure that the framework continues to meet diverse stakeholder expectations while maintaining its existing strengths.
3.3. Potential divergence between reported maturity and objective reality
A central finding of the diagnostic phase is the potential for divergence between the maturity levels reported by national administrations and the technical performance observed through automated tools. This technical gap does not necessarily imply inaccuracy or misreporting; rather, it highlights a fundamental difference in perspective between policy intent and operational reality. While self-assessment effectively captures the existence of governance frameworks and the ambition of national strategies, objective metrics reveal the friction points that occur when these policies meet the complex technical infrastructure of the web.
The comparison of self-reported scores against data from the MQA dashboard reveals distinct patterns of divergence. In the self-assessment, nearly all participating countries report having high standards for data accessibility and open licensing. However, automated crawling can tell a different story. MQA data frequently flags significant percentages of datasets with broken download links (404 errors) or missing machine-readable licence information. This discrepancy often arises because national coordinators report on the policy requirement (e.g. ‘All data must be CC-BY’), while the automated tool measures the implementation error rate (e.g. how many datasets actually have that licence field correctly tagged in the metadata). We can see that both perspectives are true, but they measure different layers of maturity.
Similarly, while countries may self-assess as highly mature in terms of portal features, technical tests on API performance and DCAT-AP (data catalogue vocabulary – application profile) compliance often show lower scores. This gap illustrates that while a central portal may be feature-rich, the harvesting pipelines connecting it to regional or sectoral data sources may be technically fragile, resulting in metadata loss that is invisible to the policy team but highly visible to an automated harvester.
Crucially, the diagnostic analysis also confirmed that objective metrics are not infallible. The technical pilots demonstrated that automated tools have their own blind spots that can lead to unfair assessments if used in isolation. A country’s MQA score is entirely dependent on the successful technical harvesting of its metadata by the European Data Portal. It should be noted that current MQA calculations are not yet fully accurate and the tool is currently undergoing a redesign. If a national portal undergoes maintenance or changes its API structure, its automated score can plummet to zero overnight, despite the data remaining fully available to local users. In such cases, the ‘objective’ metric fails to reflect the national reality.
Automated scripts can verify the presence of a feedback button or a usage story, but they cannot assess the quality of the user engagement or the impact of the reuse case. A country might score low on an automated ‘social impact’ metric because it does not use standard HTML tags for its impact stories, even if it has a thriving, offline ecosystem of data reusers.
The technical gap is not a failure of one method over the other, but a signal that neither approach is sufficient on its own. Self-assessment provides the necessary context, capturing the legal, political and organisational efforts that automation cannot see. It measures the ‘input’ and ‘process’ layers of maturity. Objective metrics provide the necessary verification, capturing the tangible ‘output’ and ‘outcome’ layers (the actual digital artifacts that users interact with).
4. Strategic direction: selecting the future model
The diagnostic assessment presented in the previous chapter established a clear imperative for change: the ODM assessment must evolve to address credibility gaps and reduce administrative burden. However, the path to achieving these goals is not singular. The research team identified three distinct strategic trajectories for the evolution of the ODM assessment, ranging from a moderate update of the existing system to a radical restructuring based on automated metrics.
This chapter outlines the process of selecting the future model. It details the three conceptual (and not mutually exclusive) options developed during the design phase ((a) moderated self-assessment, (b) balanced scorecard and (c) single hybrid score) and evaluates them against the constraints of technical feasibility and political reality. Drawing on important feedback from the stakeholder consultation, this chapter explains the rationale for rejecting a purely automated ‘black box’ approach in favour of a pragmatic ‘enhanced option A’. This selected path prioritises the stability and continuity valued by Member States while introducing the necessary technical rigour to maintain trust in the ranking.
4.1. The three conceptual options explored
To address the diagnostic challenges outlined in chapter 3, the research team designed three distinct methodological models. These options represent a spectrum of change, ranging from a continuity-first approach to a radical automation-first restructuring. Each model was developed with specific reference to the four existing ODM dimensions (policy, portal, quality and impact) to assess feasibility at the indicator level.
Option A: statistically moderated self-assessment
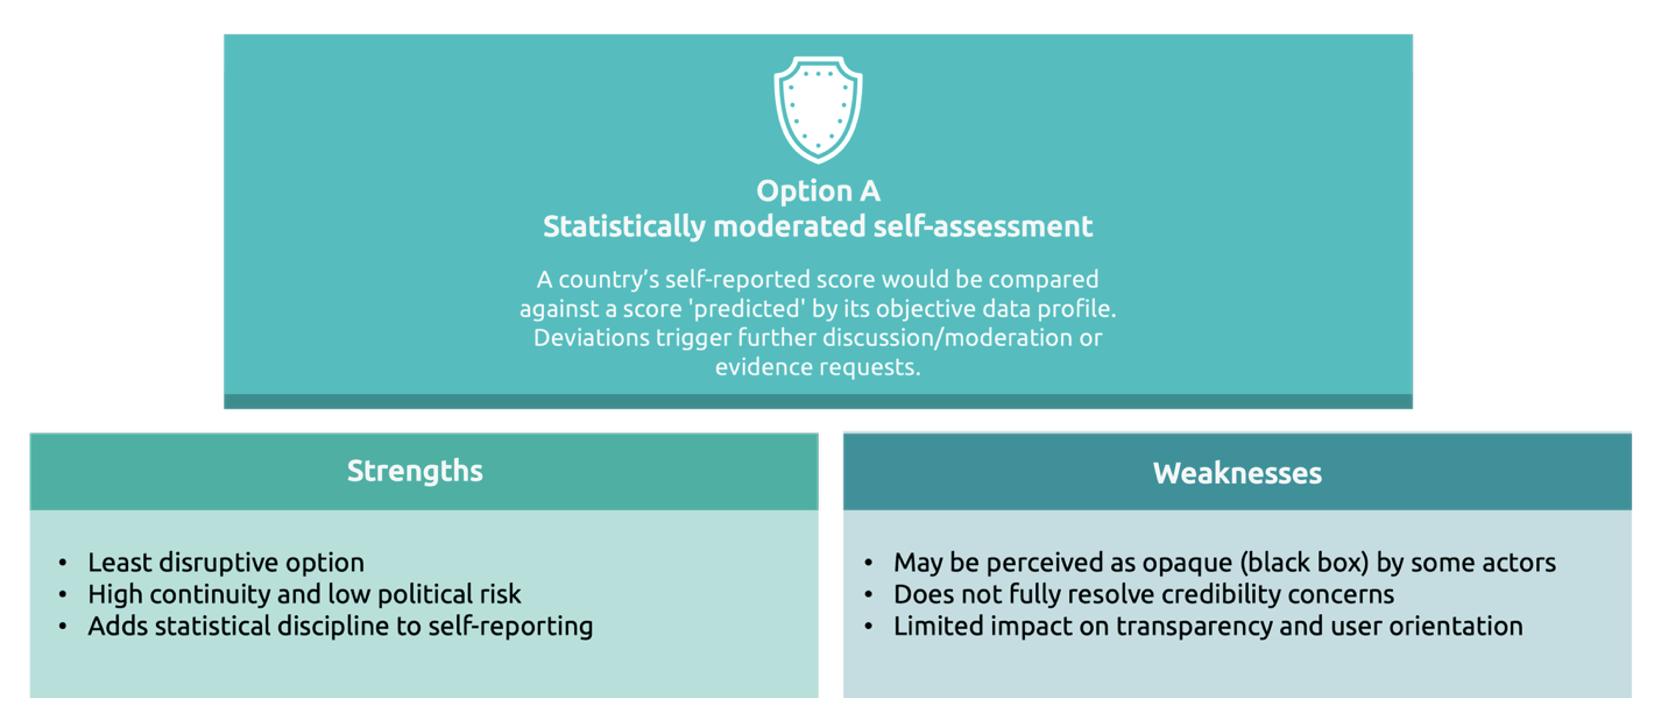
Option A was designed as the continuity choice. It would retain the four-dimensional structure (policy, portal, quality and impact) and the self-assessment questionnaire as the primary instrument for data collection. This preserves the granular longitudinal data series that allows participating countries to track progress on specific indicators (e.g. strategy implementation or data provision) over time. However, it would also introduce a rigorous statistical validation layer in the back end to mitigate score inflation.
Under this model, the self-assessment process would continue largely as is (with an optimised questionnaire), but the validation phase is transformed. Instead of relying solely on manual document checks, the process introduces dimension-specific shadow scores derived from trusted quantitative data sources:
- self-reported scores on metadata currency and DCAT-AP compliance are cross-referenced against the MQA dashboard;
- self-reported claims about portal features (e.g. API availability, performance) are checked against automated scripts testing uptime and response latency;
- claims of high economic or social impact are correlated against macroeconomic indicators and verified reuse cases.
The final ODM score remains an aggregation of the four dimension scores (weighted equally at 25 % each). However, individual indicator scores within these dimensions are subject to moderation. If a significant divergence is detected (for example, if a country scores 100 % on the self-assessed ‘portal maturity’ dimension but its ‘shadow portal score’ (based on automated tests) is in the bottom quartile) a moderation flag is triggered. This initiates a mandatory and collaborative review where the participating country must provide and discuss additional, verifiable evidence. If the evidence is insufficient, the specific indicator score is adjusted downwards to align with the objective reality.
Option B: balanced scorecard with complementary indices
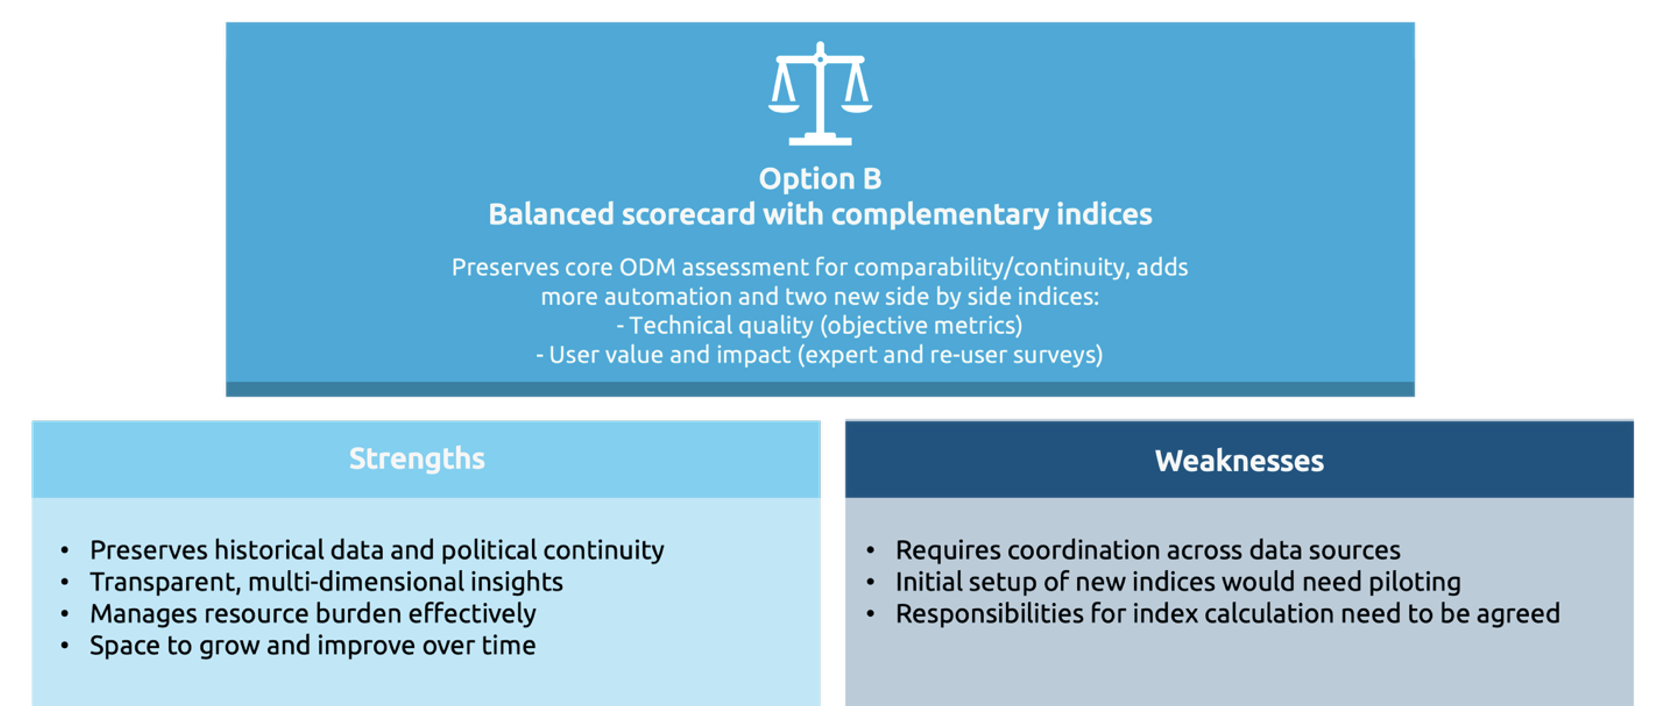
Option B proposes a structural decoupling of the assessment. It acknowledges that maturity is a multi-dimensional concept that cannot be neatly compressed into a single ranking without losing nuance. This model abandons an ideal of aggregated ranking in favour of a balanced scorecard approach, presenting countries with a dashboard of distinct performance indices that are assessed and scored independently.
This model would split the assessment into three parallel tracks in place of the current four-dimension structure.
- Policy and governance index. Measured via a streamlined self-assessment questionnaire, focusing purely on legal transposition, national strategies and coordination structures (absorbing the current policy dimension).
- Technical quality index. Measured exclusively through automated tools (MQA, scripts), focusing on the operational reality of the portal and datasets (absorbing the quality and portal dimensions and focused on open data outputs at the national level).
- User value index. Measured via a new survey instrument targeting external stakeholders to assess practical utility and reuse (absorbing the impact dimension and therefore focused on outcomes at the national level).
There is no single ranking or ODM score. Instead, countries receive three separate scores on critical issues for open data maturity (e.g. 90 % policy, 60 % technical, 40 % user value). This approach would eliminate the need to weight disparate data types against each other. It would provide a more transparent picture of a country’s profile (highlighting, for instance, a country that has very strong policy frameworks but poor technical execution/infrastructure. Support could then be targeted where it is most needed.
Option C: single hybrid score
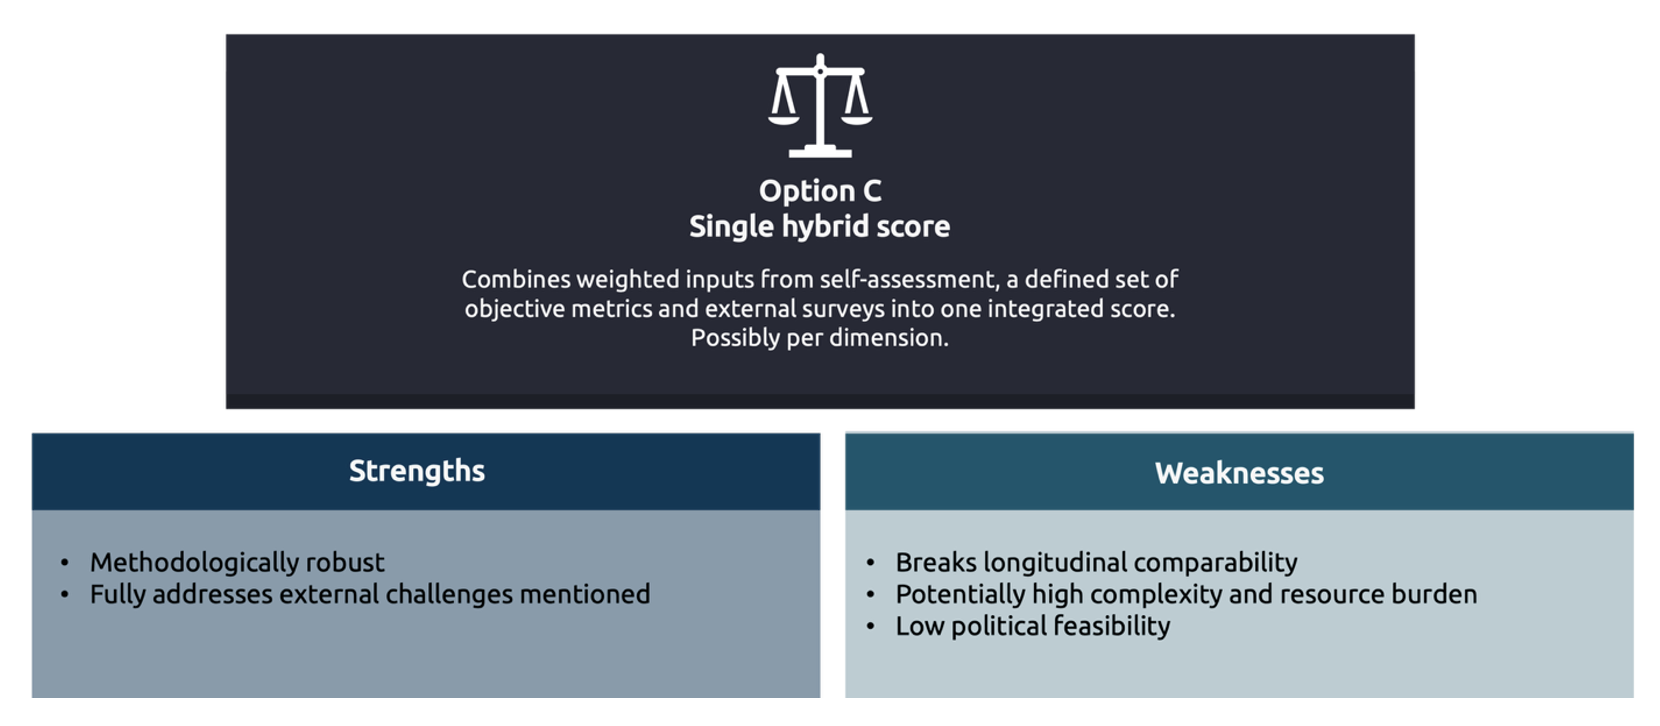
Option C represents the most radical departure from current practices. It aims to fully resolve any potential credibility gap by integrating all data sources into a single, definitive ‘open data performance score’. This model would treat objective metrics and external user as direct, weighted components of the final score for each dimension.
This model would function as a weighted algorithm that restructures the four dimensions.
- Policy would remain largely self-assessed but with stricter evidence requirements.
- Portal and quality would be heavily automated. Self-assessment questions would be stripped out and replaced by direct feeds from the MQA and portal testing scripts.
- Impact would be remodelled to include direct input from external experts and reusers via a standardised pan-European survey (or similar data collection exercise linked to the European data market study), reducing reliance on (but still including) national coordinators’ own impact reports.
The final score would then be a composite calculation. For example, the quality dimension score might be calculated as:
Score = (30 % × self-assessment) + (70 % × automated MQA score)
This then full integrates technical performance into the ranking. A country with perfect policy documents but a broken portal API would mathematically be unable to achieve a top-tier ranking in the portal or quality dimensions. While this offers the highest level of theoretical rigour, it breaks the historical time series for the quality and portal dimensions entirely, making year-on-year comparisons impossible for the first year of implementation. It also introduces opportunities to exploit specific quantitative metrics and data collection processes.
To determine the most viable path for the ODM assessment’s evolution, the study engaged with the national representatives responsible for the assessment. the study engaged with the national representatives responsible for the assessment, notably through the stakeholder survey conducted in late 2025 (see section 2.2.3). This qualitative and quantitative feedback was cross-referenced with the results of the technical feasibility pilots to assess the gap between political desirability and operational reality.
4.2. Stakeholder views on the strategic options
Member States expressed a decisive preference regarding the three potential future models proposed. The survey results revealed a strong consensus in favour of option A (statistically moderated self-assessment). Approximately 88.5 % of respondents ranked this option among their top two preferences. The qualitative feedback indicates that this preference is driven by a desire for longitudinal continuity; national coordinators value the ability to track progress against historical baselines and fear that a radical methodological break would undermine their ability to demonstrate long-term improvement to national political leadership. They also see value in the self-assessment process itself, although they would like it to be optimised.
In contrast, option C (development of a single hybrid score) received significantly lower support as a primary choice. While stakeholders acknowledged its theoretical robustness, many expressed concern that hard-wiring automated metrics into a single score would create a black box algorithm, reducing transparency and making it difficult to diagnose specific areas for improvement. Furthermore, several administrations noted that a purely automated score would unfairly penalise countries with technically advanced but decentralised data architectures that do not interact perfectly with central European harvesters. Option B (balanced scorecard) was viewed as a credible alternative by some, particularly for its ability to provide nuanced profiles, but was ultimately seen as introducing unnecessary complexity in communication.
A recurring theme throughout the consultation was the administrative burden associated with large maturity assessments. This burden could be mitigated by reducing duplication between the ODM assessment and the OECD OURdata Index. Respondents highlighted areas of perceived overlap and emphasised the importance of stronger alignment, including the use of common terminology, shared data sources and opportunities to reuse submitted information.
At the same time, stakeholders recognised the distinct role of ODM in supporting EU-specific policy and legislative objectives, particularly in relation to the public sector information framework. In this context, the ODM assessment is seen as an essential instrument for capturing dimensions that require an EU-focused perspective and cannot be fully addressed by broader international benchmarks.
Feedback therefore points towards the value of improved complementarity rather than convergence. This includes clearer articulation of the respective scopes and closer coordination between the two frameworks, while ensuring that the ODM assessment retains its capacity to reflect the EU policy environment. Overall, reducing duplication and strengthening coherence is seen as important for maintaining engagement, while any changes that increase reporting effort without clear added value may require careful consideration.
The consultation also stress-tested the feasibility of replacing manual questions with automated metrics. The feedback revealed a sharp distinction between what is desirable and what is currently possible.
There is strong support for automating the assessment of metadata quality using the MQA dashboard. However, Member States cautioned that this must be accompanied by a dispute resolution mechanism. As noted by representatives from Germany and the Netherlands, automated harvesting errors (e.g. temporary API outages) can result in MQA scores that do not reflect the actual quality of the national catalogue. Therefore, automation is feasible only as a validation signal rather than a definitive, unmoderated score.
The feasibility analysis confirms that automating the impact dimension is currently impossible. Survey respondents rated the availability of data on volume and distribution of reuse cases significantly lower (2.62 out of 5) than portal metrics. Most Member States lack a systematic, machine-readable registry of reuse cases. Consequently, the study concludes that impact assessment must remain a qualitative, human-curated exercise for the medium term.
Despite the concern regarding burden, stakeholders expressed a clear demand for the ODM assessment to evolve in specific thematic areas. There was broad consensus that the assessment must capture AI readiness (availability of high-quality data for model training) and real-time data capabilities. However, respondents emphasised that these new topics should be introduced as experimental or optional modules initially, rather than core scoring criteria, to allow national ecosystems time to mature.
Synthesising these findings, the study rejects an immediate move to options B or C. The trade-offs regarding continuity and transparency are considered too high by the Member States. Instead, the analysis points to a hybrid solution that was not explicitly defined at the outset but emerged from the consultation: an ‘enhanced option A’. This model retains the self-assessment structure (satisfying the need for continuity) but streamlines the questionnaire, introduces peer review of the questionnaire and introduces some of the automated metrics of options B and C strictly as backend validation tools (satisfying the need for increased credibility).
4.3. Better defining an ‘enhanced option A’
The convergence of stakeholder preferences and technical realities points to a clear strategic direction. While the pure ‘single hybrid score’ (option C) offers theoretical objectivity, its implementation would sever the longitudinal time series and Member State participation that gives the ODM assessment its political weight. Conversely, maintaining the status quo is untenable given the demands for reduced administrative burden and higher data reliability.
This study recommends a hybrid model that was not explicitly defined in the initial options analysis but emerged as the necessary synthesis of the evidence: an ‘enhanced option A’.
This model resolves the central tension of the study (the conflict between the Member States’ desire for continuity and the need for greater rigour and less burden) by upgrading the quality of the input instrument. Under the enhanced option A, the self-assessment remains the primary scoring mechanism, preserving historical comparability. However, the instrument itself is optimised through a new cycle of independent review and consolidation.
A three-pillar strategy
1. Structural consolidation (‘less is more’)
The primary strategic shift is a consolidation and validation of the questionnaire. The diagnostic phase revealed that the expansion of the current survey has introduced some redundancy, with multiple binary questions often probing the same underlying topic. The new strategy replaces this volume with precision by doing the following.
- Merging overlaps. Distinct questions regarding policy and strategy documents are merged into single, coherent items. Fragmented questions on portal features (e.g. separate items for feedback, ratings and interaction) are consolidated into broader capability indicators.
- Moving from binary to graduated scales. The methodology moves away from binary yes/no questions, which are prone to box-ticking compliance. Instead, it introduces graduated maturity scales (e.g. non-existent / planned / operational / optimised) and quantitative prompts (e.g. % of datasets). This allows the assessment to capture the degree of implementation rather than just the existence of a feature, providing a more realistic picture of maturity without increasing the question count.
2. Independent peer review of the methodology
To prevent ambiguity and interpretation errors (a primary source of inconsistency in self-assessments) the study introduces an annual independent peer review of the questionnaire itself. Before each assessment cycle, the questionnaire (specifically new or revised sections) could be audited by an individual or panel of external experts (e.g. academics, data journalists, technical architects).
To operationalise an independent peer review in a proportionate and repeatable way, the European Data Portal team could establish a small ‘ODM method expert circle’ under a simple terms of reference. The objective would be to review the questionnaire ex ante, focusing on clarity, technical soundness and consistent interpretation.
Option 1 – establishing an expert circle (three to five members): (i) publish a short call for expressions of interest via European Data Portal channels and relevant professional networks; (ii) complement this with targeted invitations to ensure coverage of key profiles (e.g. open data methodology research, data journalism / reuse experience and portal/metadata standards expertise); and (iii) apply a brief conflict-of-interest screen (e.g. no current role in completing a national ODM questionnaire for the cycle under review). The expert circle would work to a fixed annual timetable (e.g. a two-to-three week review window, six to eight weeks prior to questionnaire launch) and deliver a short calibration note with concrete, prioritised edits (definitions, response scales, evidence requirements and examples). The Commission / service team would retain decision-making responsibility, documenting which recommendations were adopted and why.
Option 2 – appointing a single lead reviewer (with optional ad hoc support). If a panel is not feasible initially or considered proportionate, an equivalent approach is to appoint one independent lead methodology reviewer (e.g. a senior academic or recognised practitioner with questionnaire design and open data standards expertise) to conduct the annual ex ante audit and produce the calibration note. To reduce single‑point dependency, the lead reviewer could be supported by one or two ad hoc specialist reviewers on specific modules when needed (e.g. HVD tagging/metadata, API / portal testing, impact measurement integration).
In both models, the process can be standardised through: a short terms of reference (scope, outputs, timing, confidentiality), a simple conflict-of-interest declaration and a clear deliverable template (issues list with proposed wording changes and rationale).
The role of this review is not to assess country performance but to assess the instrument. Using a panel would ensure definitions are precise, questions are technically sound and scoring logic is unambiguous. But an individual from the academic sector would also be sufficient.
By calibrating the tool before it is deployed, the ODM assessment removes any interpretative wiggle room that allows for score inflation. This ensures that when participating countries self-assess, they are responding to a scientifically robust instrument that leaves little room for subjective error.
3. Algorithmic moderation (development of a technical quality index)
To secure ongoing credibility of this consolidated self-assessment, some of the automated metrics originally proposed for Option C would be retained as a backend validation layer. These metrics (MQA scores, automated portal performance tests, API analytics) would be consolidated into a TQI. This index acts as a ‘shadow rating’ or boundary control. It would not replace the self-assessed score, but if a country’s self-assessed maturity significantly exceeds its TQI performance, a moderation protocol would be triggered. This would ensure qualitative claims are statistically consistent with the technical reality observed on the portal.
Key issue: integrating the EU open data impact measurement framework
A critical component of the ‘enhanced option A’ strategy is the direct integration of the newly developed open data impact measurement framework. Historically, the ODM assessment’s impact dimension has relied on qualitative narratives and anecdotal reuse cases, which, while illustrative and an important source of information, lack comparability and economic specificity. The parallel study on measuring impact provides the necessary methodological infrastructure to resolve this.
The revised ODM would adopt the thematic impact indicators defined in that framework as its standard reporting metrics where possible. Specifically, the self-assessment would move away from open-ended questions about impact towards structured reporting on employment, GVA, environmental governance and AI readiness. Crucially, this integration reduces the burden on Member States by introducing the model-based estimation approach proposed by the impact study. Rather than requiring national administrations to conduct expensive, bespoke economic research, the ODM assessment will utilise the available central EU research (e.g. from the European data market study). This ensures that when participating countries report on economic impact, they are doing so using a harmonised, scientifically validated formula rather than divergent national estimates.
To make the integration operational, the questionnaire would include a short ‘impact indicators’ module within the impact dimension, accompanied by guidance notes that specify definitions, data sources and the calculation approach. In practice, this would mean replacing several open-ended narrative prompts with structured indicator fields aligned to the thematic indicators of the EU open data impact measurement framework. By embedding these standardised definitions and calculation methods directly into the questionnaire guidelines, the ODM assessment would evolve from measuring the intention to create impact (maturity) to monitoring the actual socioeconomic value generated (performance). This alignment would ensure that the impact dimension becomes as rigorous and comparable as the policy or portal dimensions.
5. Operational detail of the preferred option
This chapter presents the operational blueprint for the revised ODM assessment. Building on the strategic mandate for an ‘enhanced option A’, it details the specific mechanisms that could be deployed from the 2026 cycle onwards. The revised framework rests on three operational pillars: a consolidated self-assessment questionnaire aligned with international standards, a professionalised independent peer review process to ensure the integrity of the instrument itself, and a TQI that functions as an automated backend validation layer. Together, these components address the twin challenges of administrative burden and future analytical credibility.
5.1. The streamlined questionnaire
The self-assessment questionnaire constitutes the backbone of the ODM assessment, ensuring the continuity of the longitudinal dataset that Member States value. However, to resolve the tension between detailed monitoring and administrative fatigue, the instrument requires redesign. Pillar 1 is a streamlining strategy, targeting a reduction in the total question count by up to 40 % while simultaneously increasing the analytical value of the responses. This is achieved through three operational mechanisms: structural consolidation, international harmonisation and AI-assisted workflow.
The current questionnaire suffers from fragmentation, often asking multiple binary yes/no questions to ascertain a single dimension of maturity. This can encourage box-ticking behaviour where respondents focus on compliance rather than quality. The revised questionnaire replaces clusters of related binary questions with single questions evaluated on graduated maturity scales.
For example, rather than asking three separate questions regarding the existence of a portal feedback mechanism, the frequency of its review and the publication of results, the new instrument will pose a single indicator: ‘maturity of user feedback loop’. Respondents will select their status from a defined scale ranging from level 1 (ad hoc mechanisms exist) to level 4 (systematic, automated integration of feedback into the portal roadmap). This shift captures the degree of implementation (a key demand from the stakeholder consultation) allowing the ODM assessment to differentiate between countries that have a policy on paper and those that have operationalised it, without requiring extensive narrative text.
To address the perceived ‘double reporting’ burden, the revised questionnaire is designed with a modular architecture that maps to the OECD OURdata Index where possible. The research team has identified the specific indicators where the two frameworks overlap, which is primarily in the domains of data availability and portal usability. The indicators specific to the European acquis (such as compliance with the HVD Implementing Regulation, the DGA’s national single information points and the Data Act’s emergency business-to-government mechanisms) should clearly be ring-fenced. The modular approach would clarify the unique value added of the ODM assessment while minimising the cognitive load on national coordinators, who will no longer need to translate their data between two divergent methodological languages.
The Impact section of the questionnaire should operationalise the findings of the 2026 study measuring the impact of open data. Open-ended narrative questions regarding economic benefits would be replaced by structured reporting fields for the thematic impact indicators defined in that framework.
Suggested changes to the questionnaire
The revision process followed a systematic approach. Each question from the original questionnaire was reviewed to assess (a) continued relevance to the measurement objectives, (b) potential overlap or duplication with other questions, (c) clarity of wording and definitional precision and (d) the feasibility of scoring and cross-country comparability. On this basis, the questions were mapped to a set of change types. Changes were then applied iteratively, incorporating stakeholder comments across and verifying that the revised instrument preserved the analytical intent of the original questionnaire while improving efficiency and interpretability.
The changes introduced fall into several categories that vary in complexity. The categories below are presented from the most straightforward adjustments to the most substantive redesigns.
The first category comprises renumbering and editorial corrections. These changes include minor corrections to wording, grammar and terminology that do not alter the intent of the question but improve readability and reduce ambiguity. Where relevant, small terminology updates were also made to align with commonly used formulations in the survey context and to avoid inconsistent interpretation by respondents.
The second category is refinement for clarification. These changes preserve the underlying information request but adjust the phrasing to make the intended interpretation explicit. Typical refinements include clarifying what constitutes ‘regular’ exchange by asking for frequency and formats, replacing broad or potentially ambiguous terms with more concrete language, and adding prompts that guide respondents towards providing verifiable and comparable information. In several cases, refinement also involved updating definitions or adding short explanatory text to clarify the scope of the question and prevent overlap with nearby items.
The third category is quantification. In the original questionnaire, several items relied on binary yes/no responses combined with open-text explanations. In the revised version, quantification prompts were added where a numeric estimate strengthens analytical usefulness and comparability. Examples include asking for the percentage of public bodies with publication plans, the estimated percentage of HVDs published or the share of datasets updated in real time. These changes aim to capture coverage and maturity more effectively than a binary response alone, while still allowing respondents to provide contextual explanation where needed.
The fourth category is introduction of structured sub-questions or internal scoring elements. This category is used when a single question covers multiple components that are analytically meaningful on their own. Rather than relying on open text that is difficult to compare across respondents, the revised questionnaire introduces structured elements that can be ticked, rated or otherwise consistently interpreted.
The fifth category is merging and consolidation. Several clusters of original questions addressed closely related aspects of a single concept and could be answered more efficiently when grouped. Consolidation was applied where questions were adjacent in the logic of the questionnaire, where their explanatory requirements were repetitive, or where respondents would naturally answer them as a combined narrative.
The sixth category is relocation. Some questions were retained but moved to a different dimension or section to improve conceptual alignment and to avoid duplication. Relocation was applied when a question’s content better matched another dimension of assessment. Relocation also supports a more coherent questionnaire flow by grouping related concepts together and reducing the need for respondents to switch context across sections.
The seventh category is deletion. A limited number of questions were removed where (a) relevance was assessed as lower in the context of the overall questionnaire, (b) the information could be obtained reliably from other sources, (c) the question risked incentivising the implementation of arbitrary features purely for scoring purposes, or (d) the question was not sufficiently defined to support consistent interpretation and scoring across countries. Deletions were made conservatively and were generally accompanied by adjustments elsewhere to ensure that essential information was not lost.
An excel workbook with suggested questionnaire changes is attached to the study.
Introduction of AI workflow
Finally, to reduce the time cost of the assessment, the ODM assessment could introduce an AI-first workflow. Leveraging the source code and documentation publicly available on national portals, the central research team could use (secure) LLMs to pre-fill the questionnaire before it is sent to participating countries. National coordinators would receive a questionnaire that is already 70–80 % verified based on the previous year’s data and automated web scanning. Their role would shift from data entry more towards validation. They would be asked to review the pre-filled answers, confirm their accuracy or update them where significant changes have occurred.
The AI tool could also scan for broken URLs and outdated policy documents, flagging these for the coordinator’s attention. This would proactively improve the quality of the evidence base and ensure that the technical quality index (detailed in section 5.2) starts from a baseline of verified data.
5.2. Revised validation architecture
A revised validation architecture would address the subjective variability inherent in any expert assessment. This architecture operates on two levels: an ex ante review of the instrument and an ex post validation of the results.
To eliminate ambiguity (a primary driver of inconsistent reporting), the ODM assessment would introduce an annual independent peer review of the questionnaire itself. This process would take place before the assessment cycle begins.
The review panel: a panel of three to five external experts could be identified, comprising academic researchers, senior data journalists/reusers and technical architects. Their selection would need to be based on prior knowledge of the process and independence from national administrations. Selected members from the panel would audit the revised questionnaire, specifically stress-testing new indicators (e.g. those related to the Data Act) and the graduated maturity scales. Their mandate is primarily to identify inappropriate question types, vague definitions, overlapping concepts or questions that could be interpreted differently by different cultures.
The review panel should be appointed against a small set of transparent criteria to ensure both relevance and independence. Experts should demonstrate recognised expertise in at least one domain directly relevant to the ODM assessment (e.g. open data policy and governance, technical standards and portal architecture such as DCAT-AP, impact measurement, or user-centric service design), and have proven ability to review assessment instruments (questionnaire design, indicator clarity and scoring logic) and provide structured, evidence-based feedback. Selection should include conflict-of-interest safeguards, notably that panel members are not currently responsible for completing a national ODM questionnaire and do not hold a formal role in a national coordination team for the cycle under review. The panel should also be balanced across profiles (academic, practitioner, technical and reuser / data journalism perspectives) to avoid over-representation of any single community, and members should be able to commit to the agreed review window. In terms of frequency, the panel should conduct an ex ante review once per year, prior to launching the next assessment cycle. In most cases (after the initial/first review) the review would be low effort since it would only focus on changes made in that year.
The reviewer(s) would produce a simple calibration note, which provides recommendations for refining the question text and the scoring guide. This would ensure that when participating countries receive the questionnaire, they are responding to a scientifically robust instrument that has already been debugged for interpretative bias.
Introduction of a reuser feedback loop
To strengthen the practical usefulness of the ODM assessment for stakeholders, a structured input channel from the data reuser community could be established as a complementary source of insight. Rather than functioning as a scoring mechanism, this engagement would help identify common user-facing friction points and generate actionable guidance on how participating countries can improve services and increase the realised value of open data. In place of a broad public survey, the central research team could convene targeted sessions (e.g. focus groups or structured interviews) with relevant reuser segments in a sample of participating countries each year, such as govtech firms using HVDs and civil society organisations working with geospatial data. The output would be a concise set of recurring issues and practical improvement opportunities (for example, where data is technically available but not sufficiently interoperable or reliable for advanced reuse), which can be reflected in guidance materials and country feedback as part of a continuous improvement cycle, without affecting country scores.
Implementing a continuous improvement cycle
The proposed validation architecture creates a closed loop of continuous improvement. The insights from the peer review and the reuser feedback do not just validate the current year’s scores; they also feed directly into the design of the next year’s questionnaire. This ensures that the ODM assessment evolves in lockstep with the rising expectations of the expert community and the practical needs of data reusers (at a time of changing legislation).
5.3. Development of a technical quality index
While the streamlined questionnaire maintains the narrative context of the assessment, the credibility of the ODM assessment relies on verifiable evidence. Pillar 2 introduces the TQI, a composite metric derived exclusively from automated, objective data sources. Under the ‘enhanced option A’ model, the TQI does not replace the national score; instead, it functions as a backend validation layer (a shadow rating designed to detect discrepancies between reported policy ambition and operational technical reality).
The TQI would be assembled through a repeatable, predominantly automated data pipeline drawing on (i) EU-level harvesting and dashboards (notably the revised metadata quality assessment) and (ii) standardised technical tests and analytics extracts from national portals. Metadata health would be sourced from the revised European Data Portal metadata quality dashboard, using the published composite score and its underlying sub-dimensions (e.g. findability and interoperability), captured as a fixed snapshot for the reference period. Technical accessibility and reusability would be derived from harvested metadata signals on machine-readable format availability and API availability, expressed as percentages. Infrastructure performance (e.g. uptime, response times, basic accessibility conformance) would be collected via centrally run scripts executed at defined intervals, producing objective, reproducible measures. HVD-related data provisioning would be verified through automated endpoint probes and/or structured registry signals aligned with the HVD Implementing Regulation, using periodic collection (e.g. annual/biennial depending on reporting cycles).
For operational simplicity and interpretability, the TQI should use a 0–100 scale. Each component metric is first expressed as a percentage (where naturally available), or transformed into a percentage through a defined rubric. For count-based signals (where used), results should be normalised (e.g. per capita or per dataset) to allow meaningful comparison across participating countries. Where feasible, the TQI should prefer ‘rate’ metrics (percentages) over absolute counts to reduce sensitivity to catalogue size and publication granularity.
To maintain transparency while allowing pragmatic refinement, the methodology can define an initial weighting that mirrors the three technical streams already described (metadata health, infrastructure performance, data provisioning), with calibration during a shadow run. One simple starting point (for refinement with stakeholders) is:
- metadata health (MQA-derived) – 40 %;
- infrastructure performance (automated portal tests) – 30 %;
- data provisioning / HVD technical availability (API probes and related signals) – 30 %.
Formally:
TQI (0–100) = 0.40 × MetadataHealth + 0.30 × InfrastructurePerformance + 0.30 × DataProvisioning
Each component is itself a composite of two to four sub-metrics (each normalised to 0–100) with clearly stated sub-weights. This makes the index auditable and reduces ‘black box’ perceptions, while keeping room to adjust weights once a more refined evidence base is available.
Given differences in data refresh rates, the TQI should be computed as an annual index, but built from underlying measures collected at appropriate frequencies (e.g. continuous/ongoing harvesting for metadata; quarterly portal analytics where used; scheduled technical tests). In operational terms, the Commission would produce a preliminary TQI extract for participating country as part of the validation workflow, enabling early identification of harvesting artefacts and supporting constructive technical dialogue.
To make the implementation concrete, the methodology should include (as an annex or workbook) a line-by-line mapping showing which questionnaire items are: (a) replaced by automated measurement, (b) validated by TQI signals, or (c) out of scope because they capture governance/process information not comparable to technical outputs. This mapping is essential because the TQI is intentionally built from foundational output indicators (e.g. ecosystem health and technical performance) rather than thematic impact indicators (e.g. employment, GVA). In practice, the mapping will primarily cover a defined subset of questions on the portal and quality dimensions that make claims about observable technical reality – such as machine-readable licensing and link validity (validated via metadata quality signals), API availability and reliability (validated via endpoint probes and uptime tests) and declared technical accessibility/reusability (validated via format/API rates). Questions that are policy- or process-oriented (e.g. internal guidelines, governance arrangements) would remain self-assessed and validated through evidence checks, but would not be directly compared to the TQI.
Establishing a dialogue on technical performance
The operational value of the TQI lies in its interaction with the self-assessment questionnaire. The scoring model employs a delta analysis to identify score inflation. During the validation phase, the system compares the self-assessed maturity score against the TQI score. TQI comparisons should be limited to questions that assert an objectively testable technical reality on the portal or in harvested metadata (i.e. ‘what is published and how it behaves’), not to questions about policies, guidelines or internal processes (‘what is intended or prescribed’).
Below are the questionnaire items from 2026 that make technical claims which can reasonably be compared to TQI signals (MQA/harvesting outputs, automated link checks, API endpoint probes, DCAT-AP conformance checks).
Directly comparable (highest comparability). These questions correspond closely to what automated measures can verify:
Portal (technical endpoints / machine access)
PT3 – programmatic query of metadata via API (DCAT‑AP endpoint / REST / SPARQL): comparable to automated endpoint availability checks.
PT18 – machine‑readable metadata based on recognised standards (e.g. DCAT‑AP): comparable to harvested metadata validity / conformity signals.
PT23 – share of datasets that are real‑time or dynamically updated: partially comparable where TQI includes technical verification of ‘live endpoints’ (e.g. API availability / responsiveness for dynamic feeds).
PT31 (pilot) – availability of real‑time / frequently updated datasets for AI/data‑driven use cases: comparable only where the TQI includes a defined, testable proxy (e.g. presence of frequently refreshed API endpoints or declared update frequency in metadata).
Quality (metadata fields, links, DCAT‑AP properties)
Q10 – % of datasets accompanied by licensing information: directly comparable to harvested metadata checks for licence presence / machine-readable licence fields.
Q12–Q14 – % DCAT‑AP compliance (mandatory/recommended/optional classes): comparable to DCAT-AP structural validation metrics derived from harvested metadata.
Q15 – % datasets with download URL: directly comparable to automated presence + link resolvability checks (broken link rates).
Q16 – % datasets with access URL: directly comparable to automated presence + link resolvability checks.
Q4a – implementation of DCAT‑AP HVD tag: comparable to automated detection of the HVD tag in harvested metadata.
Q4b – % of HVDs correctly tagged: comparable (in principle) to automated conformance checks for correct tagging patterns, subject to known limitations in tagging practices and harvesting pipelines.
This comparison could generate a traffic light signal for the central research team.
- Green (alignment). The self-assessed score and TQI are within a consistent range. The self-assessment is accepted as valid.
- Amber (divergence). A noticeable gap exists (e.g. a country claims maximum points for ‘portal sustainability’ but records frequent downtime). This triggers a request for clarification, asking the participating country to explain the anomaly.
- Red (contradiction). A significant contradiction is detected (e.g. a country claims 100 % API provision for HVDs, but the automated probes return 404 errors). This triggers a moderation review. The participating country must provide concrete evidence to refute the automated finding. If the evidence is insufficient or the contradiction persists, the specific indicator score is adjusted downwards to align with the TQI baseline.
The feasibility study identified that automated metrics can sometimes be misleading due to technical failures in the harvesting pipeline between national portals and the European Data Portal, rather than failures of the national portal itself. Before the moderation protocol is applied, participating countries should be provided with their preliminary TQI report. If a low score is caused by a harvesting error on the European side, national coordinators can submit a further information (logs or evidence from their local system). If verified, the TQI score could be manually overridden and the data collection process revised for the future. This safeguard would ensure the automation serves as a tool for rigour, not a source of unfair penalisation, directly addressing the concerns raised regarding the black box nature of purely automated indices.
6. Suggested implementation roadmap
The transition to the ‘enhanced option A’ model represents a natural evolution of the ODM assessment. It builds upon a decade of successful benchmarking, ensuring that the ODM assessment continues to serve as a trusted and effective steering tool for Member States in an increasingly complex data landscape. To manage this evolution smoothly and allow national administrations time to adapt to new legislative requirements, the revised methodology will be introduced through a phased implementation roadmap spanning three assessment cycles.
This chapter outlines the strategic sequencing of the rollout. It defines the specific technical and procedural milestones in phases, distinguishing between the immediate ‘no-regrets’ actions that will launch in the upcoming cycle and the more advanced automated features that will be progressively integrated as the underlying infrastructure matures.
6.1. Phase 1: streamlining and stabilisation
Given the ongoing assessment cycle, the priority for phase 1 is to deliver immediate relief on administrative burden while establishing the structural foundations for the new methodology. This phase focuses on the ‘no regrets’ moves that require minimal technical integration but yield high value for national administrations.
Launch of the streamlined questionnaire
The primary public-facing milestone is the deployment of the consolidated self-assessment instrument. This redesigned questionnaire will be the first tangible evidence of the ‘enhanced option A’ strategy.
- The research team will roll out the consolidated question set detailed in chapter 5 and mapped in the attached excel workbook.
- This delivers on the primary stakeholder demand of burden reduction. By significantly reducing the number of input fields and simplifying the structure, it aims to reverse the trend of survey fatigue and secure continued high engagement rates.
Opening the dialogue on Organisation for Economic Co-operation and Development alignment
Recognising the strong demand from Member States to reduce duplication with the OECD OURdata Index, phase 1 will mark the formal start of a strategic alignment process.
- The Commission will initiate a dialogue with the OECD working group. The objective is to conduct a detailed comparative mapping of the two frameworks to identify specific areas of overlap (e.g. in data availability definitions) and potential synergy.
- While no immediate changes will be made to existing definitions, this preparatory work signals to Member States that the Commission is actively working towards less perceived overlap, building trust and buy-in for the longer-term roadmap.
Internal calibration of the technical quality index
While the TQI will not affect national scores in this phase, the central research team should calibrate and quality-assure the underlying automated measures. Metadata quality signals (via the revised MQA) and centrally run technical tests (e.g. link checks and portal / API performance probes) should be executed in shadow mode alongside the standard assessment and validation workflow. The outputs should not be used for moderation or published as part of the current results; instead, they should be used to establish a baseline, identify tool and harvesting artefacts, and refine the operational parameters for subsequent assessments (including thresholds, dispute-handling steps and documentation of the measurement approach). Where helpful, preliminary technical extracts may be shared with participating countries for verification and issue resolution, recognising that objective metrics can be affected by interoperability and harvesting constraints. In parallel, a clear mapping (building on what is provided in this report above) will be prepared and validated to specify which questionnaire items are eligible for technical comparison with the TQI (i.e. those making testable claims on observable portal/metadata outputs).
6.2. Phase 2: automation and operationalising verification
Building on the stabilised baseline, this phase will focus on deploying the technological and procedural capabilities necessary to validate national performance. The objective of phase 2 is to activate the necessary back-end machinery of the assessment.
Launch of the independent peer review
To improve the assessment design, this phase would include the inaugural cycle of the independent peer review process.
- Before the questionnaire is finalised, the Commission will agree the first external review panel, comprising academic experts, data journalists or reusers and technical architects. Selected members of the panel will audit the revised questions and scoring logic to identify any ambiguity or bias.
- This ensures that the instrument is scientifically robust before it reaches participating countries. It proactively addresses the critique of inconsistent interpretation by ensuring that questions are stress-tested by neutral experts, thereby reducing the scope for subjective error in self-reporting.
Activation of technical quality index moderation
With the TQI metrics calibrated during the previous phase, the focus would shift to the formal integration of automated data into the validation process.
- The TQI will move from shadow mode to active deployment. The central research team will use the automated scores for metadata quality, portal performance and API availability to screen incoming self-assessments. The traffic light moderation protocol defined in chapter 5 will be enforced: significant divergences between a country’s reported maturity and its TQI score will trigger a request for evidence/dialogue.
- This introduces a systemic quality control layer that does not rely on human intuition. It ensures that the high scores awarded in the ranking are backed by verifiable technical proof, directly addressing any potential credibility concerns and the ceiling effect.
Introduction of AI-assisted pre-filling
To further reduce administrative burden over the medium term, phase 2 would explore a first iteration of AI-assisted pre-filling as a controlled pilot, rather than as a fully operationalised feature.
Using only publicly available sources (e.g. published policy documents, portal documentation pages and stable URLs) and the previous year’s validated responses, the research team would test whether secure LLMs can reliably propose draft entries for a limited subset of questionnaire fields (initially focused on descriptive items such as policy references and selected portal feature descriptions).
The pilot would be designed to operate within Commission constraints on data access, security, and traceability, with clear rules on what sources may be used, how outputs are logged and how errors are handled. AI-generated content would be treated as a suggestion layer, not as an authoritative response.
Participating countries would continue to provide the official answers. Where piloted, national coordinators would receive a pre-populated draft for review, with the explicit expectation that they validate, correct and complete it, thereby shifting effort from data entry towards verification and quality assurance, while maintaining full national ownership of submitted content.
The pilot would be evaluated against practical criteria (accuracy, time saved, reproducibility and ability to provide verifiable citations/URLs). Only if these criteria are met would a broader rollout be considered in subsequent cycles.
Standardising impact measurement (aligned with the study on measuring the impact of open data)
Phase 2 would progressively operationalise quantitative impact measurement by drawing on the companion study on measuring the impact of open data and its Member State toolkit, which provide a common set of indicators and practical calculation protocols intended to improve comparability while keeping administrative effort proportionate.
Rather than asking Member States to commission ad hoc economic studies, the guidelines would provide standard definitions, calculation steps and model-based estimation approaches (including the use of agreed coefficients where applicable) so that reporting can be carried out consistently using available national baseline inputs.
Effective rollout depends on: (i) the availability and quality of national baseline data required by the selected indicators (and the ability to document gaps transparently); (ii) clear communication of the assumptions, limitations, and confidence boundaries underlying any coefficients or formulas; and (iii) sufficient national capacity to apply the methods consistently (including coordination between policy teams, portal teams and, where relevant, statistical authorities). These prerequisites will determine which indicators can be introduced as ‘core’ in phase 2 and which should remain optional or phased.
This approach enables the impact dimension to rely less on purely narrative evidence and more on structured, comparable estimates and supporting documentation, while retaining space for short contextual explanations where national interpretation is needed.
6.3. Phase 3: consolidation and strategic alignment
By the start of phase 3, the ‘enhanced option A’ model will have completed its first full operational run. The focus of Phase 3 is therefore the consolidation of the new processes introduced in phase 2. This phase aims to refine the validation mechanisms based on real-world evidence and to ensure the assessment remains synchronised with the consolidating EU legislative framework.
Evaluation and refinement of the technical quality index
With one full year of data regarding the shadow ratings and moderation triggers, phase 3 serves as a checkpoint to evaluate the effectiveness of the TQI.
- The Commission will conduct a statistical review of the previous results to assess whether the TQI thresholds for moderation were set correctly. Did the automated checks flag too many false positives? Did the dialogue with participating countries function smoothly? Based on this review, the weighting of specific automated metrics (e.g. API latency versus metadata completeness) will be fine-tuned to ensure they accurately reflect national maturity without creating unnecessary friction.
- This iterative refinement prevents the assessment from becoming rigid. It ensures that the automated validation layer remains fair and technically relevant as national portal architectures evolve.
Alignment with the new Data Act landscape
As the Digital Omnibus Regulation progresses through the legislative procedure, phase 3 will likely require a thematic adjustment of the questionnaire to reflect the repealing of the Open Data Directive and DGA as standalone instruments.
- The content of the assessment will be reviewed to ensure it captures the consolidated obligations under the unified Data Act. This may involve merging separate sections on open data and data altruism into a coherent data economy chapter, mirroring the structure of the new legislation.
- This ensures the ODM assessment remains the primary monitoring vehicle for the EU data strategy, evolving from a specific open data benchmark into a broader monitor of the consolidated EU data acquis.
Formalising the reuser feedback loop
Having piloted targeted ad hoc focus groups in phase 2, phase 3 aims to structure this engagement into a repeatable process.
The study recommends considering a standing pan-European reuser panel, comprising representatives from the data journalism, govtech and research communities identified during the previous phases. While their input may not yet directly determine the score, their structured feedback will be formally integrated into the qualitative country reports, providing a ‘user voice’ alongside the administrative self-assessment. This institutionalises the demand-side perspective, ensuring that the assessment captures the usability of data, not just its availability, without imposing the complexity of a full public survey or other heavy data collection mechanisms.
To make the reuser feedback loop repeatable and proportionate, the process could be formalised around three design choices: (i) a clear approach for identifying and recruiting reusers, (ii) a lightweight collection method that produces actionable insights without becoming a public survey, and (iii) a predictable annual cadence aligned with the ODM cycle.
Reuser participants should be selected through a transparent, balanced approach combining: (a) an open call for expressions of interest published via European Data Portal channels and relevant networks; (b) targeted outreach to known high-value reuser communities (e.g. data journalism organisations, govtech/start-up ecosystems, academics and research users); and (c) nominations from national coordinators to ensure relevant national communities are visible. Selection should apply simple criteria to ensure the panel is credible and practically useful: demonstrated hands-on reuse of public sector open data (preferably including HVD categories), ability to provide concrete evidence of friction points and improvement opportunities, and independence from national administrations responsible for completing the ODM questionnaire. To avoid over-representation, the panel should maintain a balanced mix across user types and domains and apply rotation (e.g. partial renewal each year) while retaining a small core for continuity.
Feedback could be gathered through a light-touch, mixed-method insight cycle rather than a large-scale survey. A practical model comprises:
- a short, structured online questionnaire (10–15 minutes) focused on usability and recurring friction points (e.g. findability, machine-readability, API reliability, licensing clarity), collected using standardised prompts to support comparability;
- one annual virtual or hybrid panel session (workshop) to validate patterns, prioritise issues and translate them into practical improvement recommendations; and
- optional follow-up interviews on specific themes (e.g. HVD technical access, interoperability, reuse barriers for SMEs) where deeper context is needed.
Outputs could be synthesised into a concise ‘reuser insights note’ highlighting recurring issues, good practices and actionable suggestions. These insights would be reflected in qualitative country narratives and horizontal guidance materials, without directly affecting country scores.
The reuser insight cycle could run once per year in alignment with the ODM assessment timetable: (i) collection in a defined window (e.g. 6–10 weeks prior to finalisation of country narratives), (ii) synthesis during the validation period to inform guidance and qualitative reporting, and (iii) publication of aggregated, non-attributable findings as part of the annual reporting package. Where feasible, a small ‘pulse check’ (optional and short) could be run mid-year on one priority topic (e.g. API reliability), but the default should remain annual to minimise the burden.
7. Recommendations
The transition to the suggested model offers a practical path to modernise the ODM assessment. It moves the instrument towards greater technical rigour while respecting the need for continuity and operational realities of participating countries. To ensure this transition is successful and well-received, the study proposes the following supporting actions for the Commission.
7.1. Implementing the optimised questionnaire
The implementation strategy should prioritise the adoption of the specific streamlining proposals detailed in this study, also in part to create the necessary capacity for new strategic topics. The study has provided a detailed line-by-line review of the current questionnaire (see attached workbook), identifying opportunities to merge overlapping questions, remove outdated compliance checks and convert binary questions into graduated scales. The Commission should now decide which of these specific suggestions to adopt. The objective should be to maintain the established four-dimensional structure (policy, portal, quality, impact) while significantly reducing the number of individual data points required from participating countries. This ensures longitudinal continuity while addressing the immediate feedback regarding administrative burden.
The reduction of burden achieved through streamlining should create the ‘budget’ to introduce high-priority new concepts without increasing the overall workload. The Commission should use the space created by removing and consolidating legacy questions to introduce targeted indicators on AI readiness (e.g. availability of training data) and real-time data capabilities. This would represent a demonstration that the Commission is modernising the assessment to remain forward-looking and relevant while respecting national resource constraints.
7.2. Supporting infrastructure
The shift towards automation and AI-assisted reporting relies on quality back-end systems.
To deliver the promised burden reduction, the central team will need to operationalise the AI-assisted pre-filling. It is recommended to run a pilot of this process on a small sample of questionnaires before full roll-out, ensuring the AI-generated suggestions are accurate enough to be helpful to national coordinators.
Since metadata quality scores depend on successful harvesting by European Data Portal, ensuring the stability and frequency of this harvesting is critical. Continued investment in the reliability of this infrastructure is essential to ensure that automated scores are fair and accurate.
7.3. Facilitating the validation process
The introduction of the TQI as a validation tool will inevitably surface discrepancies between self-reported maturity and automated findings. Managing this requires a collaborative approach. Instead of a rigid dispute procedure, the validation phase should be framed as a dialogue. The Commission should ensure there is a clear window during the assessment process where participating countries can review their TQI scores and provide context if technical issues (like temporary harvesting failures) have skewed the data. This builds trust in the automation.
For the peer review of the questionnaire, the Commission should ensure the selection process for experts is transparent and rotational. Inviting a mix of academic, technical and civil society voices will ensure the methodology remains fresh and balanced over time.
7.4. Integrating the upcoming impact measurement framework
To resolve the long-standing challenge of measuring impact without burdening national administrations, the Commission should fully integrate the findings of the parallel study on measuring the impact of open data.
Rather than asking each participating country to conduct complex economic modelling, it is recommended that the Commission manages the calculation of the ‘open data employment’ and ‘GVA’ coefficients centrally. By providing these standard coefficients as part of the assessment guidelines, the Commission ensures comparability across the EU and significantly reduces the workload for national teams.
To keep these coefficients relevant, the Commission should consider periodic updates of the underlying economic data aligned with the European data market study. This would ensure that the ODM assessment’s impact estimates reflect the evolving reality of the data economy.
7.5. Managing communication and the narrative
Methodological changes can lead to fluctuations in scores, which can be sensitive for national administrations who rely on the ODM assessment for internal benchmarking. For the first year of the revised questionnaire (2026), it is recommended to publish a ‘bridging note’ or a dedicated chapter in the final report. This should explain that any changes in ranking are due to the recalibration of the instrument (i.e., the ‘bar being raised’) rather than a decline in national performance. This supports national coordinators in explaining the results to their political hierarchy.
To prevent the TQI from feeling like a black box, the Commission should ensure that Member States have year-round (or at least regular) visibility of the metrics being tracked. Making the MQA and portal performance dashboards easily accessible allows countries to self-diagnose and improve their technical maturity proactively, not just during the assessment window.
Footnotes
- ^ ([1]) European Data Portal, 2024 Open Data Maturity Report, Publications Office of the European Union, Luxembourg, 10 March 2025, https://data.europa.eu/en/open-data-maturity/2024.
- ^ ([2]) European Commission, ‘European legislation on open data’, European Commission website, last updated 22 June 2026, accessed 27 October 2025, https://digital-strategy.ec.europa.eu/en/policies/legislation-open-data accessed.
- ^ ([3]) Directive (EU) 2019/1024 of the European Parliament and of the Council of 20 June 2019 on open data and the re-use of public sector information (recast) (OJ L 172, 26.6.2019, p 56, ELI: http://data.europa.eu/eli/dir/2019/1024/oj).
- ^ ([4]) European Commission, ‘European Data Governance Act’, European Commission website, last updated 22 June 2026, accessed 27 October 2025, https://digital-strategy.ec.europa.eu/en/policies/data-governance-act.
- ^ ([5]) European Data Portal, ‘Measuring Open Data Maturity’, 2023, https://data.europa.eu/sites/default/files/odm2023_method_paper.pdf.
- ^ ([6]) European Commission, ‘Data Act’, European Commission website, last updated 2 July 2026, accessed 27 October 2025, https://digital-strategy.ec.europa.eu/en/policies/data-act.
- ^ ([7]) See footnote 5.
- ^ ([8]) European Commission, ‘A Europe fit for the digital age’, European Commission website, accessed 27 October 2025, https://commission.europa.eu/strategy-and-policy/priorities-2019-2024/europe-fit-digital-age_en.
- ^ ([9]) Communication from the Commission to the European Parliament, the Council, the European Economic and Social Committee and the Committee of the Regions –A Digital Single Market Strategy for Europe, COM(2015) 192 final of 6 May 2015, https://eur-lex.europa.eu/legal-content/EN/TXT/?uri=celex:52015DC0192.
- ^ ([10]) See footnote 5.
- ^ ([11]) Regulation (EU) 2016/679 of the European Parliament and of the Council of 27 April 2016 on the protection of natural persons with regard to the processing of personal data and on the free movement of such data and repealing Directive 95/46/EC (General Data Protection Regulation) (OJ L 119, 4.5.2016, p 1, ELI: http://data.europa.eu/eli/reg/2016/679/oj).
- ^ ([12]) European Data Portal, ‘Striking a balance: Open data and privacy in the digital era’, European Data Portal website, 10 April 2024, accessed 27 October 2025, https://data.europa.eu/en/news-events/news/striking-balance-open-data-and-privacy-digital-era.
- ^ ([13]) European Commission, European Data Union Strategy, European Commission website, last updated 18 May 2026, accessed 27 October 2025, https://digital-strategy.ec.europa.eu/en/policies/data-union.
- ^ ([14]) See footnote 5.
- ^ ([15]) See footnote 1.
- ^ ([16]) See footnote 1. European Commission: Directorate-General for Research and Innovation and Eechoud, M. v., Study on the Open Data Directive, Data Governance and Data Act and their possible impact on research, Publications Office of the European Union, Luxembourg, 2022, https://data.europa.eu/doi/10.2777/71619.
- ^ ([17]) See footnote 1.
- ^ ([18]) European Commission, ‘The Digital Europe Programme’, European Commission website, last updated 23 June 2026, https://digital-strategy.ec.europa.eu/en/activities/digital-programme.
- ^ ([19]) European Commission, ‘About the Connecting Europe Facility’, European Commission website, https://cinea.ec.europa.eu/programmes/connecting-europe-facility/about-connecting-europe-facility_en.
- ^ ([20]) European Data Portal, ‘Recommendations’, European Data Portal website, https://data.europa.eu/en/open-data-maturity/2024#recommendations.
- ^ ([21]) European Data Portal, ‘Open Data Maturity 2023 –Slovakia’, https://data.europa.eu/sites/default/files/country-factsheet_slovakia_2023.pdf.
- ^ ([22]) European Commission, ‘Open Data Maturity 2024 –Slovakia’,https://data.europa.eu/sites/default/files/country-factsheet_slovakia_2024.pdf.
- ^ ([23]) See footnote 1.
- ^ ([24]) See footnote 1.
- ^ ([25]) European Data Portal, ‘Open Data Maturity 2023 – France’, https://data.europa.eu/sites/default/files/country-factsheet_france_2023.pdf.
European Data Portal, ‘Open Data Maturity 2024 – France’, https://data.europa.eu/sites/default/files/country-factsheet_france_2024.pdf. - ^ ([26]) See footnote 25.
- ^ ([27]) European Data Portal, ‘Recommendations – Beginners’, European Data Portal website, https://data.europa.eu/en/open-data-maturity/2024#recommendations.
- ^ ([28]) European Data Portal, ‘Recommendations – Followers’, European Data Portal website, https://data.europa.eu/en/open-data-maturity/2024#recommendations.
- ^ ([29]) European Data Portal, ‘Recommendations – Fast-trackers’, European Data Portal website, https://data.europa.eu/en/open-data-maturity/2024#recommendations.
- ^ ([30]) European Commission, ‘Recommendations – Trendsetters’, European Data Portal website, https://data.europa.eu/en/open-data-maturity/2024#recommendations.
- ^ ([31]) Zuiderwijk, A., Pirannejad, A. and Susha, I., ‘Comparing Open Data Benchmarks: Which metrics and methodologies determine countries’ positions in the ranking lists?’, Telematics and Informatics, Vol. 62, 101634, September 2021, https://doi.org/10.1016/j.tele.2021.101634.
- ^ ([32]) Grabova, O., ‘The Open Data Maturity Ranking is shoddy – it badly needs to be re-thought’, CEPS website, 24 March 2024, accessed 23 October 2025, https://www.ceps.eu/the-open-data-maturity-ranking-is-shoddy-it-badly-needs-to-be-re-thought accessed.
- ^ ([33]) See footnote 31.
- ^ ([34]) Rajamäe-Soosaar, K. and Nikiforova, A., Exploring Estonia’s open government data development as a journey towards excellence: Unveiling the progress of local governments in open data provision, Association for Computing Machinery, New York, 11 June 2024, https://doi.org/10.1145/3657054.3657161.
- ^ ([35]) See footnote 32.
- ^ ([36]) See footnote 31.
- ^ ([37]) See footnote 34.
- ^ ([38]) See footnote 34.
^ ([39]) See here for an overview: https://digital-strategy.ec.europa.eu/en/library/study-published-supporting-evaluation-eu-data-rules.