It’s rare that data in its raw form can be used “as is” directly for visualisation: some kind of transformation needs to be performed on the data to make it usable.
The most obvious of these transformations is filtering out the relevant data points. Maybe you are only interested in a subset of the data, or maybe there are some outliers in the data that you don’t want to include in your analysis. But the line between filtering data and cherrypicking (selecting only the data to display that supports an opinion the author has) is a blurry one. So the reasons for including or excluding data should be public and transparent. An ethical question worth engaging is whether the main takeaway from a visual is significantly altered as a result of any filtering that has been applied to the data.
A visualisation based on absolute numbers can paint a very different picture than a visualisation based on relative values (percentages) or normalised values (per capita numbers, …). Normalisation serves the purpose of making values comparable, so they are the most appropriate values to use in visualisation. This is of special concern when making choropleth maps (see the normalising data page).
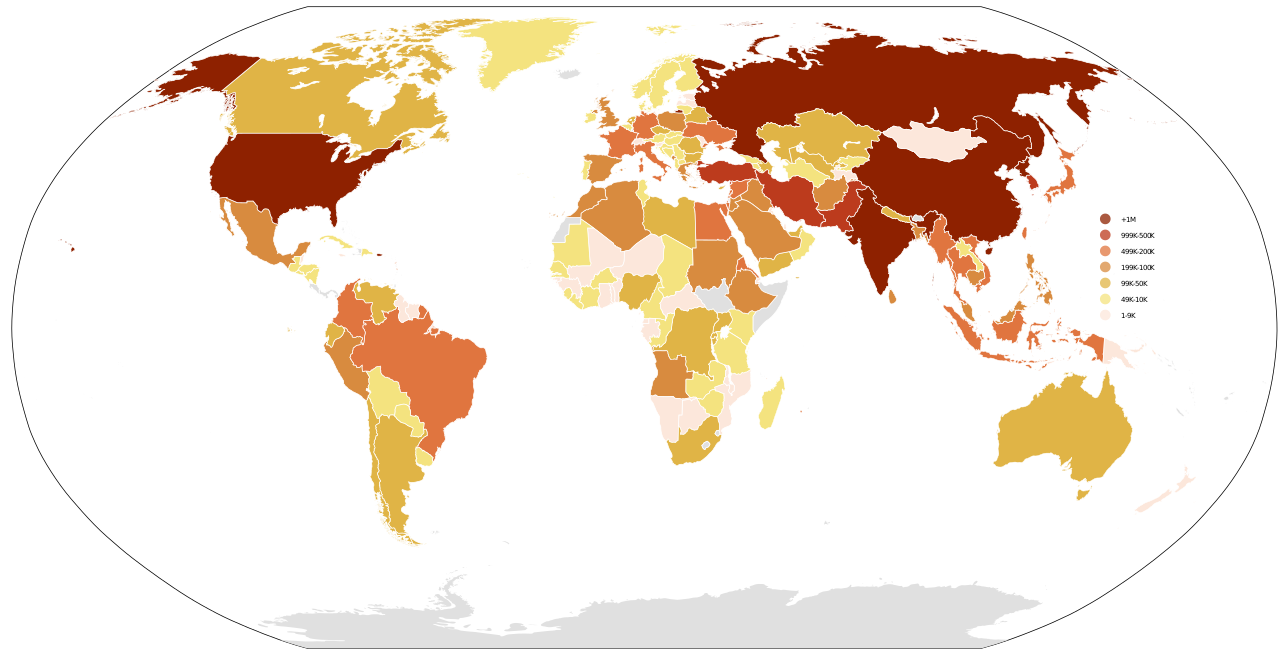
A choropleth map showing the number of troops in the military for each country. The map is very similar to a population map, because the numbers are not normalised: they should be expressed per capita. Source: Danalm000, CC-BY-SA 3.0
Of course normalisation should not be performed just for the sake of it. The ethical decision here concerns how choices in normalisation affect the insight or story that a reader will come away with, including the clarity with which they see that story. In charting variables relating to the economy over time it is often necessary to adjust and normalise for inflation so that the underlying signal is faithfully shown.
Interactive visualisations have the benefit of being able to show the same visualisation with different measures. In that way, the reader can choose what view on the data they want to see, and it is not up to the chart author to make the editorial choice of what is the best view on the data (to which readers might disagree and accuse the author of being “biased”). But still, the author of an interactive chart needs to make the decision of what the default view on the data is.
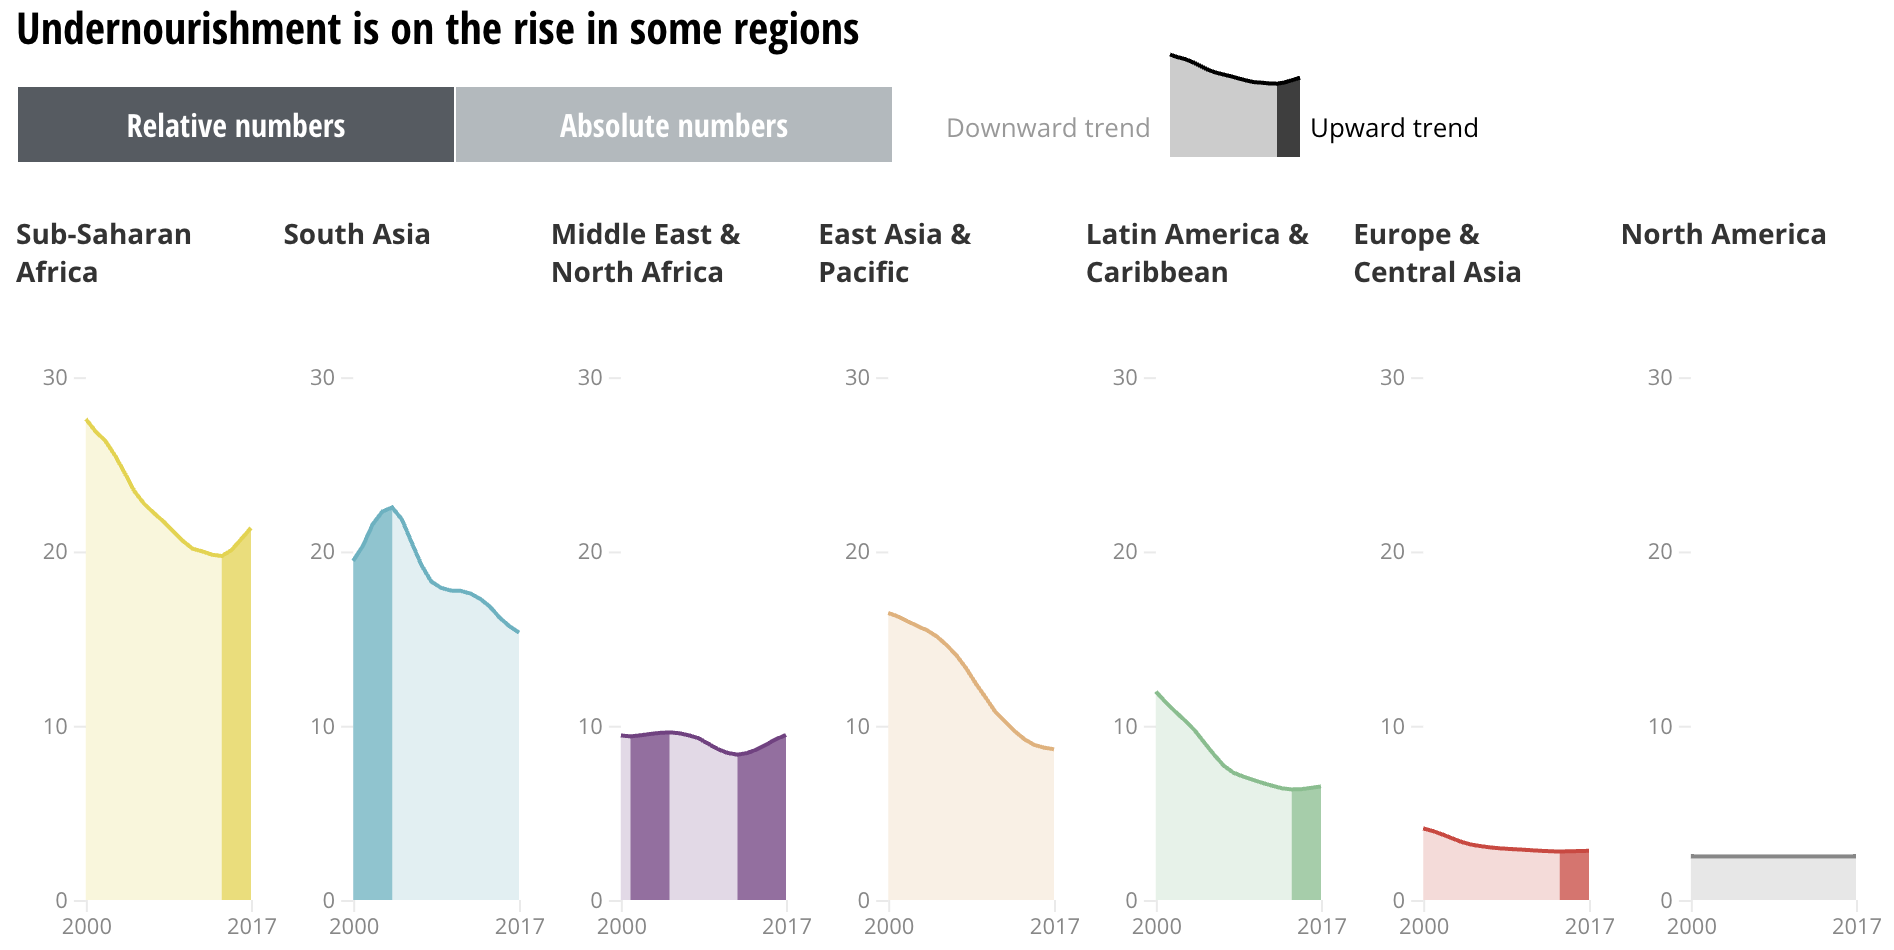
A chart showing the share of the population suffering from undernourishment in different regions. Source: Beyond hunger: ensuring food security for all, Sustainable Development Goals Atlas 2020, World Bank
Source: Beyond hunger: ensuring food security for all, Sustainable Development Goals Atlas 2020, World Bank
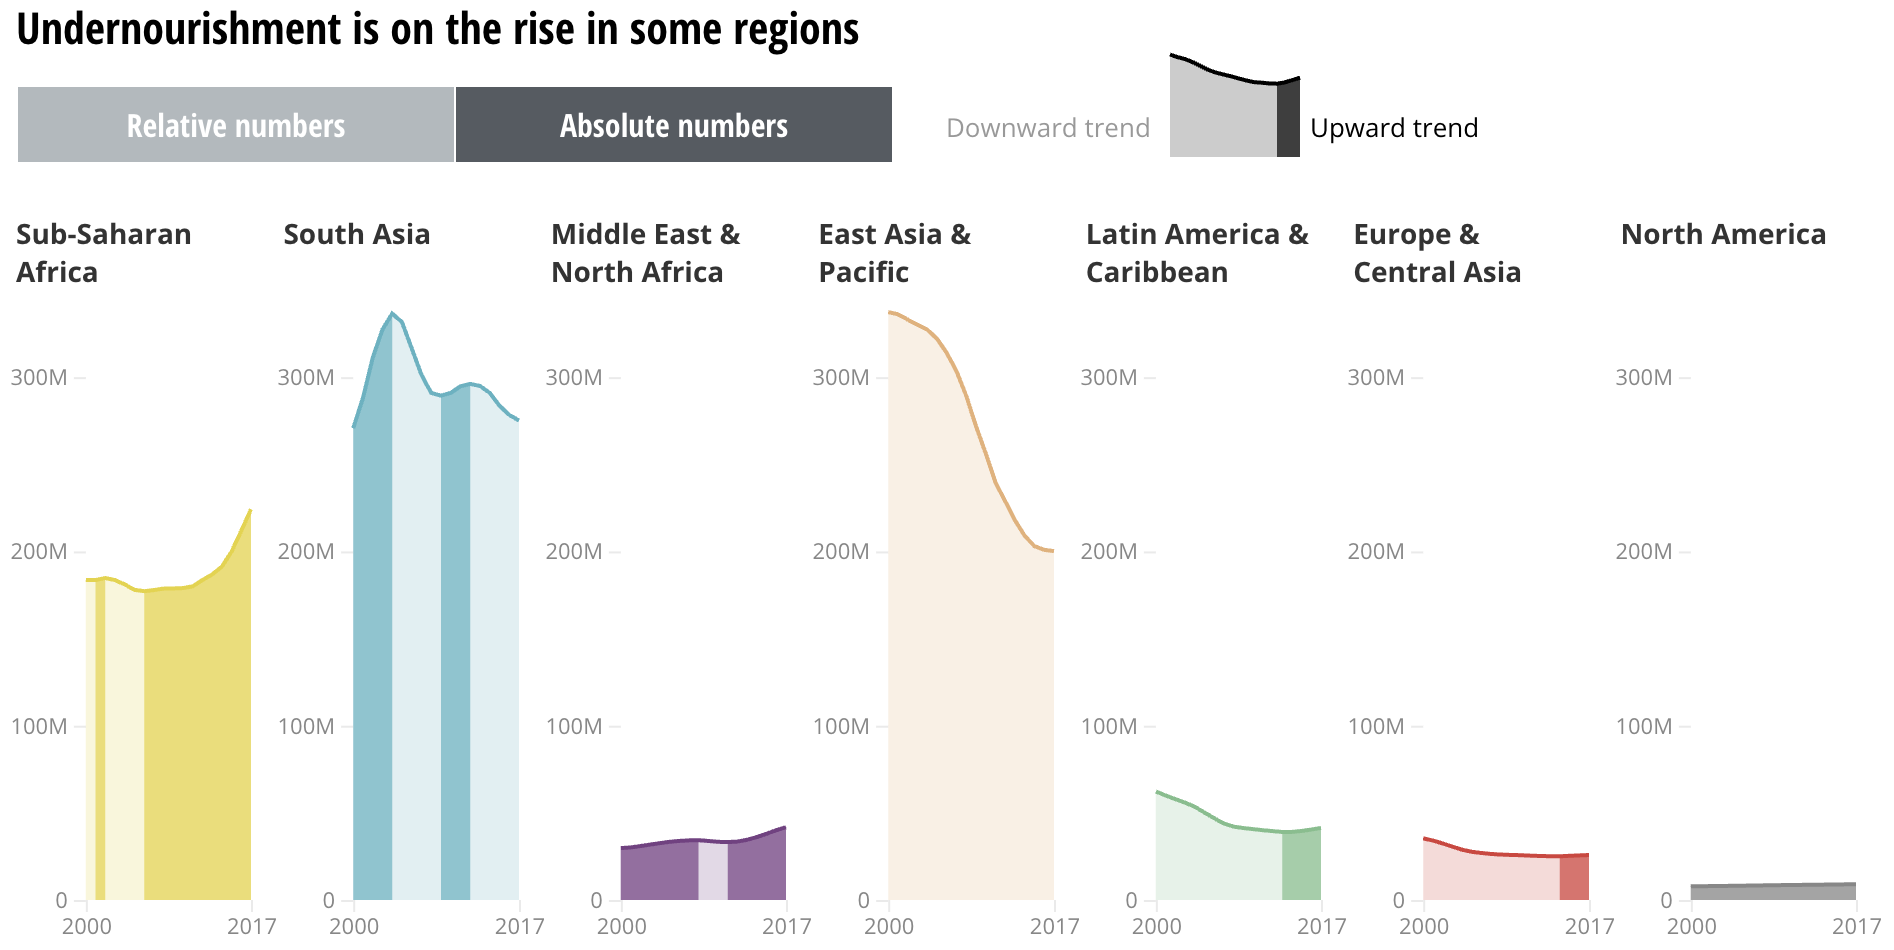
But absolute numbers matter too, so users can select this view by using the buttons on the top left of the chart to switch from relative numbers to absolute ones. Source: Beyond hunger: ensuring food security for all, Sustainable Development Goals Atlas 2020, World Bank