Connecting investment, land use and biodiversity: What open data tells us about nature in the EU
Open data allows us to trace the EU’s environmental efforts from funding and land use to the actual state of biodiversity on the ground
Biodiversity is under pressure across the globe, and Europe is no exception: more than 80 % of its natural habitats are currently in poor condition – a stark reminder of the need for urgent action. Healthy ecosystems are essential not only for nature itself, but also for food security, climate resilience and long-term societal well-being.
The EU has placed biodiversity at the heart of its environmental agenda, making it a key pillar of the European Green Deal. The EU Biodiversity Strategy for 2030 sets out to protect and restore nature, expand protected areas and embed biodiversity considerations across major EU policy areas – from agriculture to urban planning.
But how can we tell whether we’re making meaningful progress? Open EU data helps us begin to answer that question. It provides insights into how much we invest in nature, how land is used across the continent and how biodiversity is responding on the ground.
How much does the EU invest in protecting nature?
The EU and its Member States support environmental protection through targeted spending – a reflection of both their priorities and the value placed on nature and ecosystem services. But how much of this investment is directed specifically towards biodiversity?
Biodiversity is one part of a broader environmental agenda – one that includes managing air and water quality, treating waste and reducing industrial impacts. To understand biodiversity’s role within this framework, we can turn to open EU data on environmental protection expenditure.
Figure 1.1 shows how environmental protection spending across the EU has evolved over time. After peaking in 2015, it dropped by nearly 20 % in 2016 – possibly reflecting the completion of major infrastructure projects funded under the previous EU budget cycle – and gradually recovered in the following years. Spending specifically focused on biodiversity and landscape protection followed a similar post-2015 drop but had not yet returned to its earlier peak by 2022.
A closer look at national budgets in the same year (Figure 1.2) reveals significant variation among Member States. Denmark stands out, allocating over half of its environmental protection budget to biodiversity and landscape protection. In contrast, most other Member States, including large ones such as Germany, France and Poland, dedicate less than 10 % of their environmental budgets to this category. Several Member States report even smaller shares, reflecting each country’s unique environmental context – but the overall trend is telling: as of 2022, biodiversity investments had yet to return to the levels seen in 2015.
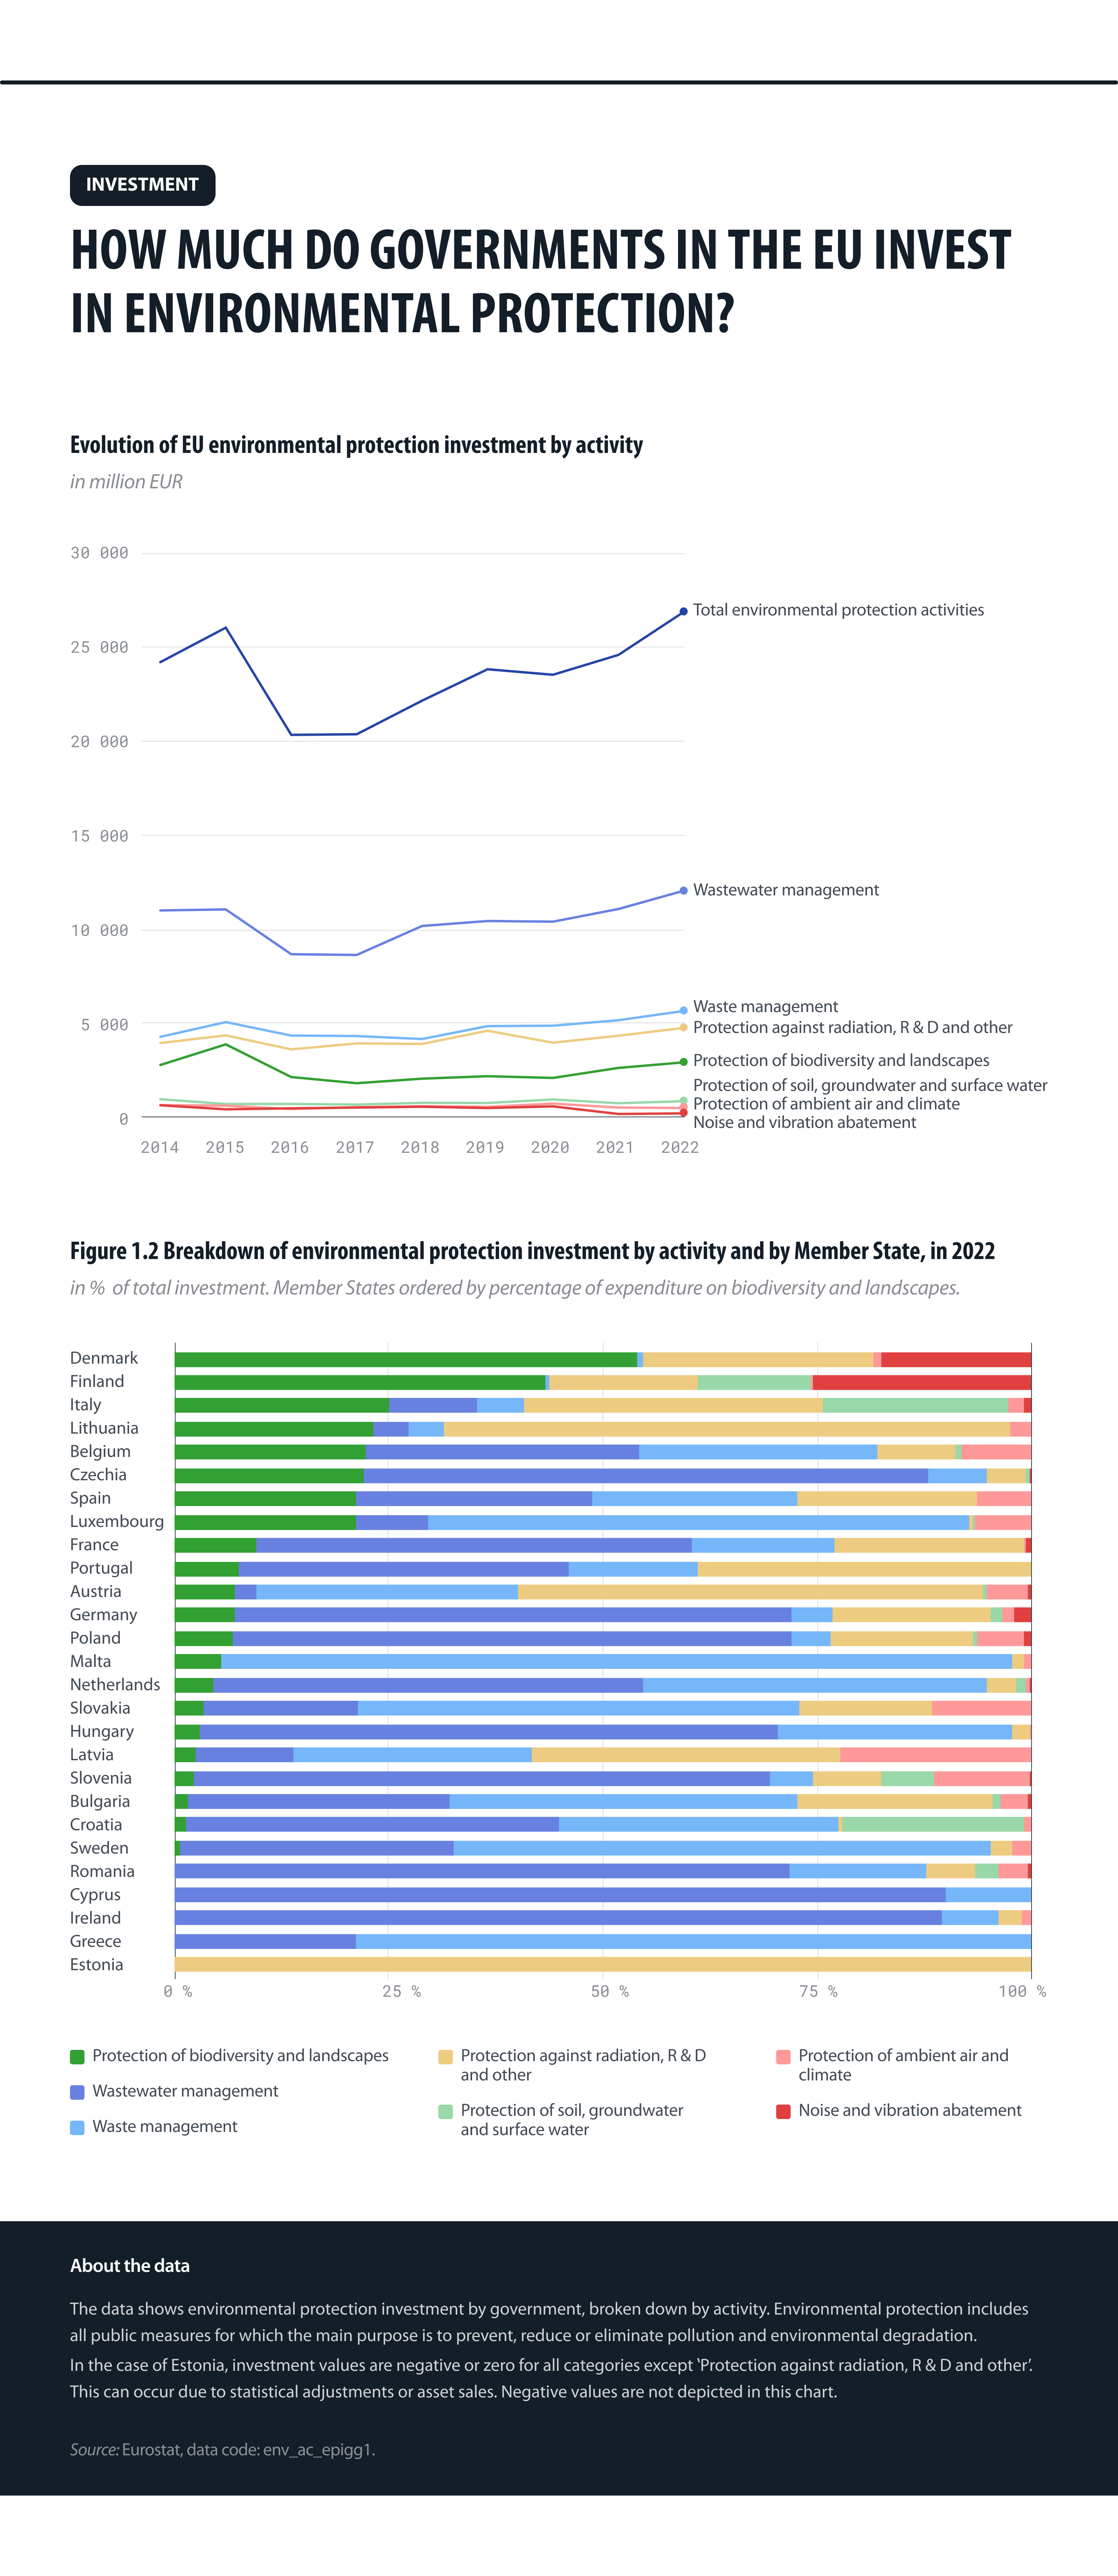
Figure 1: How much do governments in the EU invest in environmental protection?
Source: Eurostat, data.europa.eu.
How is the EU’s land being used and protected?
Land use is one of the most direct drivers of biodiversity change. The way we shape the landscape defines the space left for ecosystems to function. Urban sprawl, agricultural intensification and the steady loss of semi-natural habitats, such as meadows or wetlands, continue to fragment the natural environment and threaten species’ survival.
Based on the latest LUCAS survey, Figure 2.1 provides a country-by-country view of terrestrial protected areas, expressed as a share of national surface area. It reveals significant variation across Member States. Bulgaria leads with 41 % of its land designated as protected, followed closely by Slovenia (40.5 %). The EU average of 26.1 % sits just below Member States such as Spain and France, which have 28.1 % of their land designated as protected areas. At the other end of the scale, Finland (13.4 %), Ireland (13.9 %) and Belgium (14.7 %) report some of the lowest shares of protected territory.
Beyond national totals, the structure and distribution of protected sites also matter. Figure 2.2 maps Natura 2000 areas across the EU, highlighting differences in how Member States approach land conservation. Larger connected areas (as seen in Sweden) can support more species and ecological processes, whereas fragmented patches may fail to do so. Coastal areas also emerge as key biodiversity zones, with notable concentrations of large protected areas in the North Sea and the Baltic Sea and off the coast of France.
These patterns illustrate that protecting land is not just about quantity, but also about spatial planning and ecological coherence.
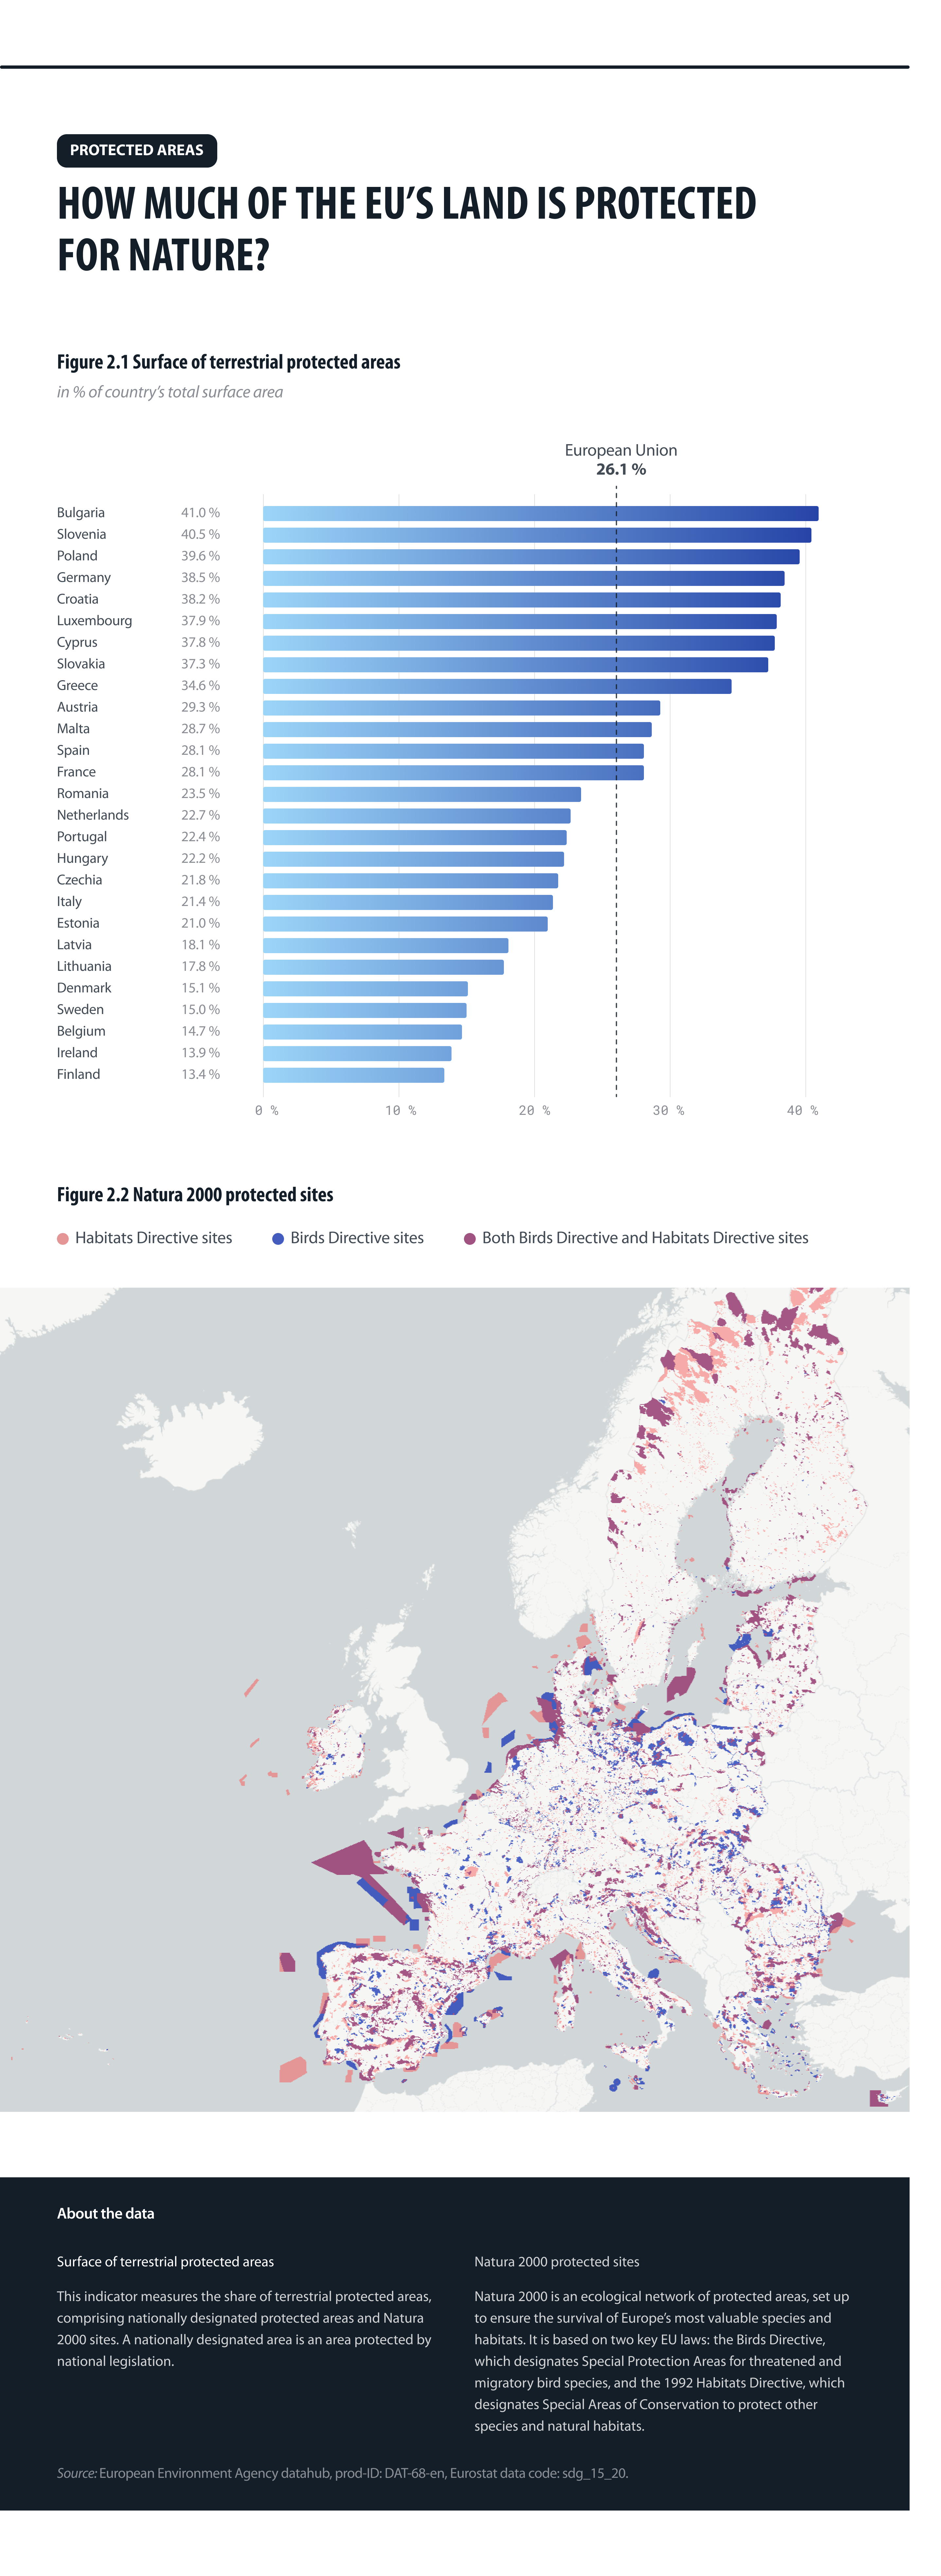
Figure 2: How much of the EU’s land is protected for nature?
Source: European Environment Agency datahub, Eurostat, data.europa.eu.
What can birds tell us about biodiversity health?
One of the most visible and informative signals of biodiversity health comes from birds. Birds respond quickly to shifts in habitat quality, food availability and agricultural practices, making them reliable indicators of broader environmental conditions.
To monitor ongoing developments across rural areas, the EU uses the Common Bird Index – a long-running indicator based on the population trends of widespread bird species. It offers a window into how biodiversity is faring over time and across different landscapes.
Figure 3.1 provides a time series of how bird populations have evolved. While the Common Forest Bird Index dipped to 87 % in 2016, it has since rebounded to 95.5 % in 2023 – indicating relative stability in forest ecosystems. The picture is more concerning for farmland birds: the Common Farmland Bird Index has shown a steady and significant decline, falling to just 57.9 % in 2023. When combined, these trends result in an overall Common Bird Index of 85 % – a figure that does not depict the more serious declines among species most affected by agricultural intensification and landscape change.
Figure 3.2 gives a broader view of bird species’ conservation status in the EU in 2020. Of the 417 evaluated species, only 222 (53.2 %) are considered secure. The remainder fall into categories indicating concern: 42 near threatened, 24 declining, 33 depleted and 96 threatened. An additional 74 species either have not been evaluated or have an unknown status. These numbers show that approximately only half of the assessed bird species in Europe with a known status are currently considered secure, while nearly as many fall into categories of conservation concern.
Given that birds are a well-studied, responsive and ecologically significant group, these findings act as a broader signal. The health of bird populations reflects the health of entire ecosystems. Despite ongoing efforts and investment, the persistent decline in farmland bird species calls attention to the need for more targeted, effective biodiversity strategies.
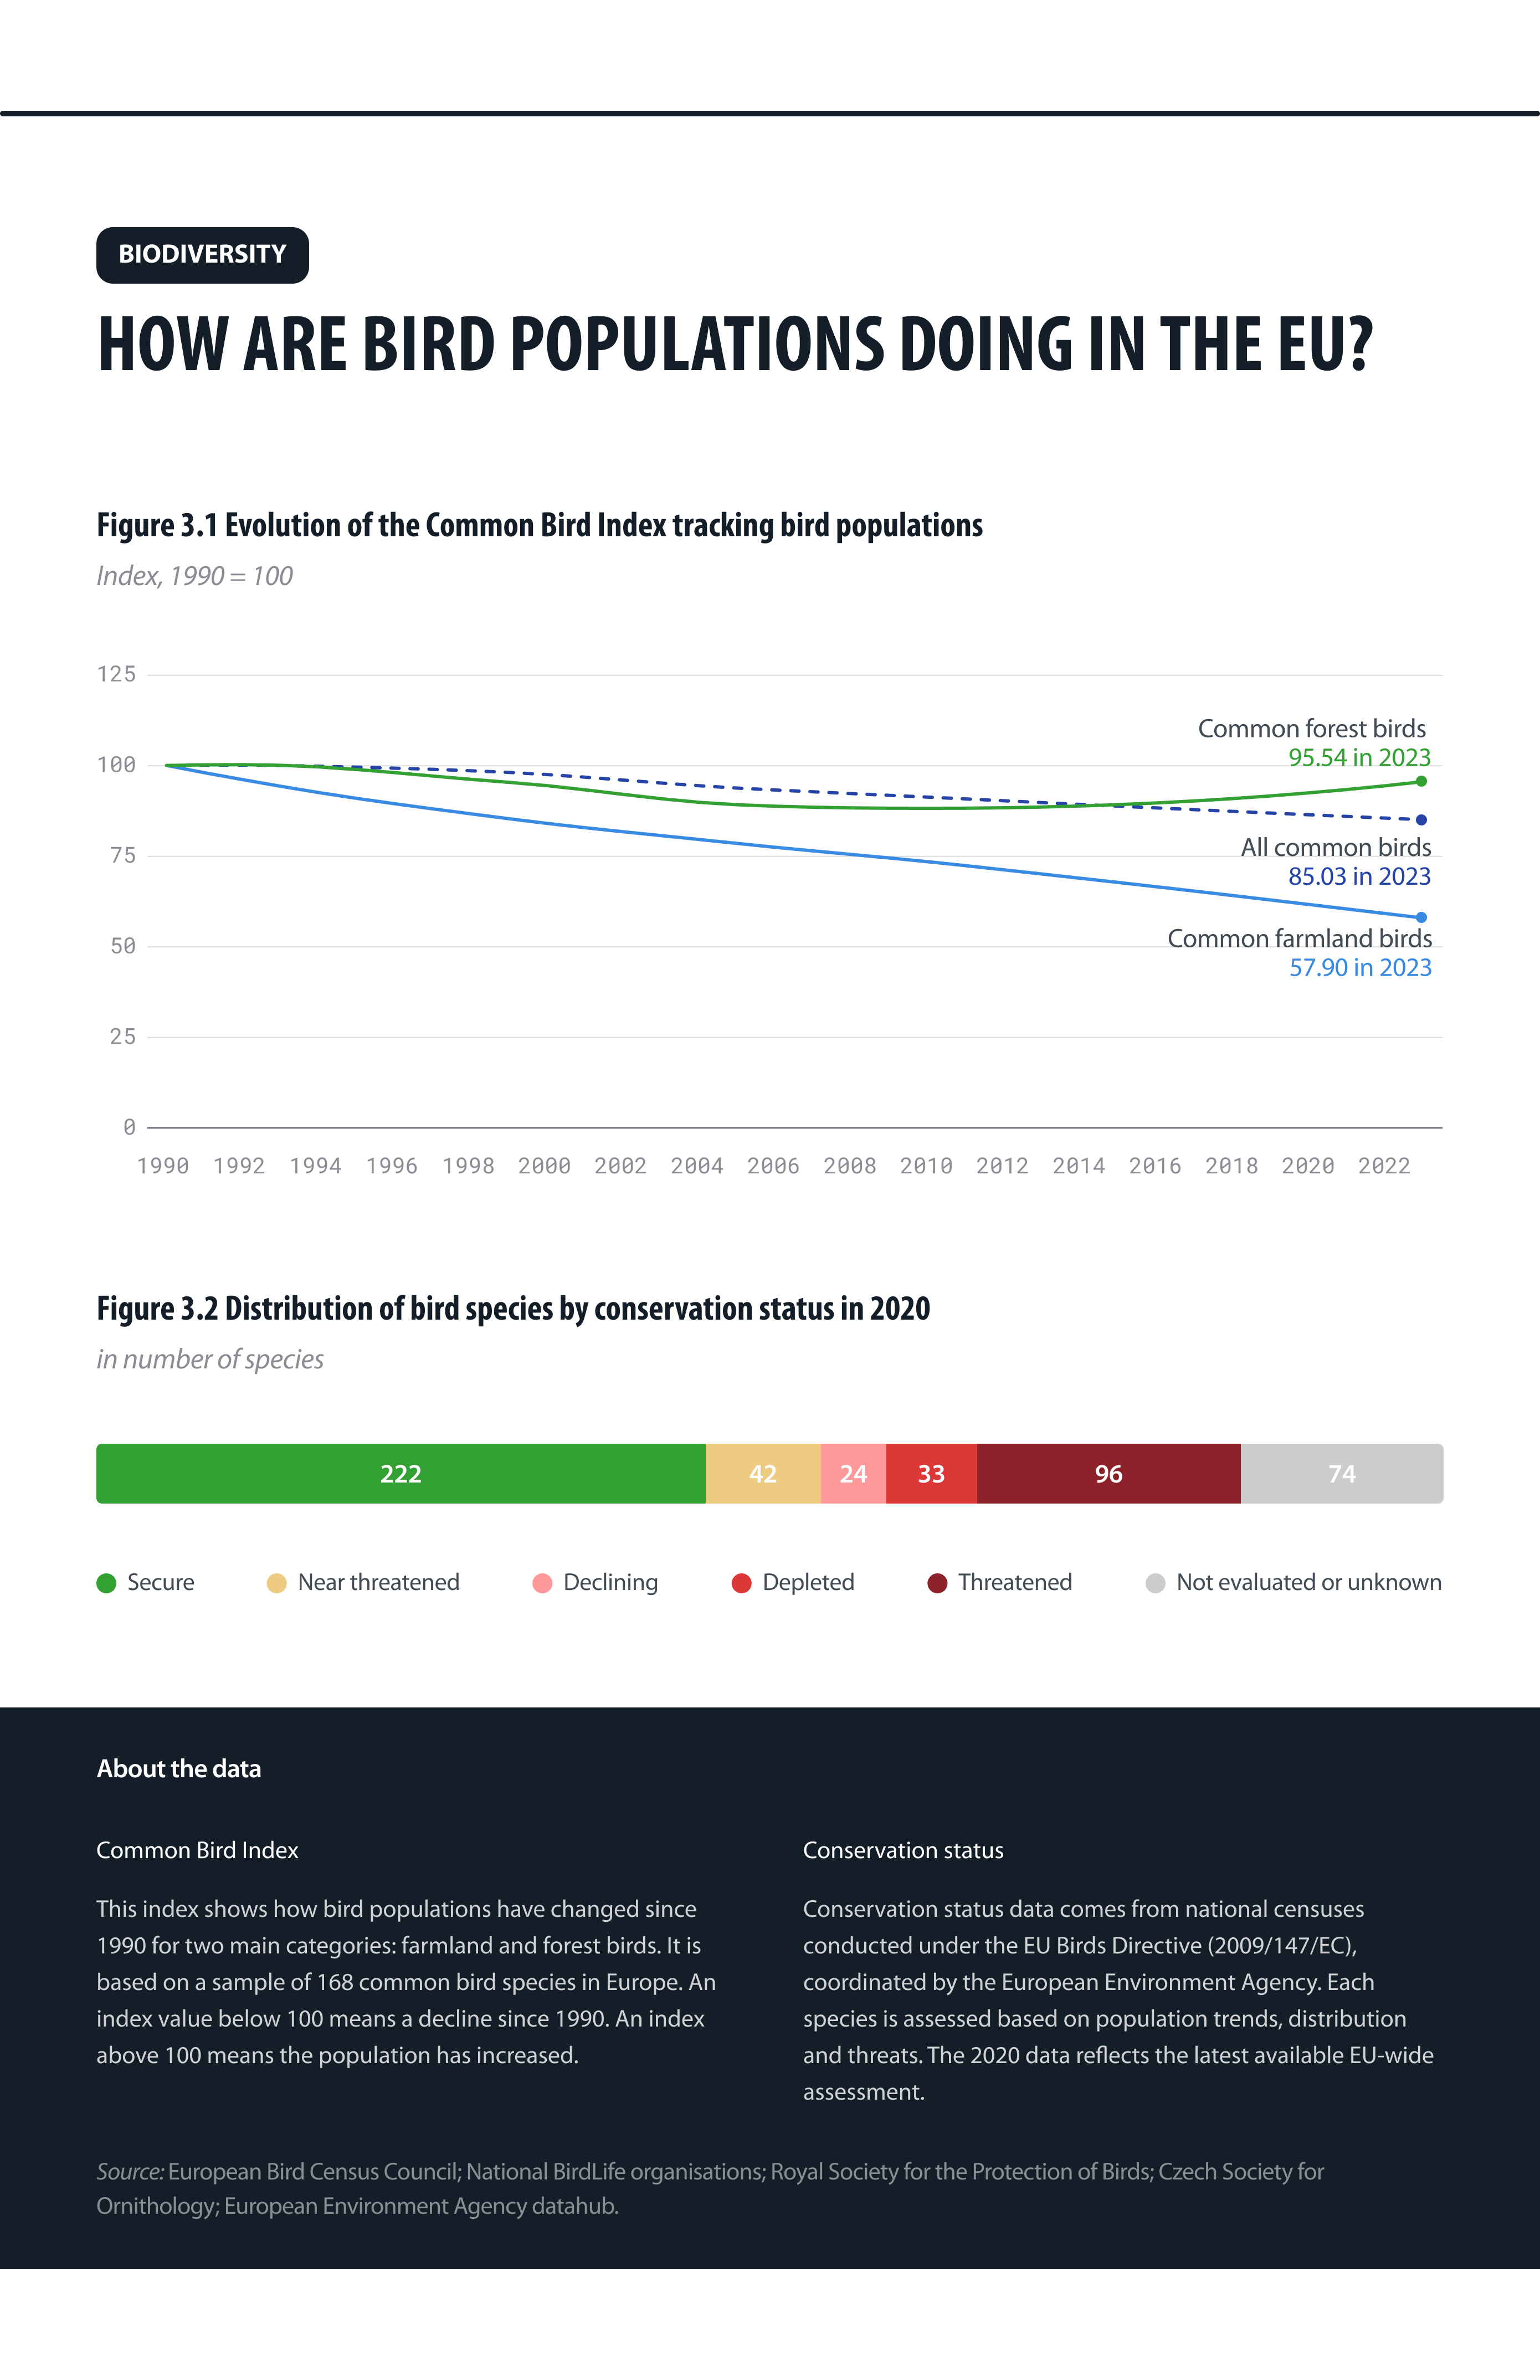
Figure 3: How are bird populations doing in the EU?
Source: European Environment Agency datahub, Eurostat, data.europa.eu.
Conclusion
This data story shows how open data can help track the EU’s biodiversity efforts across multiple dimensions. Starting with environmental spending, we saw that while some Member States prioritise biodiversity more than others, the latest available data shows that aggregated investment in this area has yet to return to 2015 levels. Linking funding to land use, open data also revealed wide differences in how much of each Member State’s territory is protected, showcasing both achievements and remaining gaps. The data also points to concerning biodiversity outcomes: bird population trends, especially the steady decline in farmland species, highlight the pressure Europe’s ecosystems continue to face.
By connecting these layers, open data offers valuable insights to help develop stronger, more effective biodiversity policies. Beyond indicators and budgets, data.europa.eu also hosts more specialised datasets — such as the Visual WetlandBirds Dataset, featuring annotated videos for bird behaviour analysis — supporting cutting-edge research and innovation in environmental monitoring.
Discover more at data.europa.eu and stay informed by subscribing to our newsletter.