An ageing Europe: what the data tells us
Population trends, regional differences and healthy life years across the EU
How many people over 90, or even over 100, do you know? Europeans are living longer than ever before. Today, people aged 80 and over are the fastest-growing age group, while around one in five people in the EU is aged 65 or over. Combined with declining birth rates, the balance between younger and older generations is steadily shifting.
But how has Europe’s population changed over time and what might the future look like? Where is ageing most pronounced? What does a longer life mean in practice and how many of those extra years are spent in good health?
Using open data, this story explores these questions and traces how ageing is developing across the EU.
How is Europe’s population changing over time and what might the future look like?
As Europeans live longer and birth rates continue to fall, the EU’s population is changing both in size and in age structure (see Figure 1). Over the past few decades, the number of inhabitants has grown steadily from about 355 million in 1960 to around 450 million today.
What happens next depends largely on a key demographic factor: migration. Under the baseline scenario, the EU’s population is expected to peak in the coming years and gradually decline to about 416 million by 2100. Different migration assumptions lead to different outcomes regarding the population size in 2100, but in all scenarios the population becomes older. Migration can influence how many people live in the EU and can slow the pace of ageing, but it does not stop the overall trend towards an increasingly older population.
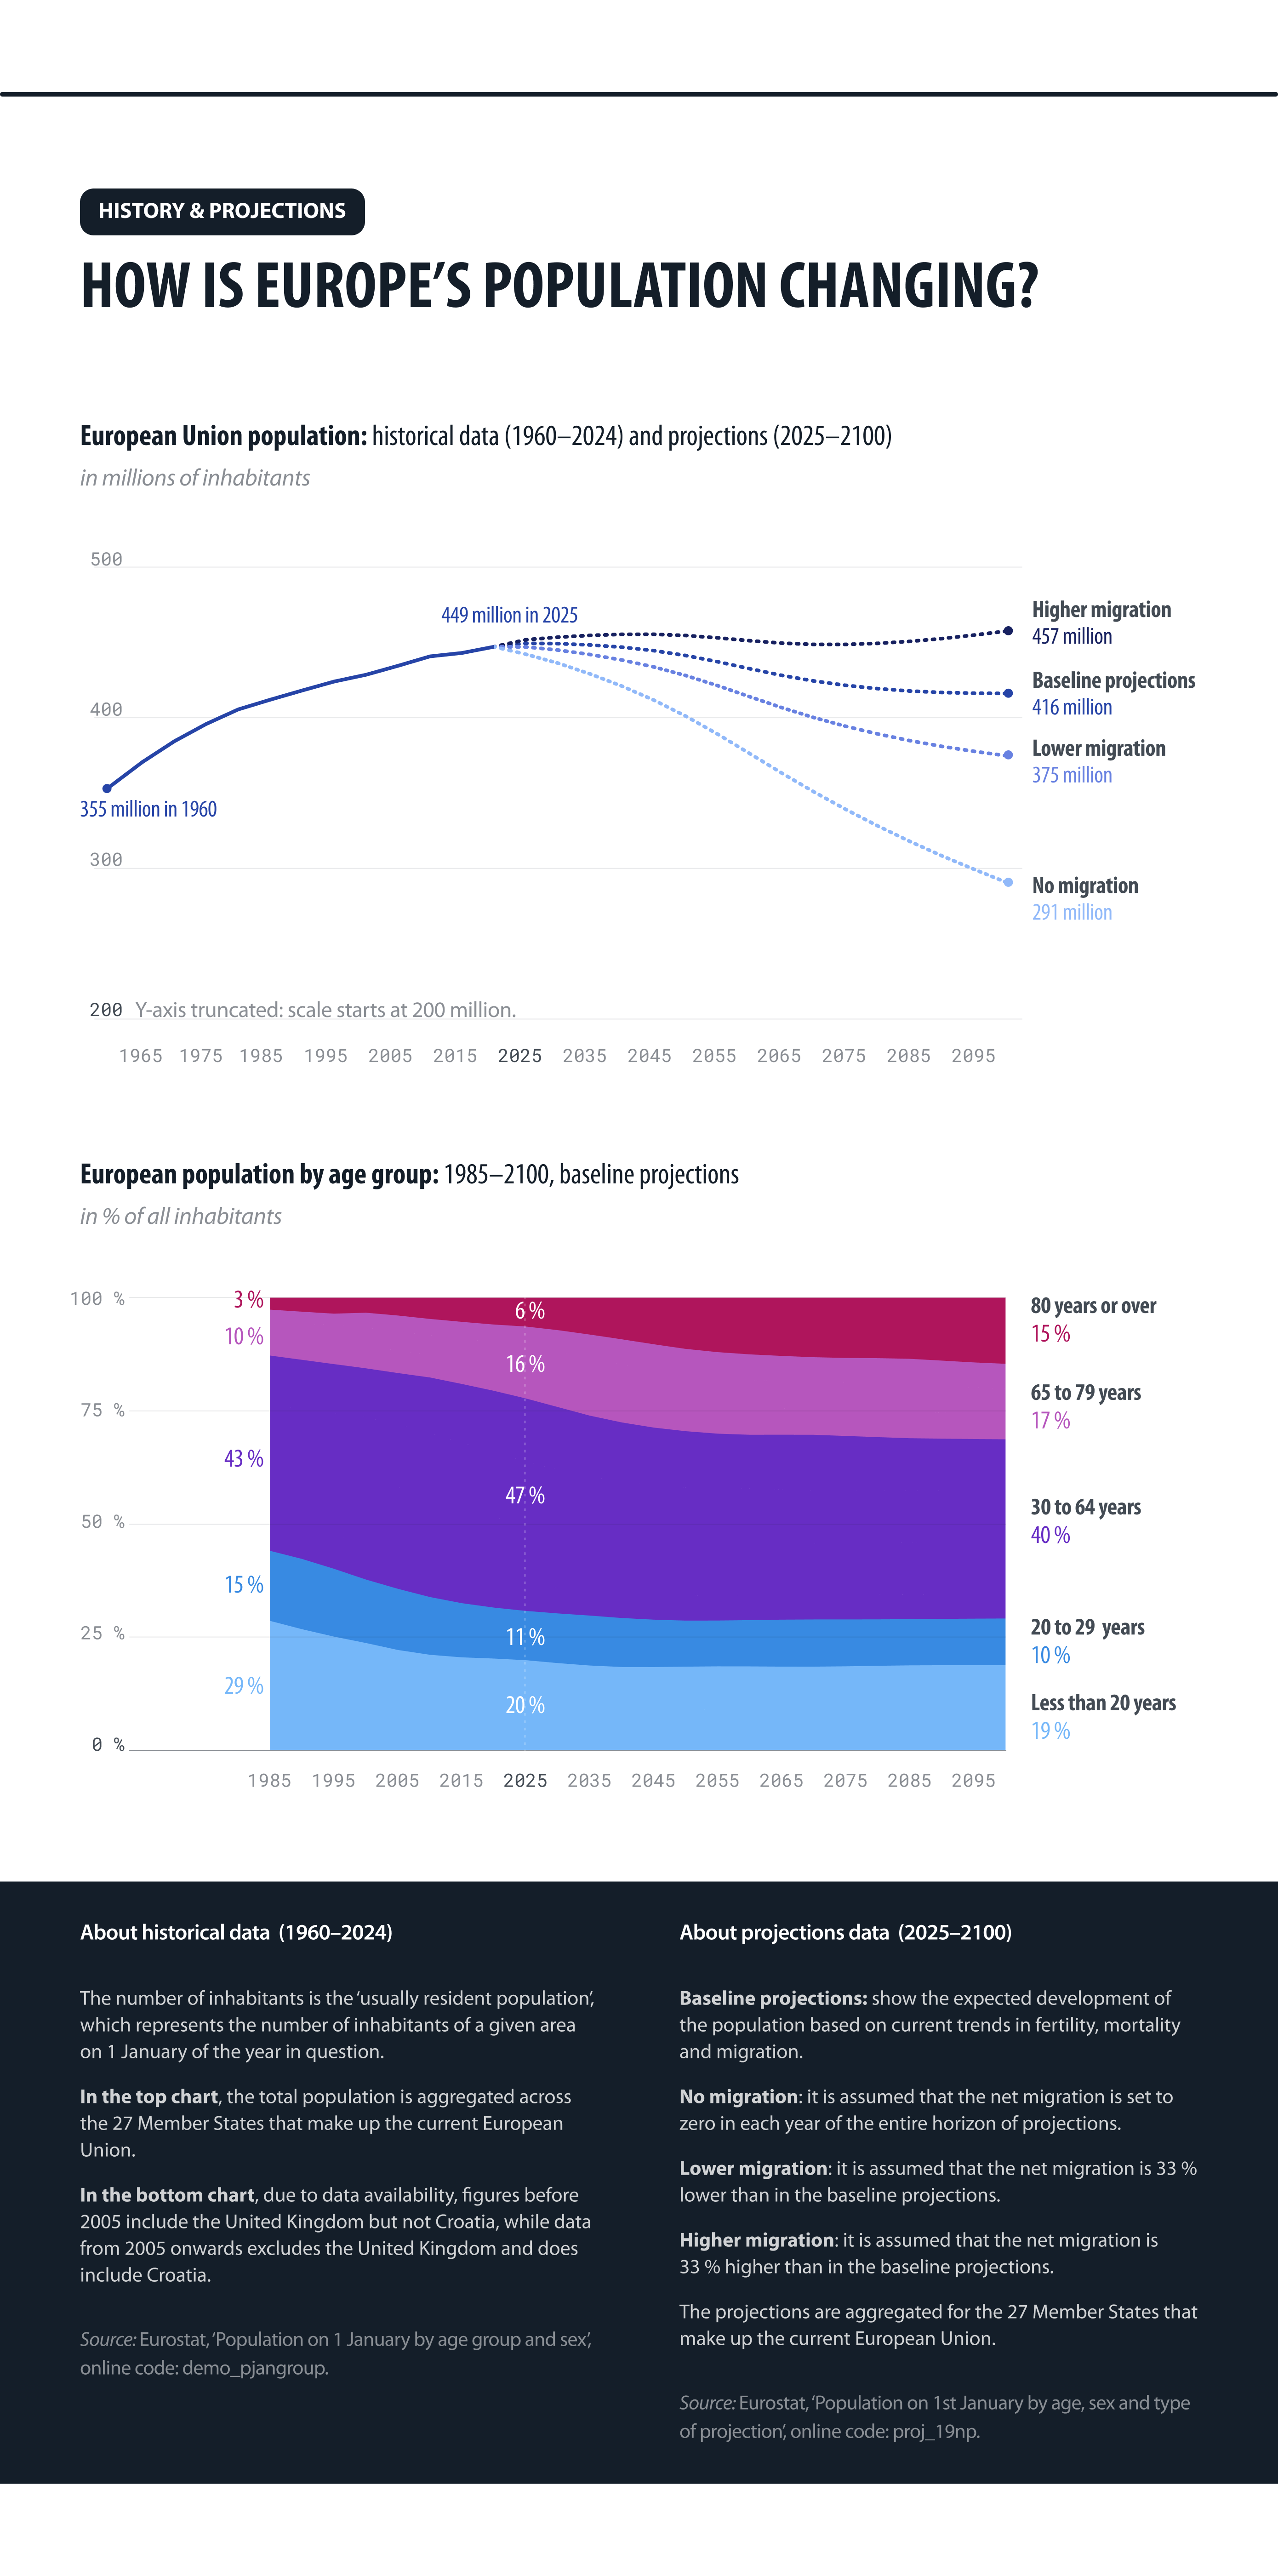
Figure 1: Historical and projected EU population and age group distribution
Sources:
- Historical data: Eurostat / European Data Portal
- Projections data: Eurostat / European Data Portal.
This change in the age structure is probably the most significant one. The number of people aged 80 and over is rising rapidly, and, under the baseline scenario, this group is projected to represent around 15 % of the population by 2100, compared with only a small share in past decades. At the same time, younger age groups are becoming smaller, and the share of people of working age is declining.
Moreover, the data shows that this trend affects all Member States, albeit not evenly, as we will see in the next section.
How does ageing vary across regions in the EU?
While the population of all Member States is ageing, some regions have much higher shares of older residents than others.
One way to measure this is through the old-age dependency ratio, which compares the number of people aged 65 or over with those aged 20 to 64. A higher ratio means that older people represent a larger share of the population relative to those of working age.
Figure 2 shows regional patterns. Higher old-age dependency ratios are concentrated in many rural and less densely populated regions, including parts of central France, eastern Germany, northern Portugal, central Greece, eastern Finland and the Belgian coastal region. In some of these areas, there are around 70 people aged 65 or over for every 100 people of working age.
By contrast, capital regions and major cities tend to have much lower old-age dependency ratios. This is reflected in some of the lowest old-age dependency ratios in Europe, for example that of Copenhagen (17.8 %). These areas have a larger working-age population and more students, often reflecting patterns of internal migration.
These differences highlight that ageing is not only a national trend but also a regional one, with some regions already experiencing much older population structures than others.
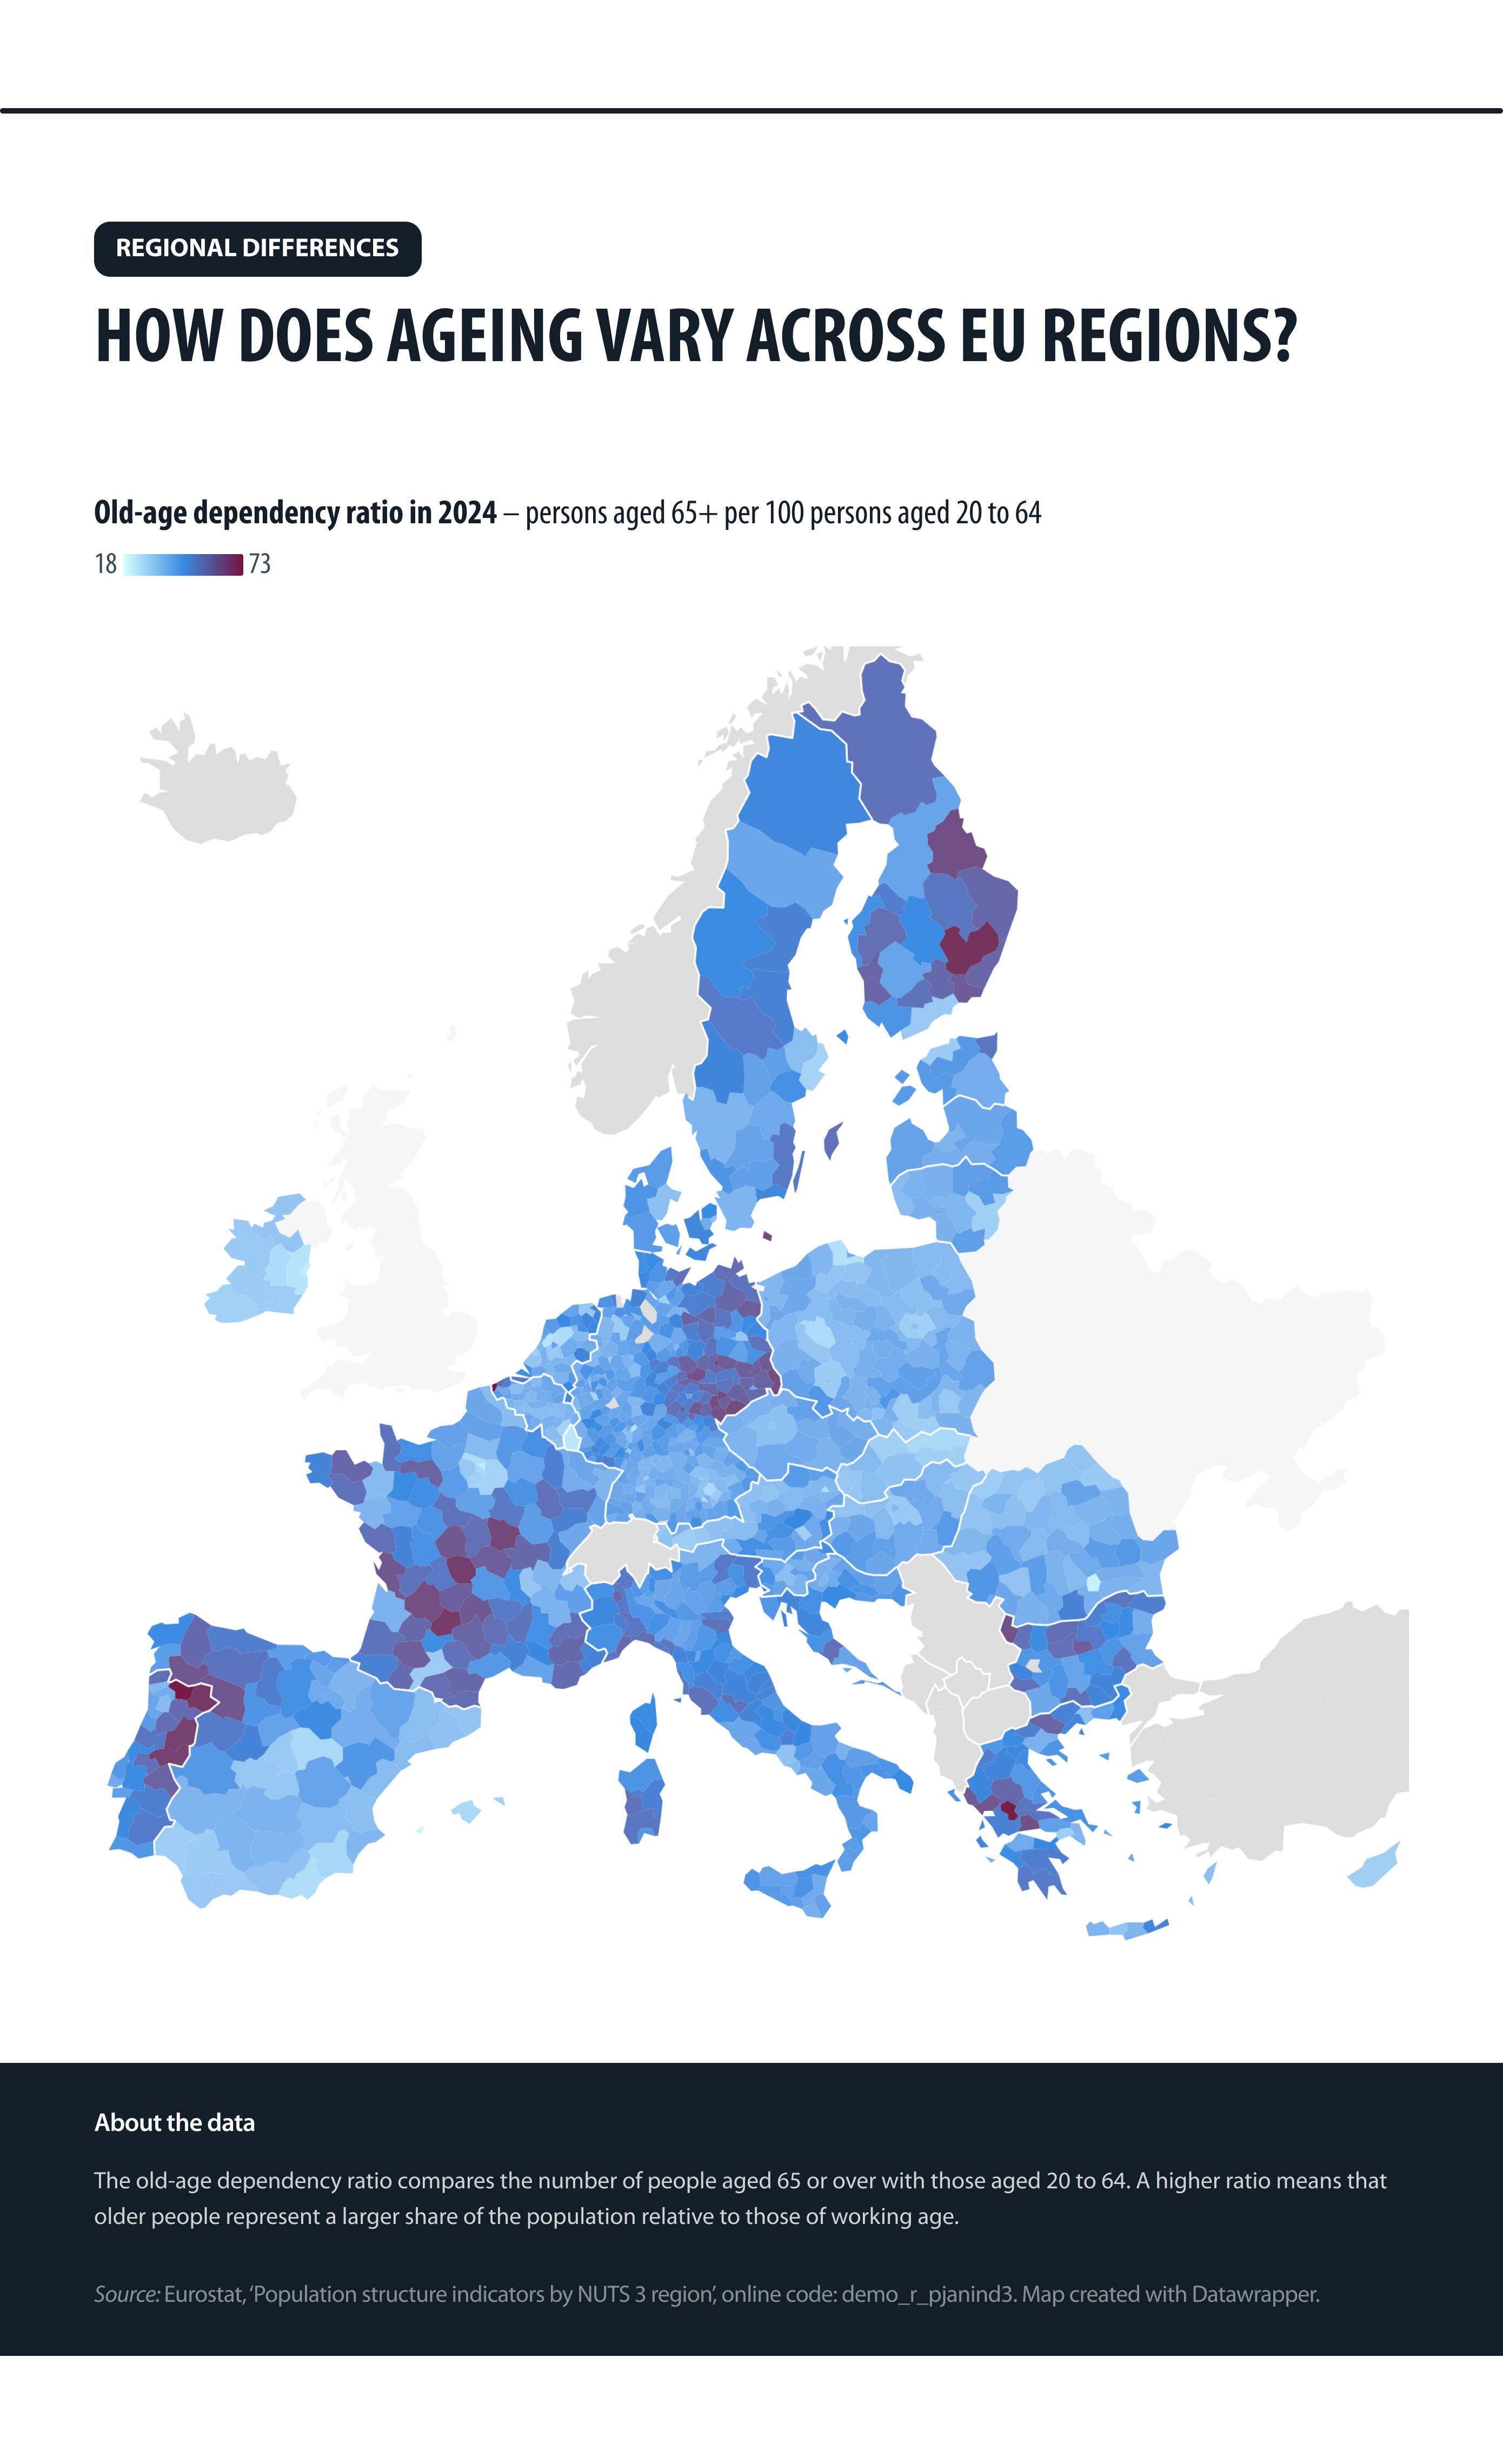
Figure 2: Old-age dependency ratios across EU regions (NUTS 3)
Source: Eurostat / European Data Portal.
How long do people live and how many of those years are healthy?
Europeans are living longer than ever before, but longevity alone does not show how those additional years are experienced. Healthy life years estimate how many years people can expect to live without long-term activity limitations.
Figure 3 compares life expectancy with healthy life years across Member States and between women and men. Life expectancy varies across the EU, with people in some countries living well into their eighties (highest in Spain with 85 years), while in others it remains several years lower (lowest in Latvia with 74.5 years). Healthy life years also differ considerably, showing that longer lives do not always mean more years spent in good health.
At the EU level, people live around 81.4 years on average, of which about 63.3 years are lived without activity limitations. The difference of approximately 18 years between these two indicators represents the number of years people are more likely to experience health limitations. This gap varies across Member States, ranging from around 7 years in Bulgaria to about 26 years in Denmark.
A consistent pattern across the EU is the difference between women and men when it comes to life expectancy. On average, women live longer than men in every Member State (84 versus 78.7 years at the EU level). Nevertheless, their number of healthy life years is similar at the EU level (63.3 versus 62.8 years, respectively), while in several Member States women lag behind men in healthy life expectancy. These findings indicate that a larger share of women’s longer lives is spent with activity limitations.
The data shows that living longer does not automatically mean living healthier. Making sure people can enjoy more of those years in good health has implications for both individuals and health systems.
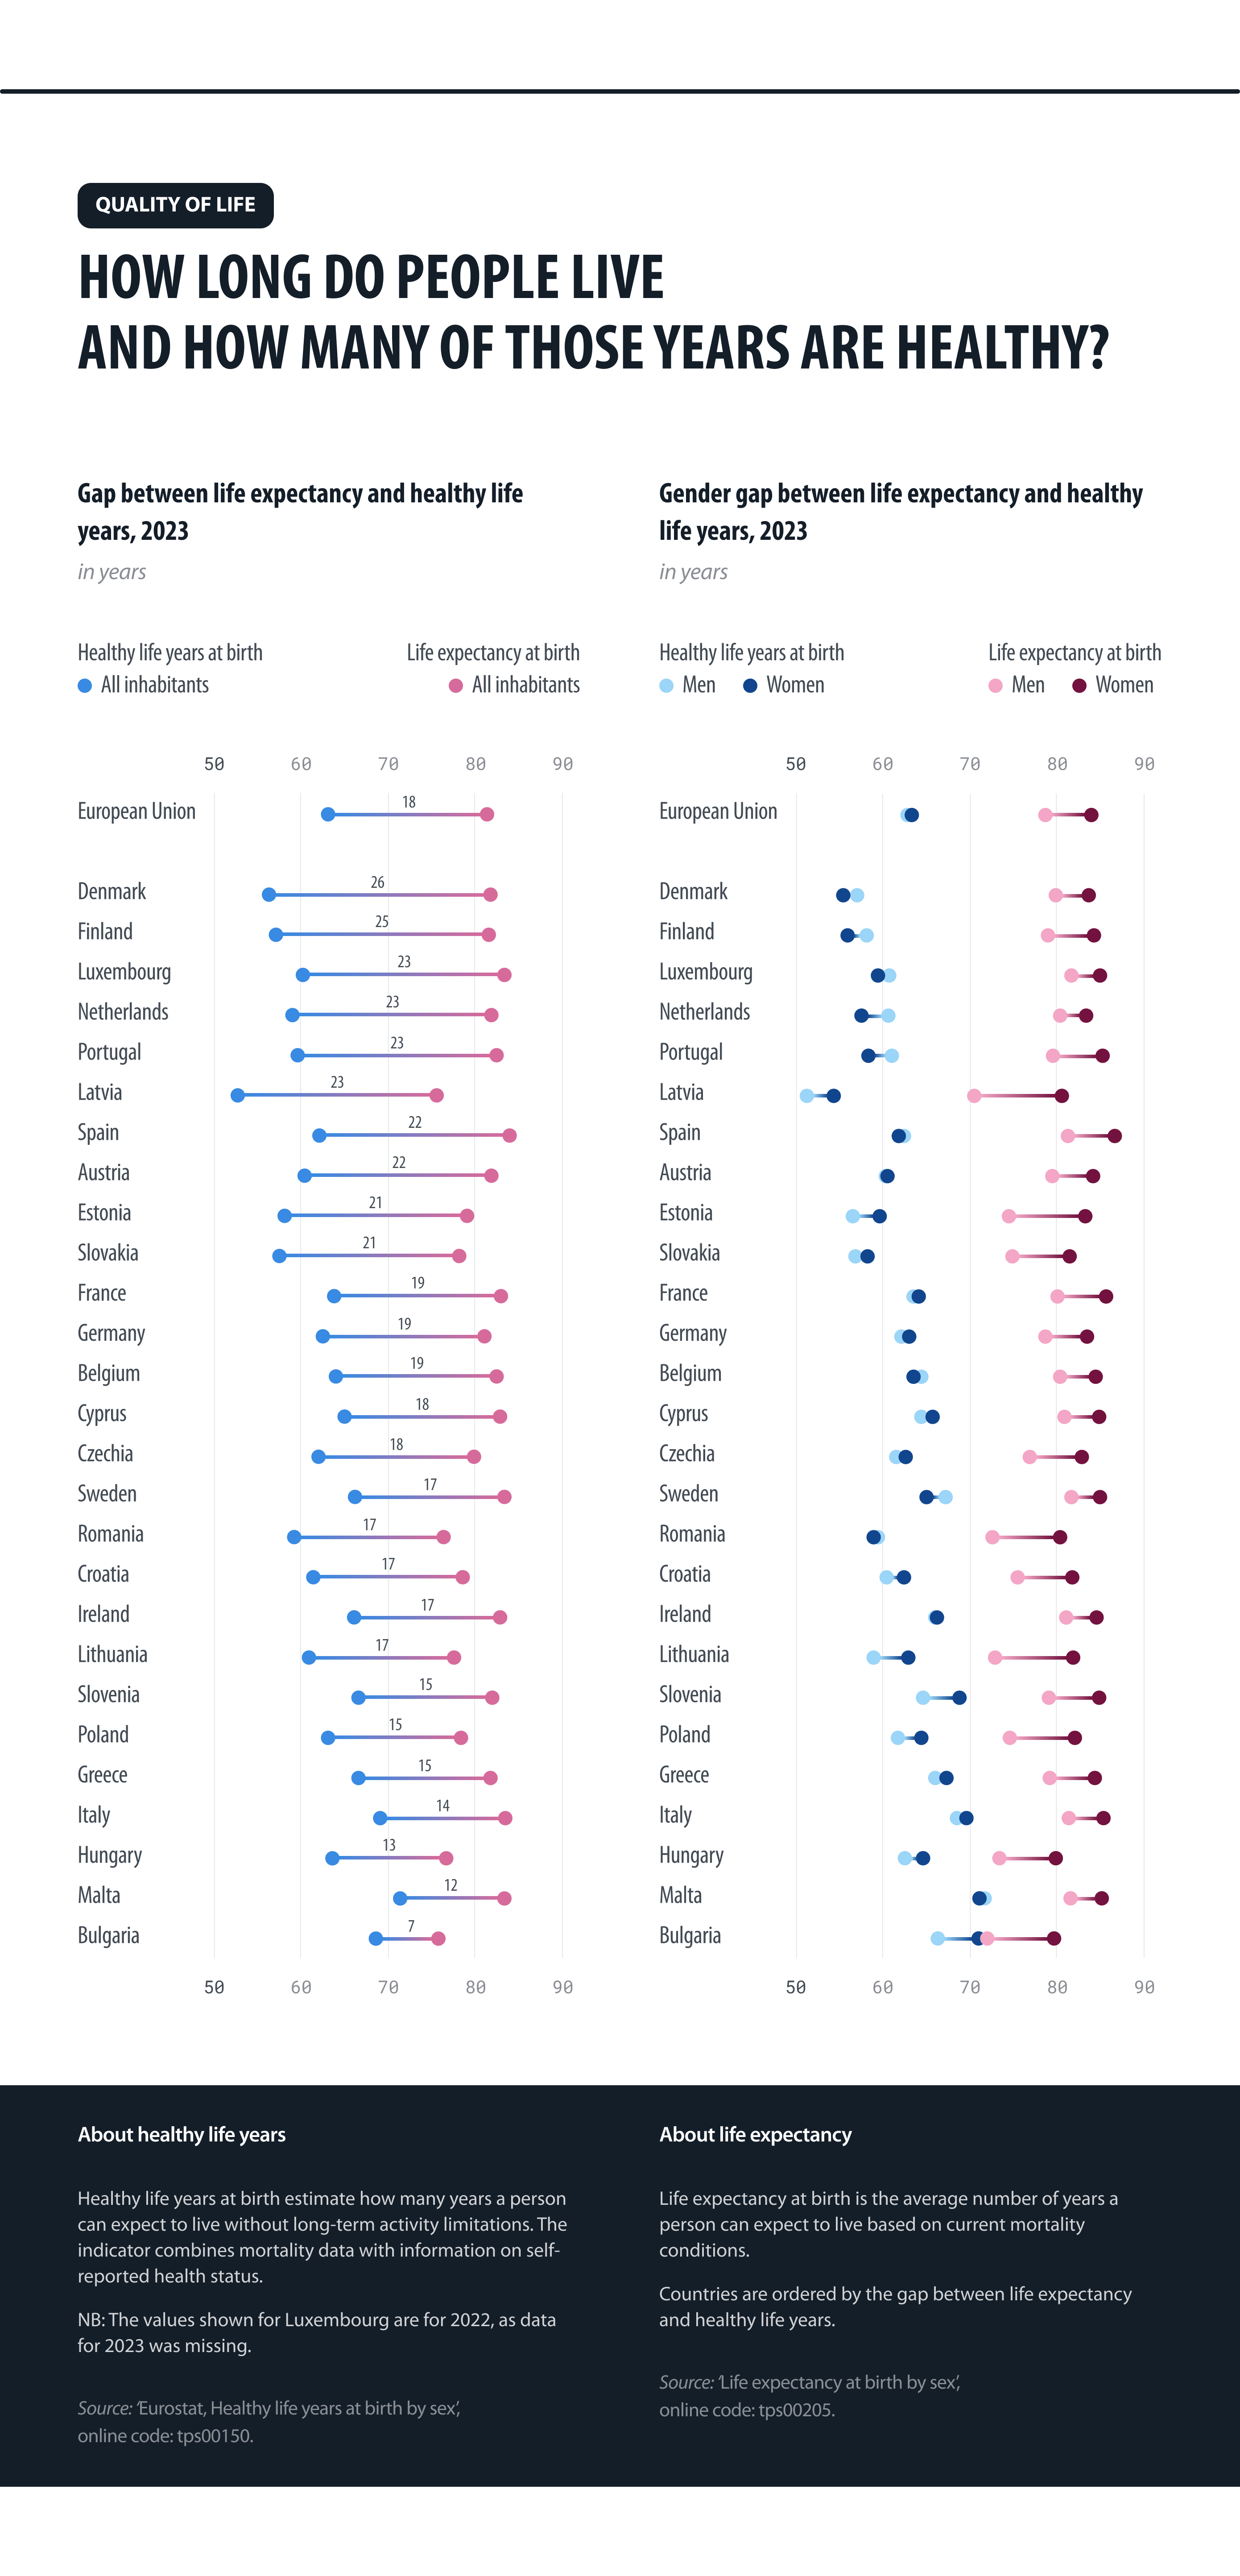
Figure 3: Life expectancy and healthy life years at birth in the EU
Sources:
- Healthy life years: Eurostat / European Data Portal
- Life expectancy: Eurostat / European Data Portal.
Conclusion
Europe’s population is becoming older across all Member States. While the total number of people may grow or decline depending on future migration, the shift in the age structure is clear: older age groups are expanding, and younger ones are shrinking.
This change is not uniform. Some regions already have much older populations than others, particularly outside major urban centers. These differences show that ageing is shaped by local demographic patterns, along with national trends.
Living longer does not automatically mean living more years in good health. Healthy life years vary widely across the EU, and although women live longer than men, they do not usually spend more years without activity limitations.
Together, these patterns show that population ageing in Europe is not only about longevity, but also about where people live and how healthy longer lives are. Open data makes these developments visible and helps to better understand how societies across the EU are changing.