How the EU supports the public sector in overcoming data challenges
Exploring the big data test infrastructure and its capabilities using an example use case
If you are a devoted reader of the data.europa.eu data stories, you have likely come across numerous inspiring examples of open data reuse. Each story illustrates what can be achieved by the best data science practices, by the amazing tools available to us today, and by incredibly effective and beautiful visualisations. Maybe you were also wondering how to create such visualisations yourself and develop these skills. For your data literacy and skills, you may already know about the significant effort data.europa.eu puts into curating the data.europa academy. But what about the tools, particularly when they are complicated to set up and expensive to run?
The European Commission is helping to address this challenge with a service called the big data test infrastructure (BDTI). The BDTI offers public administrations a set of mainstream open-source tools for data storage, processing and analytics, hosted in the cloud and free of charge. It is offered to civil servants at all levels of government in Europe so that they can autonomously run pilot projects that demonstrate the value that data can bring to policymaking or administration. Civil society, academia and even the private sector can join the pilot projects, so long as a public administration body is at the centre of the use case.
This data story delves into the BDTI service and its capabilities. After introducing the service and its characteristics, one use case will showcase the practical implementation and capabilities of the platform. The use case demonstrates the application of a variety of open-source tools, reusing multiple open datasets, complemented by several fictional datasets. As the platform is built upon open-source tools, this data story offers valuable insights for anyone interested in the reuse of both software and data.
The EU’s Big Data Test Infrastructure: what it is and how it works
The EU’s Big Data Test Infrastructure, BDTI, was created in 2019, as part of the Digital Europe Programme, which aims to accelerate Europe’s economic recovery and shape the digital transformation of Europe’s society and economy, increasing the easy availability, quality and usability of public sector information in compliance with the requirements of the European open data directive.
The purpose of the BDTI is to foster the reuse of public sector data and enable a data-informed public sector in the EU Member States. By providing a free-of-charge analytics test environment with open-source tools, the BDTI allows public administrations to prototype solutions before deploying them in the production environment on their own premises.
The BDTI applications are offered as a cloud service, enabling users to experiment with data in a pilot project. Once the project is over, users can take the source code and data with them to continue the work using the cloud of their choice or other resources. The platform consists of open-source tools and the required cloud infrastructure, which includes virtual machines, analytics clusters, storage facilities and networking facilities. To learn more about the tools available, you can have a look at the service offering page.
Use cases and success stories
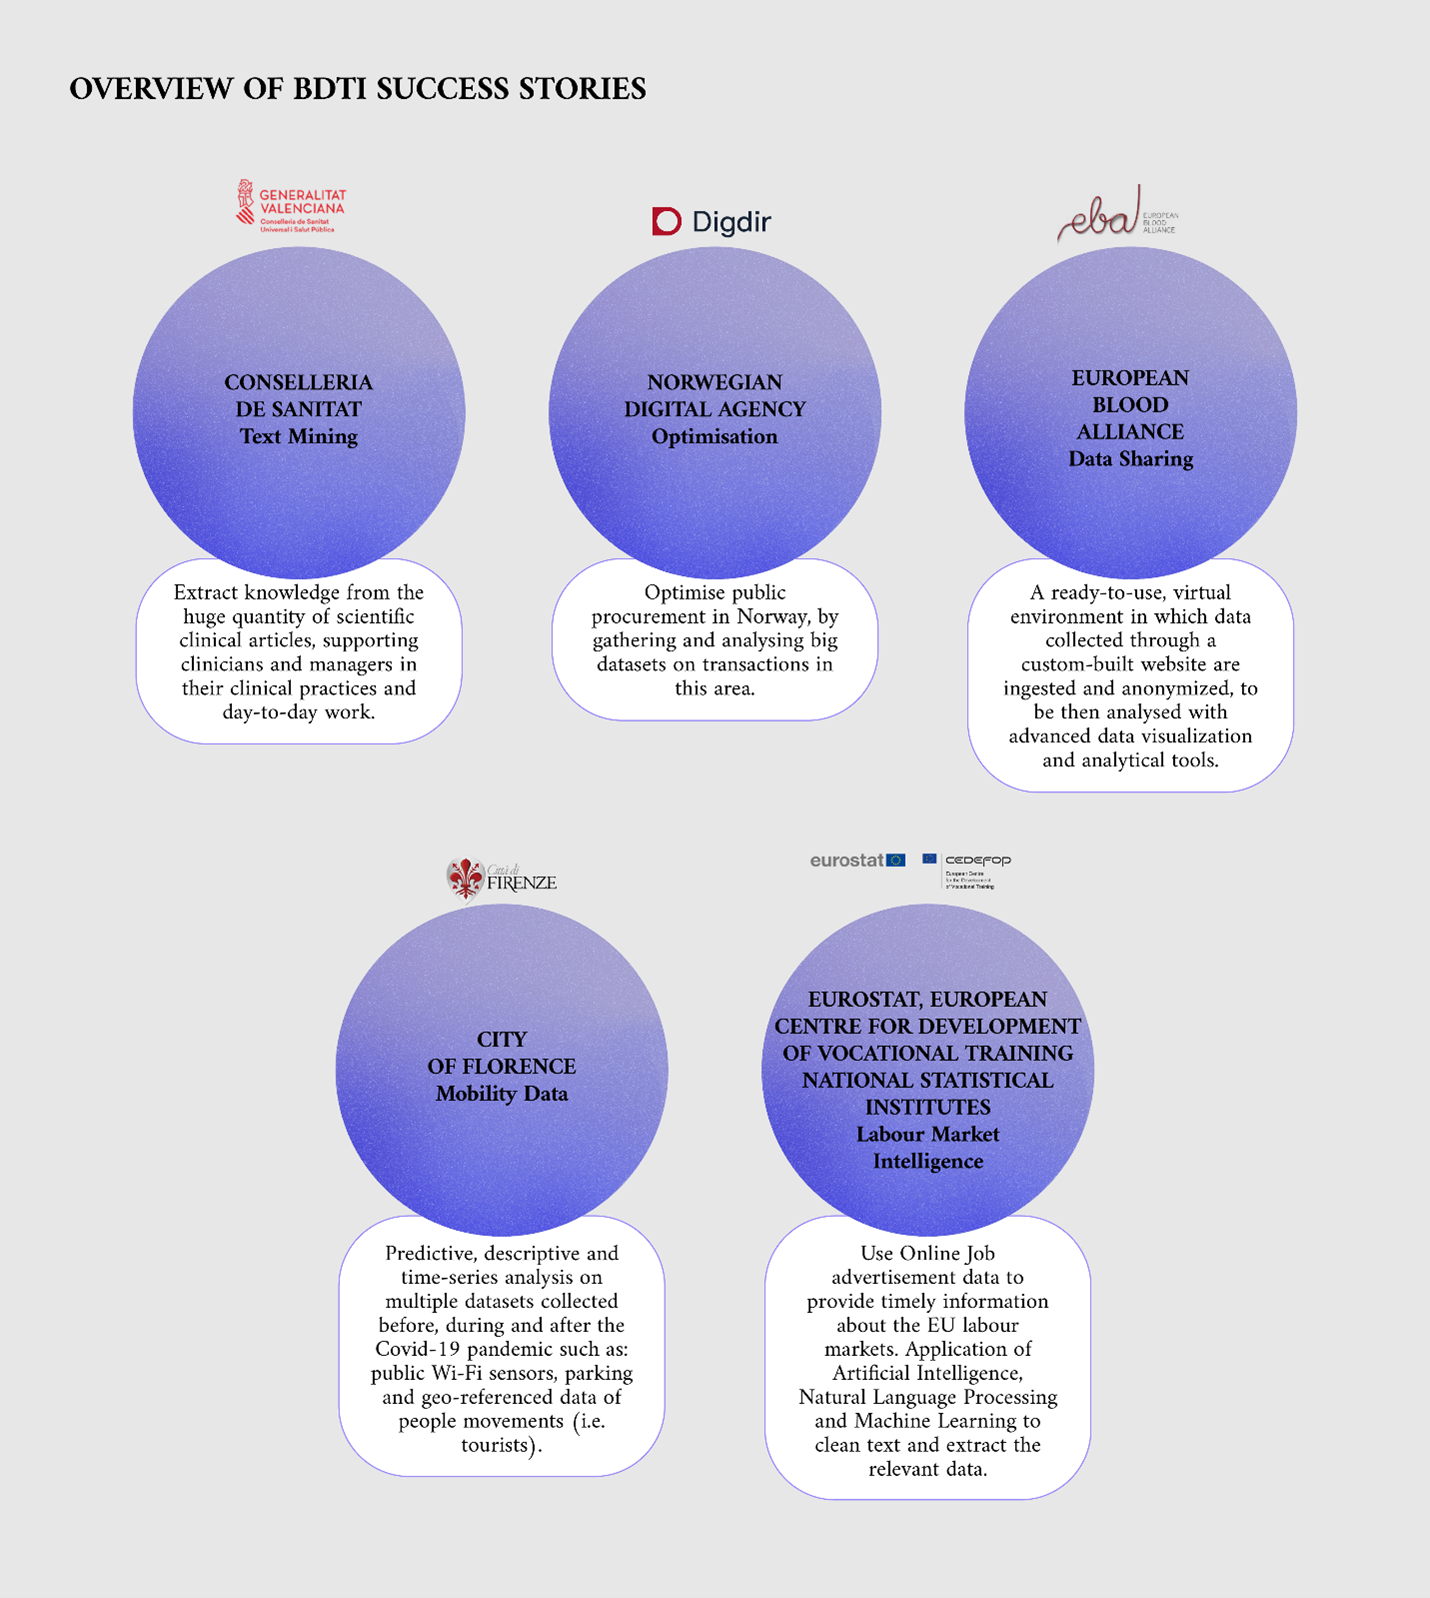
To demonstrate how the platform works and how to use it, it showcases several real-life success stories. Figure 1 provides a list of these success stories. For example, Eurostat and its partners used the BDTI to experiment with data in the development of official statistics. In this pilot project, open online job advertisement data was used to provide timely information about European labour markets.
Other real-life success stories are text mining by the Health services of the city of Valencia, the optimisation of public procurement by the Norwegian Digitalisation Agency, data sharing efforts by the European Blood Alliance, and work to facilitate the understanding of COVID-19’s impact on the city of Florence.

Figure 1: Overview of the BDTI success stories
Additionally, the BDTI website provides multiple use cases that showcase the platform’s capabilities, based on open data. For example, the search analytics use case is based on the CORDIS open dataset, and the low code analytics use case works with the EMHIRES – European Meteorological derived High Resolutions RES generation time series for present and future scenarios - open dataset on solar power generation.
In the following sections of this data story, we present the fictional ‘government spending’ use case, which was developed for demonstration purposes by the BDTI team to show how the service’s capabilities and tools can be applied to generate valuable insights from data. The project will be made available on GitLab, an open-source code repository and collaborative software development platform.
The ‘government spending’ use case
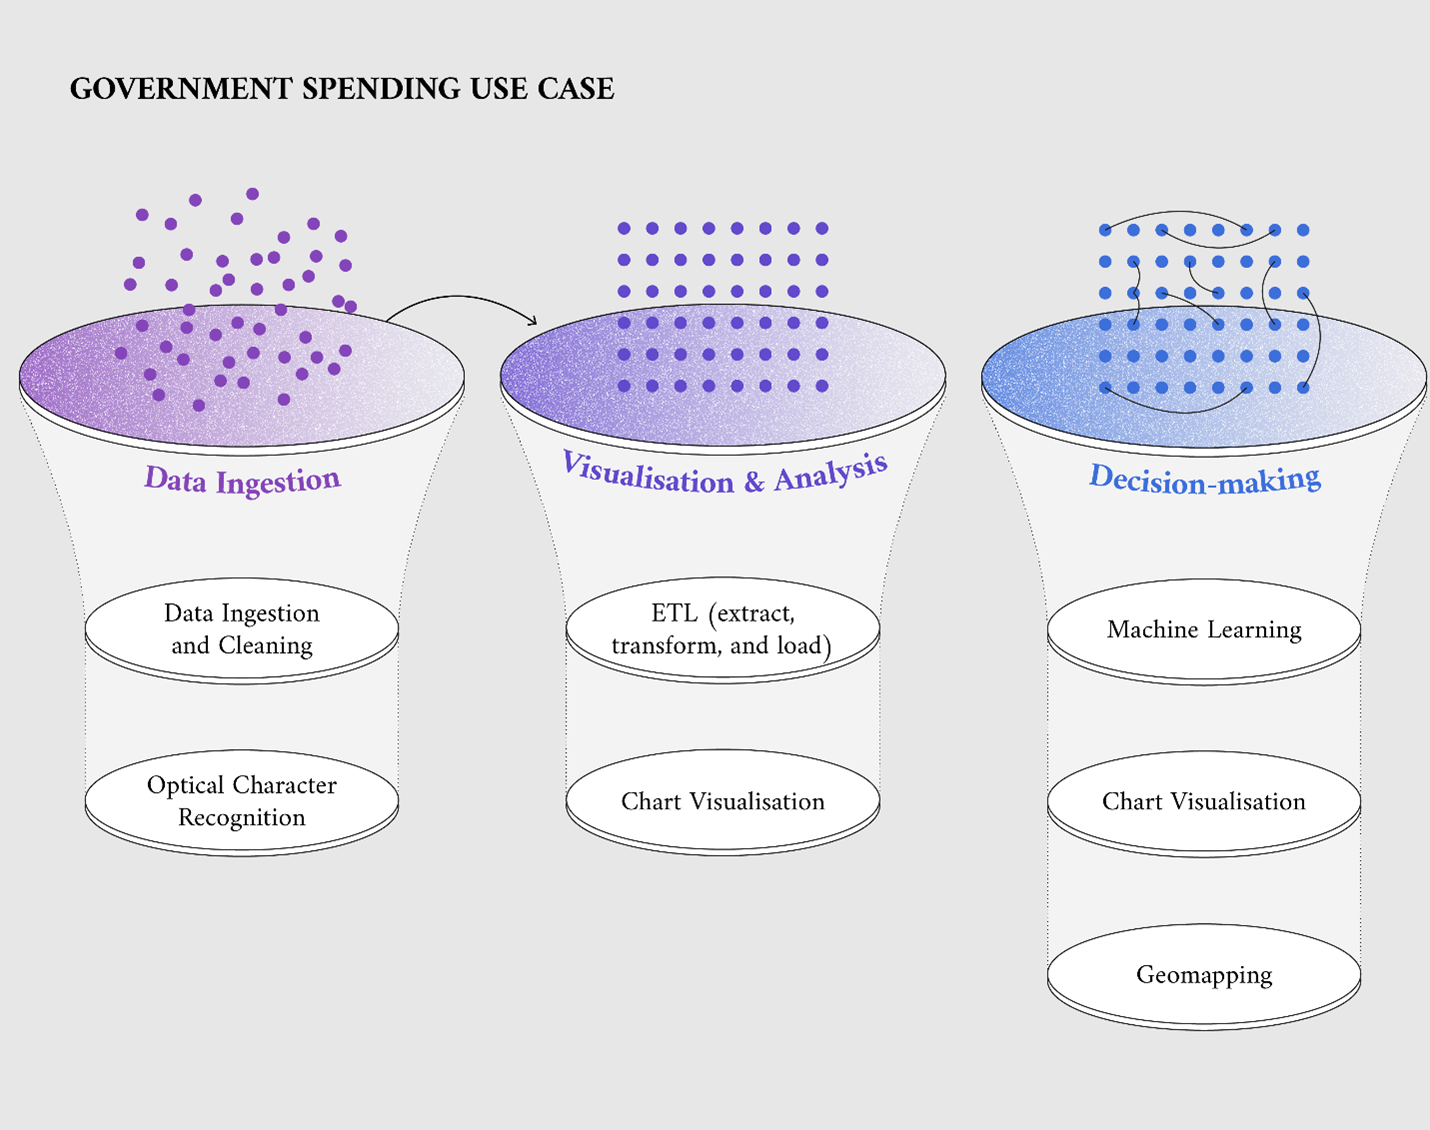
The ‘government spending’ use case as developed by the BDTI team consists of three stages typical of a data science project: (1) data ingestion; (2) visualisation and analysis; and (3) decision-making (Figure 2). The subject of the fictional use case is the municipality of Dublin. The demonstration use case is based on open data where possible, supplemented by fictional data. Government spending data for Dublin is retrieved from data.smartdublin.ie. Historical traffic data is retrieved from data.gov.ie, and the weather forecast is retrieved from open-meteo.com. In contrast, the government spending data used in this demonstration case as a point of reference is fictional, referring to two fictional reference cities, city A and city B. The methodological notes of this data story provide details on how to access the full documentation on the datasets used.
In steps 1 and 2 of this demonstration use case, the BDTI’s tools are used to ingest and visualise government spending data. Step 3 uses machine learning to build a solution aiming to reduce spending on public lighting. The next paragraphs provide further explanations of each stage.

Figure 2: The ‘government spending’ demonstration use case and the methodologies applied
Data ingestion
The first step of the demonstration use case is the ingestion of government spending data. The specific challenge that needs to be addressed relates to energy invoices, which are only available in PDF format in our scenario. These non-machine-readable PDF invoices must be transformed into data that can be easily processed later.
To solve this challenge, a solution is built using a tool available on the BDTI. This tool is an open-source software that has an intuitive, visual interface and does not require coding, including optical character recognition features. Optical character recognition is a technology that interprets human-readable documents and transforms them into machine-readable data.
The output table can be reused to further process and analyse the data. BDTI offers a solution to store the output data in preparation for the next step in a relational database system.
Visualisation and analysis
After completing the data ingestion, the next step is to visualise and analyse the government spending data. To do so, we use the open-source tool on data exploration and visualisation available on the BDTI.
The result is a dashboard that visualises the actual government spending data of Dublin, by presenting the proportion of spending for each category relative to the total expenditure. Although this information is interesting in itself, it does not help to understand whether spending is high or low.
To provide more context to Dublin’s government spending data, we create a comparison of Dublin’s spending against two similar, but fictional, cities (reference city A and reference city B). This comparison reveals that Dublin allocates a relatively large part of its budget to public lighting. This kind of benchmarking will not directly tell us where Dublin spends too much or too little but can give us hints as regards what to investigate further.
Decision-making
The third and last step of the use case aims to build a solution for data-informed decision-making on public lighting related to expected traffic levels. We used three open-source tools available on the BDTI to build this solution. Thanks to this combination of tools, we can build a solution that supports civil servants in achieving savings on public lighting.
To reach a solution, we first trained a machine-learning model that predicts traffic for the upcoming week. The tool used for it can be applied to data science, statistical modelling and more. The machine-learning model that we built uses weather data and traffic data, requiring the processing of large volumes of data. The BDTI is intended for processing big data, so it will support you in processing very large datasets such as these.
After training and running the machine-learning model, the output data is stored to create a dashboard. The dashboard allows users to analyse savings that result from turning off public lighting when light is least needed. To determine when and where lighting is least needed, we used the predicted traffic levels as a proxy for activity in a street. The lower the activity in a street, the less need there is for lighting.
Conclusion
This data story delved into a use case that shows an example of how the BDTI’s capabilities and tools can be applied to create valuable insights from (open) data. The examples demonstrate that the BDTI platform offers a variety of tools, which can be used by people with different levels of data skills. For example, the data ingestion and visualisation examples do not require any coding skills, whereas the traffic prediction requires a certain level of data science skills. More example use cases or real-life success stories are accessible via the BDTI website.
Are you a civil servant interested in developing your own use case on the BDTI? Apply for a BDTI pilot project here, or reach out to the BDTI team via EC-BDTI-PILOTS@ec.europa.eu.
Methodological notes
The documentation regarding the ‘government spending’ use case can be accessed on the European Commission’s GitLab. The documentation includes the user guides and scripts needed to replicate the use case, as well as the details regarding the (open) datasets used.
