Leisure in Europe: Insights from open data
Open data reveals patterns of dining out, cultural participation and seasonal travel in Europe
Leisure, culture and tourism are central to life across Europe – especially during the warmer months, when cafés fill up, festivals take over city squares and millions set off on holiday.
This data story uses open data to explore how dining out, participating in cultural activities and seasonal travel shape everyday life and mobility across Europe. While much of the data reflects annual behaviour, it highlights activities that become particularly visible or intensified during the summer season.
How Europeans spend on restaurants, cafés and takeaway
Dining out is a popular way to spend time with family and friends across Europe. But how much do people actually spend on it?
Figure 1 shows the average share of household spending allocated to dining out across EU Member States and thus offers insight into how central dining out is to daily life in different countries. The regional groupings of countries used here are based purely on geographic location and follow the classification system set out in the European Commission’s multilingual thesaurus (Eurovoc). These categories are used for statistical and analytical purposes and do not reflect any political or institutional divisions.
On average, 6.7 % of household budgets in the EU go towards dining out – but this share varies widely between countries. Ireland tops the ranking at 13.8 %, followed by Spain (12.7 %) and Malta (12.2 %). These countries allocate a relatively large share of their household spending to dining out, reflecting its strong presence in everyday life. At the other end of the spectrum, households in Romania spend only 2.8 %, in Poland 3.1 % and in Germany 4.1 %. These differences suggest that the role of dining out in everyday life varies significantly and might be shaped by cultural habits, income levels and lifestyle preferences.
Looking more closely, the pattern does not follow a simple geographical logic. Neighbouring Member States, such as Germany (4.1 %) and Austria (9.7 %), show notably different spending levels, with Austrians spending more than twice as much on dining out on average. This highlights how national preferences and economic contexts can outweigh geographical proximity.
Similar differences emerge in how people engage in culture and entertainment, as we will see in the next section.
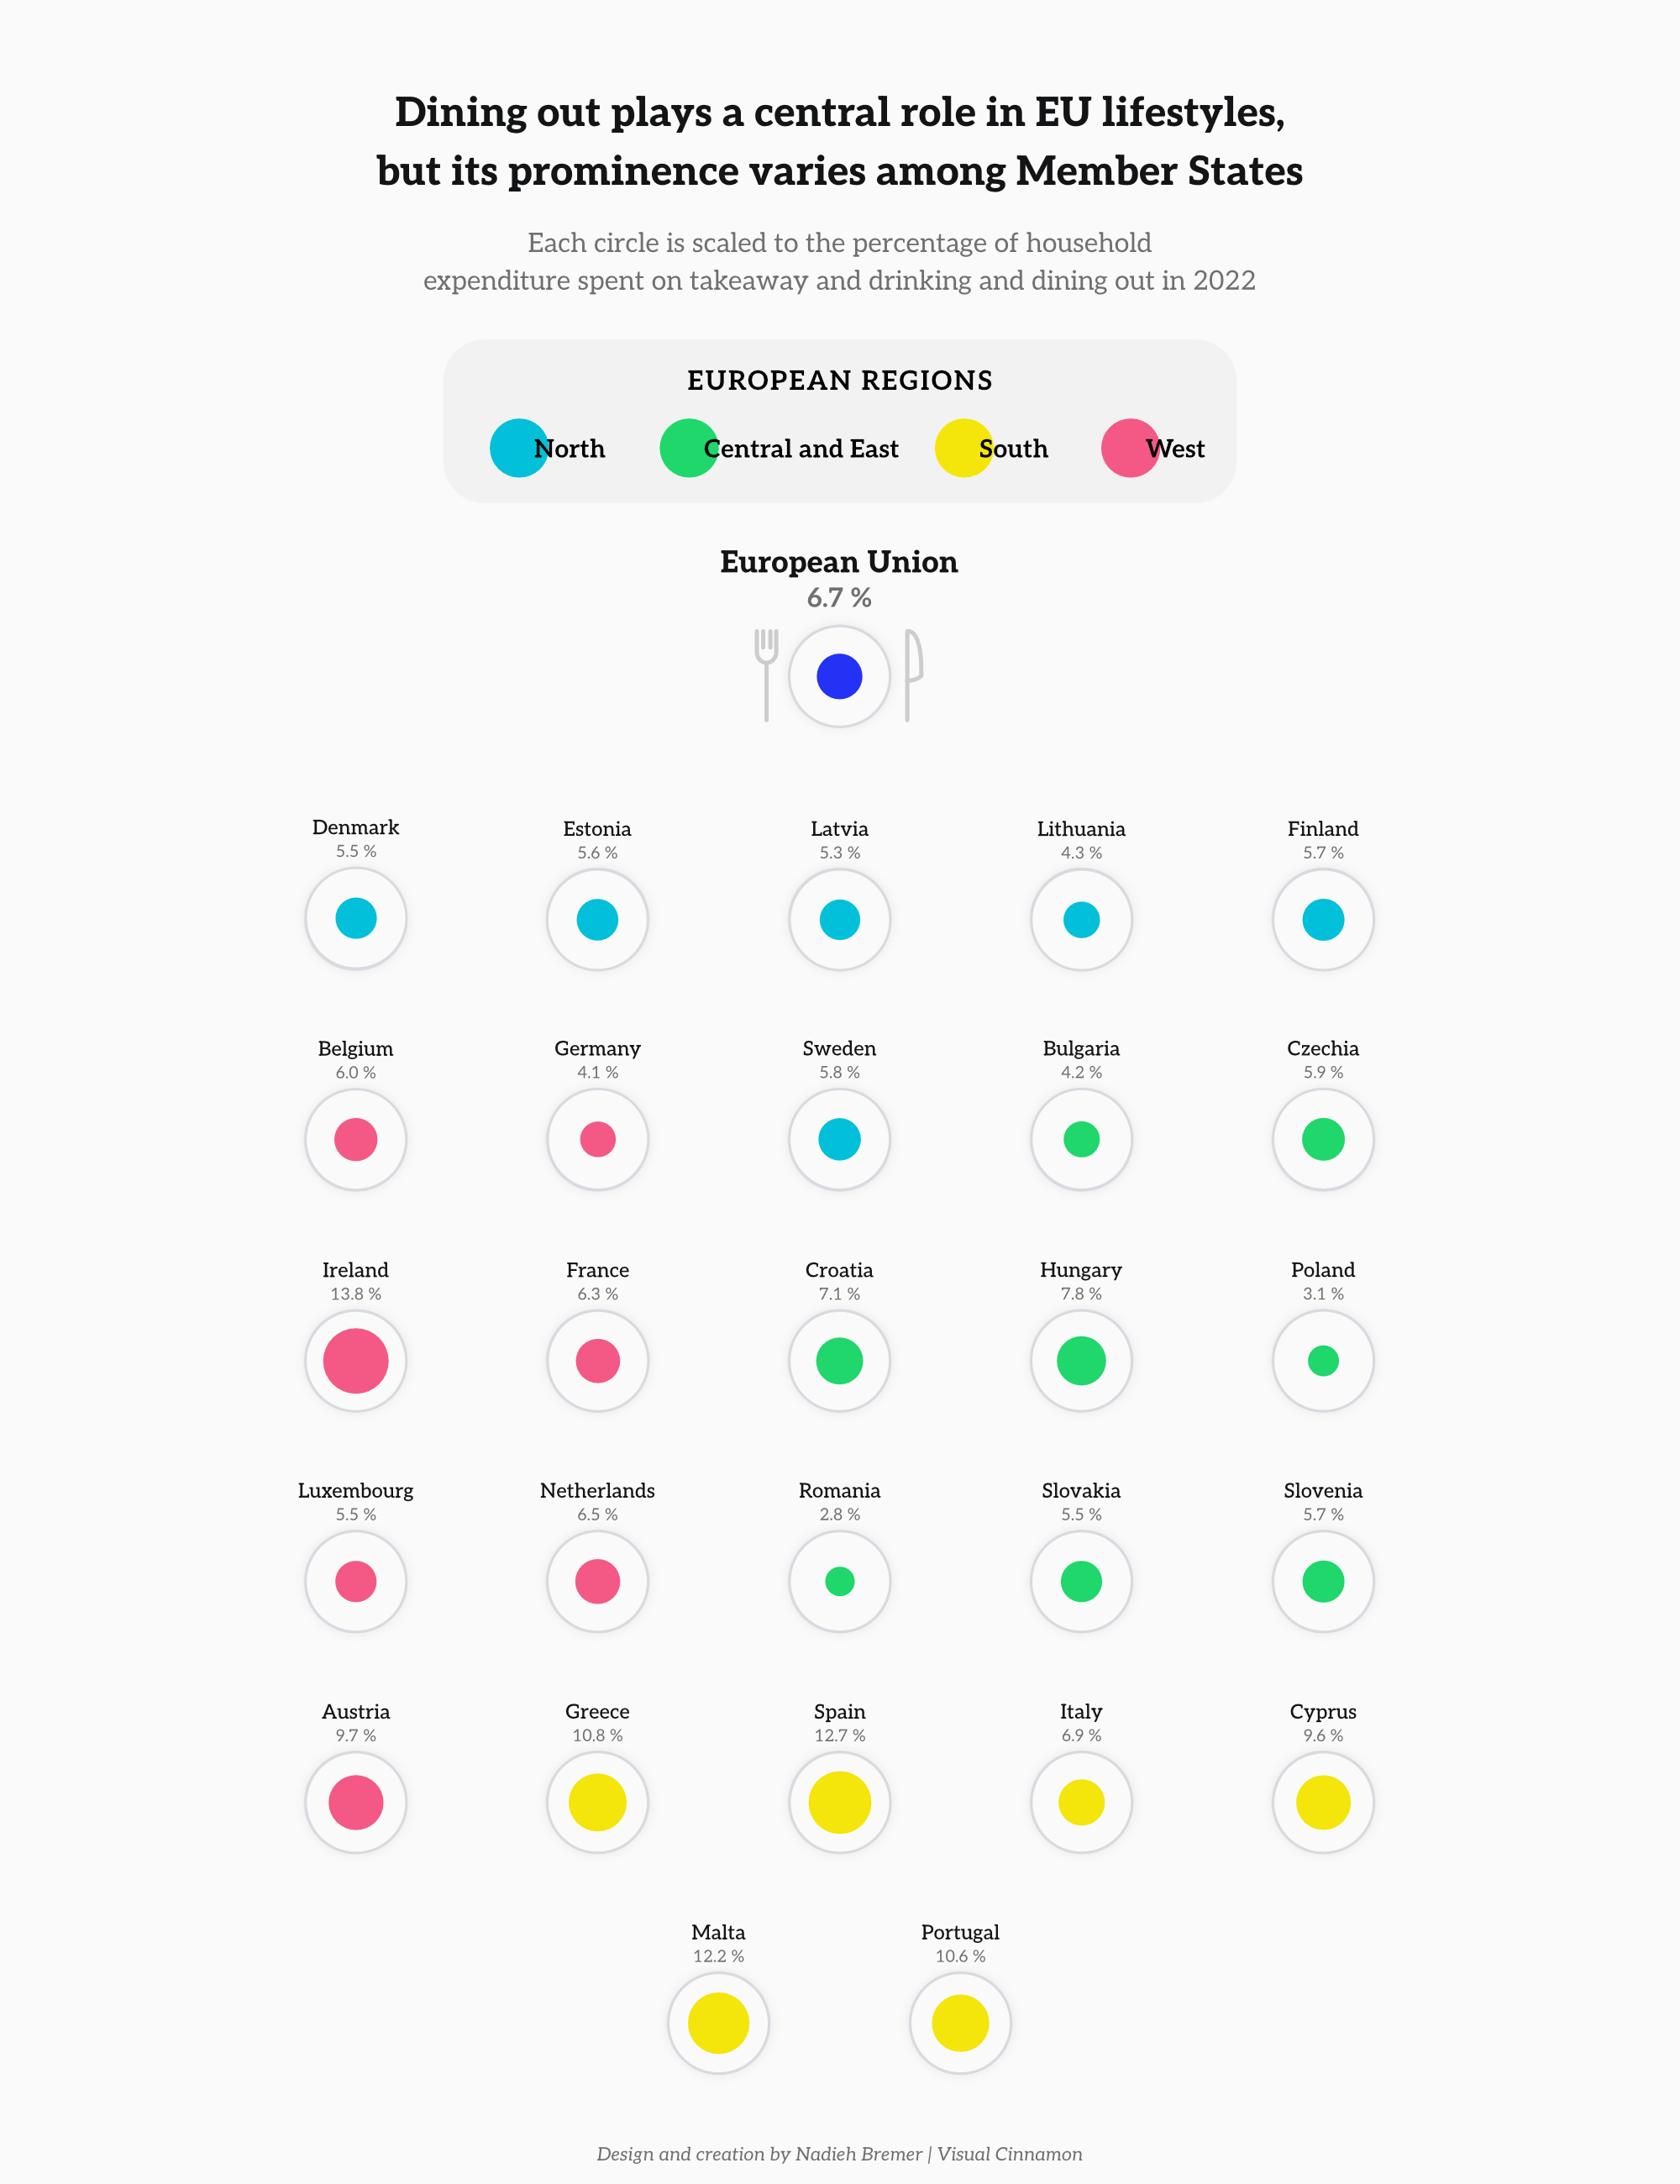
Figure 1: Share of household expenditure allocated to dining out across the EU, 2022
Source: Eurostat/data.europa.eu
Joining the crowd: how Europeans engage in culture and sport
From music festivals to cinema screenings and sports events, culture and sport play a significant role in leisure time across Europe. The data presented here reflects annual participation in a wide range of such activities.
Figure 2 compares how often people in different Member States attended cultural sites, live performances, sports events or cinema screenings in 2022. The results show significant differences among Member States – both in overall participation and in preferences for specific types of events.
Denmark, Luxembourg and Finland consistently report some of the highest participation rates, reflecting widespread involvement in cultural and sporting life. In contrast, countries such as Bulgaria and Romania report lower overall attendance, which may be linked to factors such as limited access to venues, limited affordability or alternative ways of spending leisure time.
Certain Member States also display clear preferences for specific activities. Ireland leads in sports event attendance (40 %), while citizens in Italy and Poland report higher cinema attendance (28 % and 38 %, respectively). Latvia shows high interest in cultural sites (31 %), while Cyprus stands out for live performances, which represent the most-attended cultural activity in the country (27 %). These patterns suggest that cultural engagement takes many forms and might be shaped by local traditions, interests and opportunities.
Figure 2 highlights how cultural preferences differ across Europe – offering a glimpse into the diverse ways people spend their leisure time.
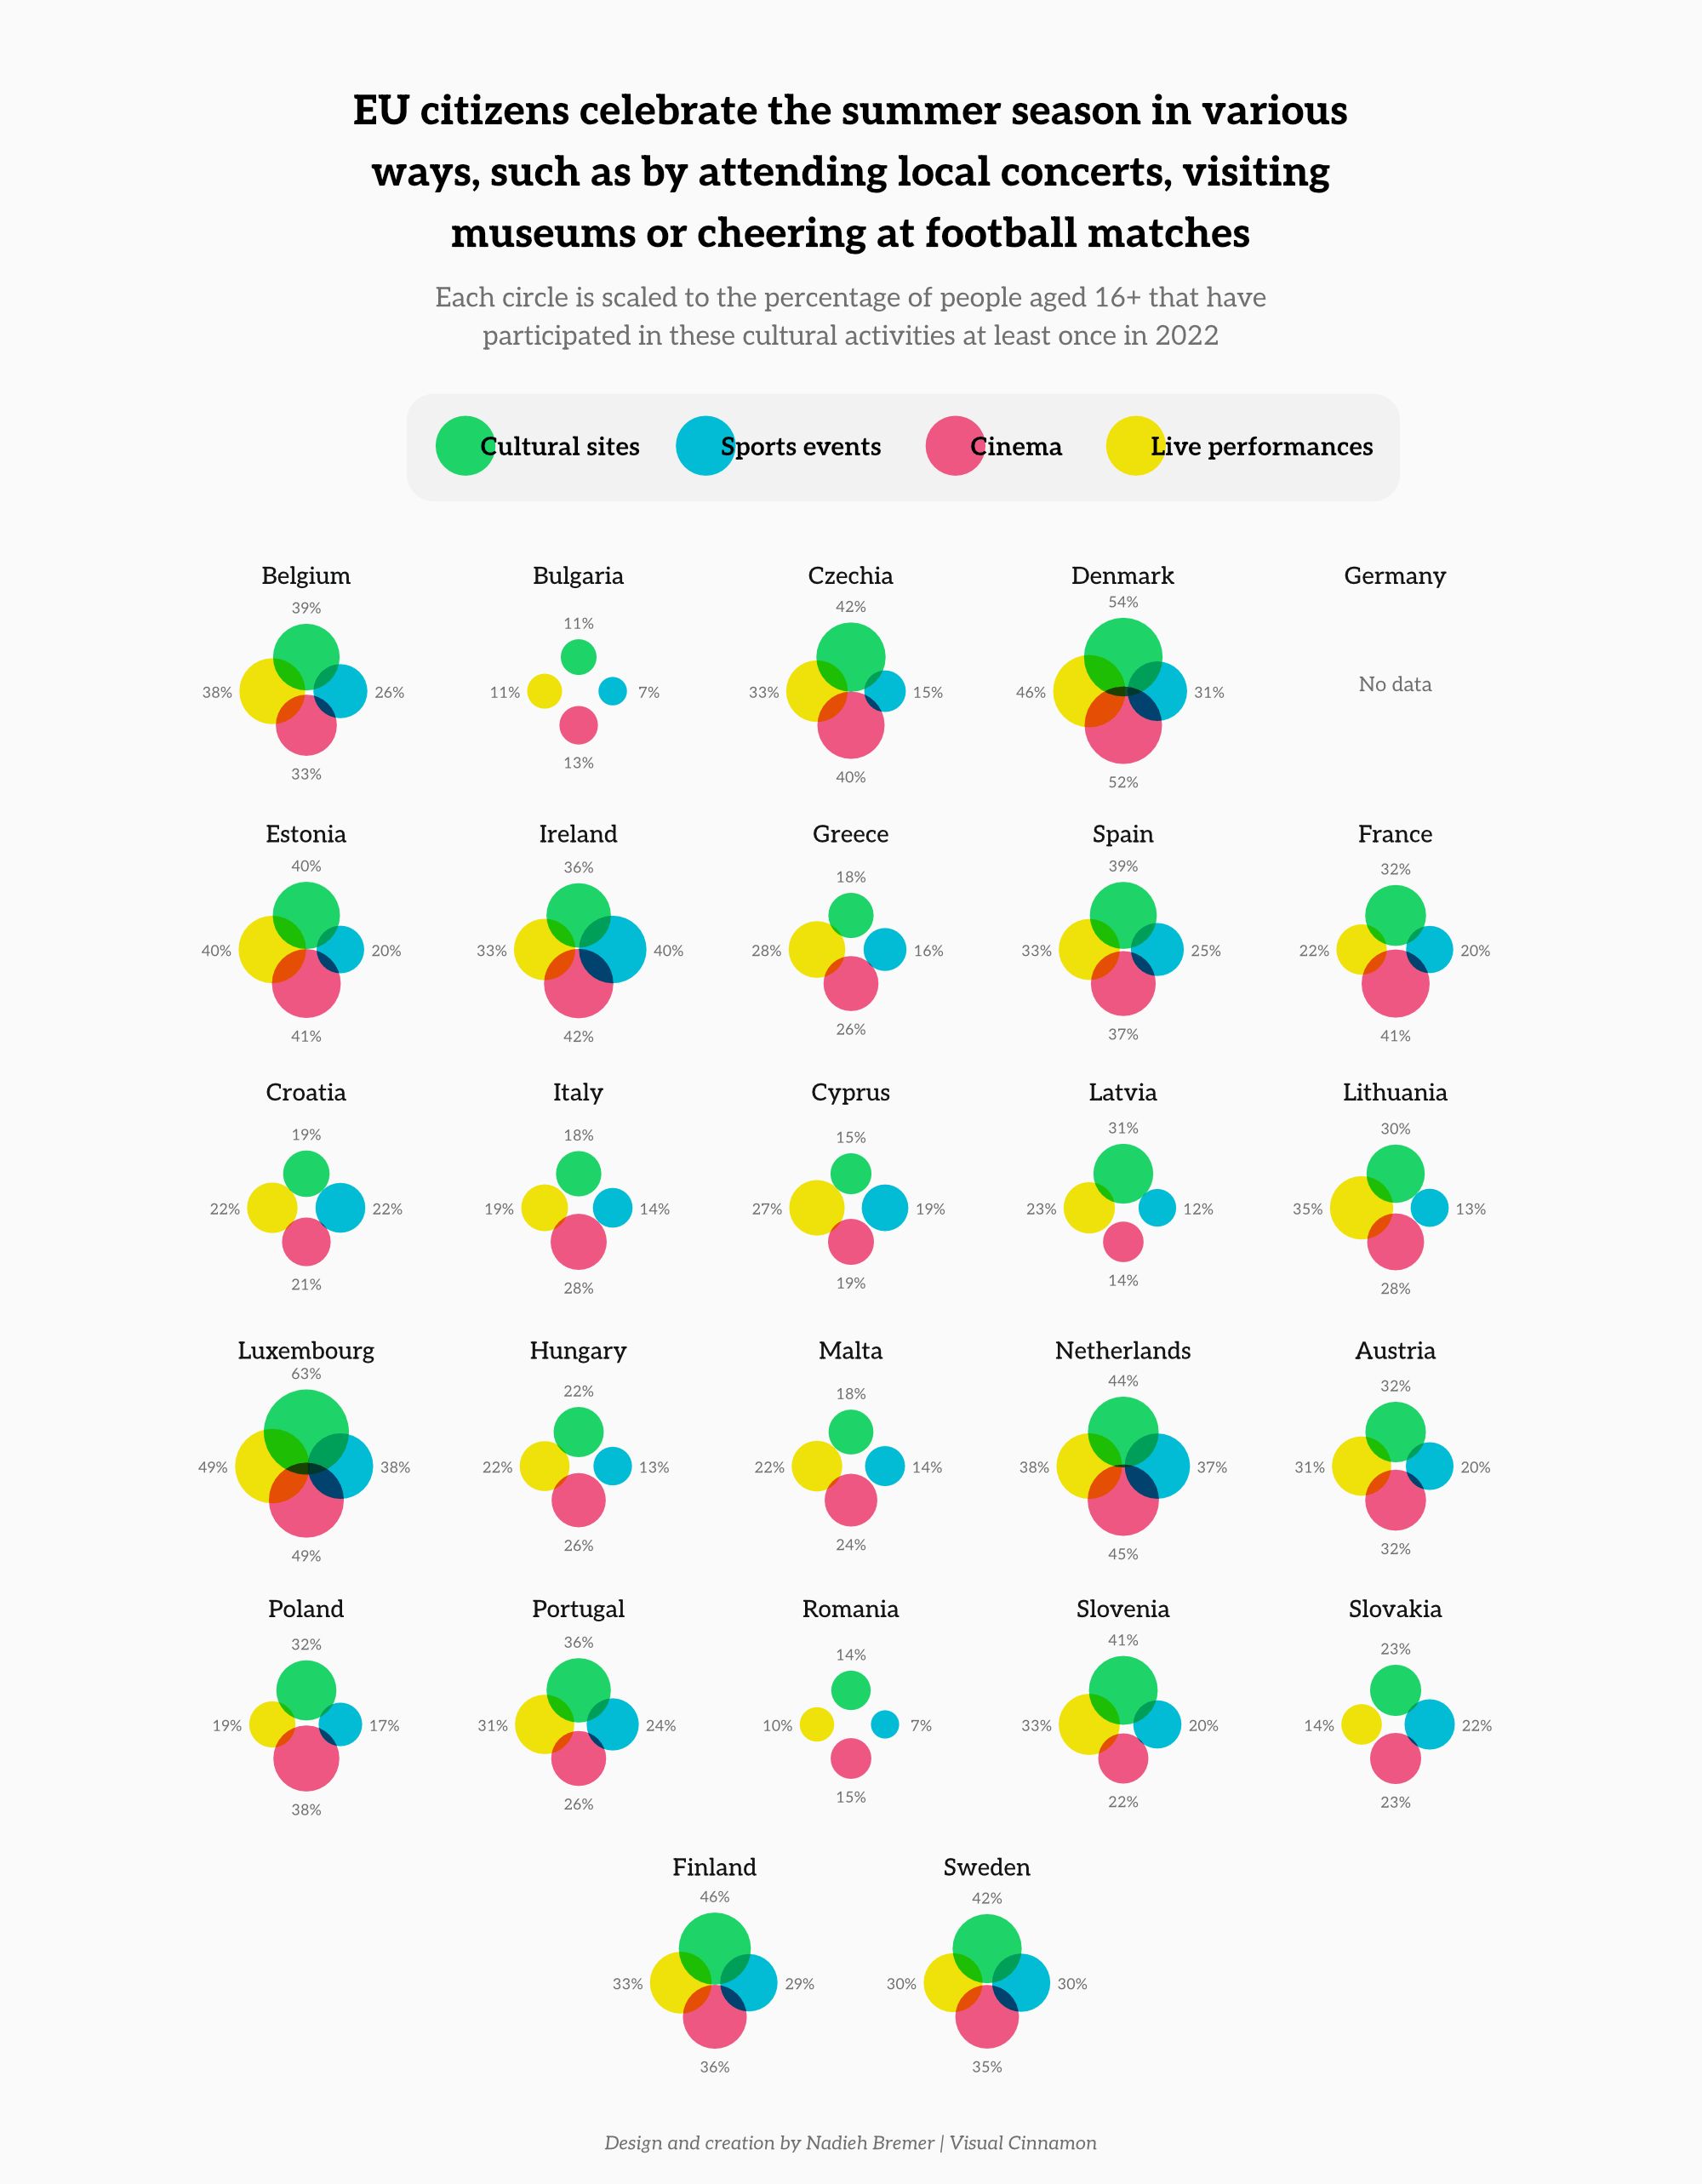
Figure 2: How Europeans engage with culture and sport: participation rates by Member State, 2022
Source: Eurostat/data.europa.eu
Summer travel peaks: which European regions rely most on the season?
Open tourism data reveals how strongly seasonal travel patterns are across different parts of Europe. By looking at the share of annual overnight stays recorded during the summer months, we can see which regions receive the bulk of their visitors between June and August.
Figure 3 highlights how, especially in coastal regions, tourism is heavily concentrated in the summer. Specifically, along the southern and eastern coasts of Italy, eastern Romania and Bulgaria and coastal Ukraine, the majority of annual guest nights take place in just three months of the year. Similar peaks are visible in Greece, the French Riviera and the southern coastlines of Norway and Sweden.
In contrast, inland and urban regions across central and western Europe tend to see more balanced tourism throughout the year. In these areas, summer accounts for 20 % to 50 % of total overnight stays – with a less pronounced seasonal peak.
Interestingly, Spain – the Member State with the highest total number of international tourists – sees a smaller share of its tourism concentrated in the summer. This suggests a more year-round appeal, supported by its varied climate and diverse travel offerings.
These patterns highlight the varied character of European tourism. In some regions, summer is the defining travel season, driving local economies and shaping infrastructure. In others, tourism is more evenly spread, offering year-round opportunities to explore.
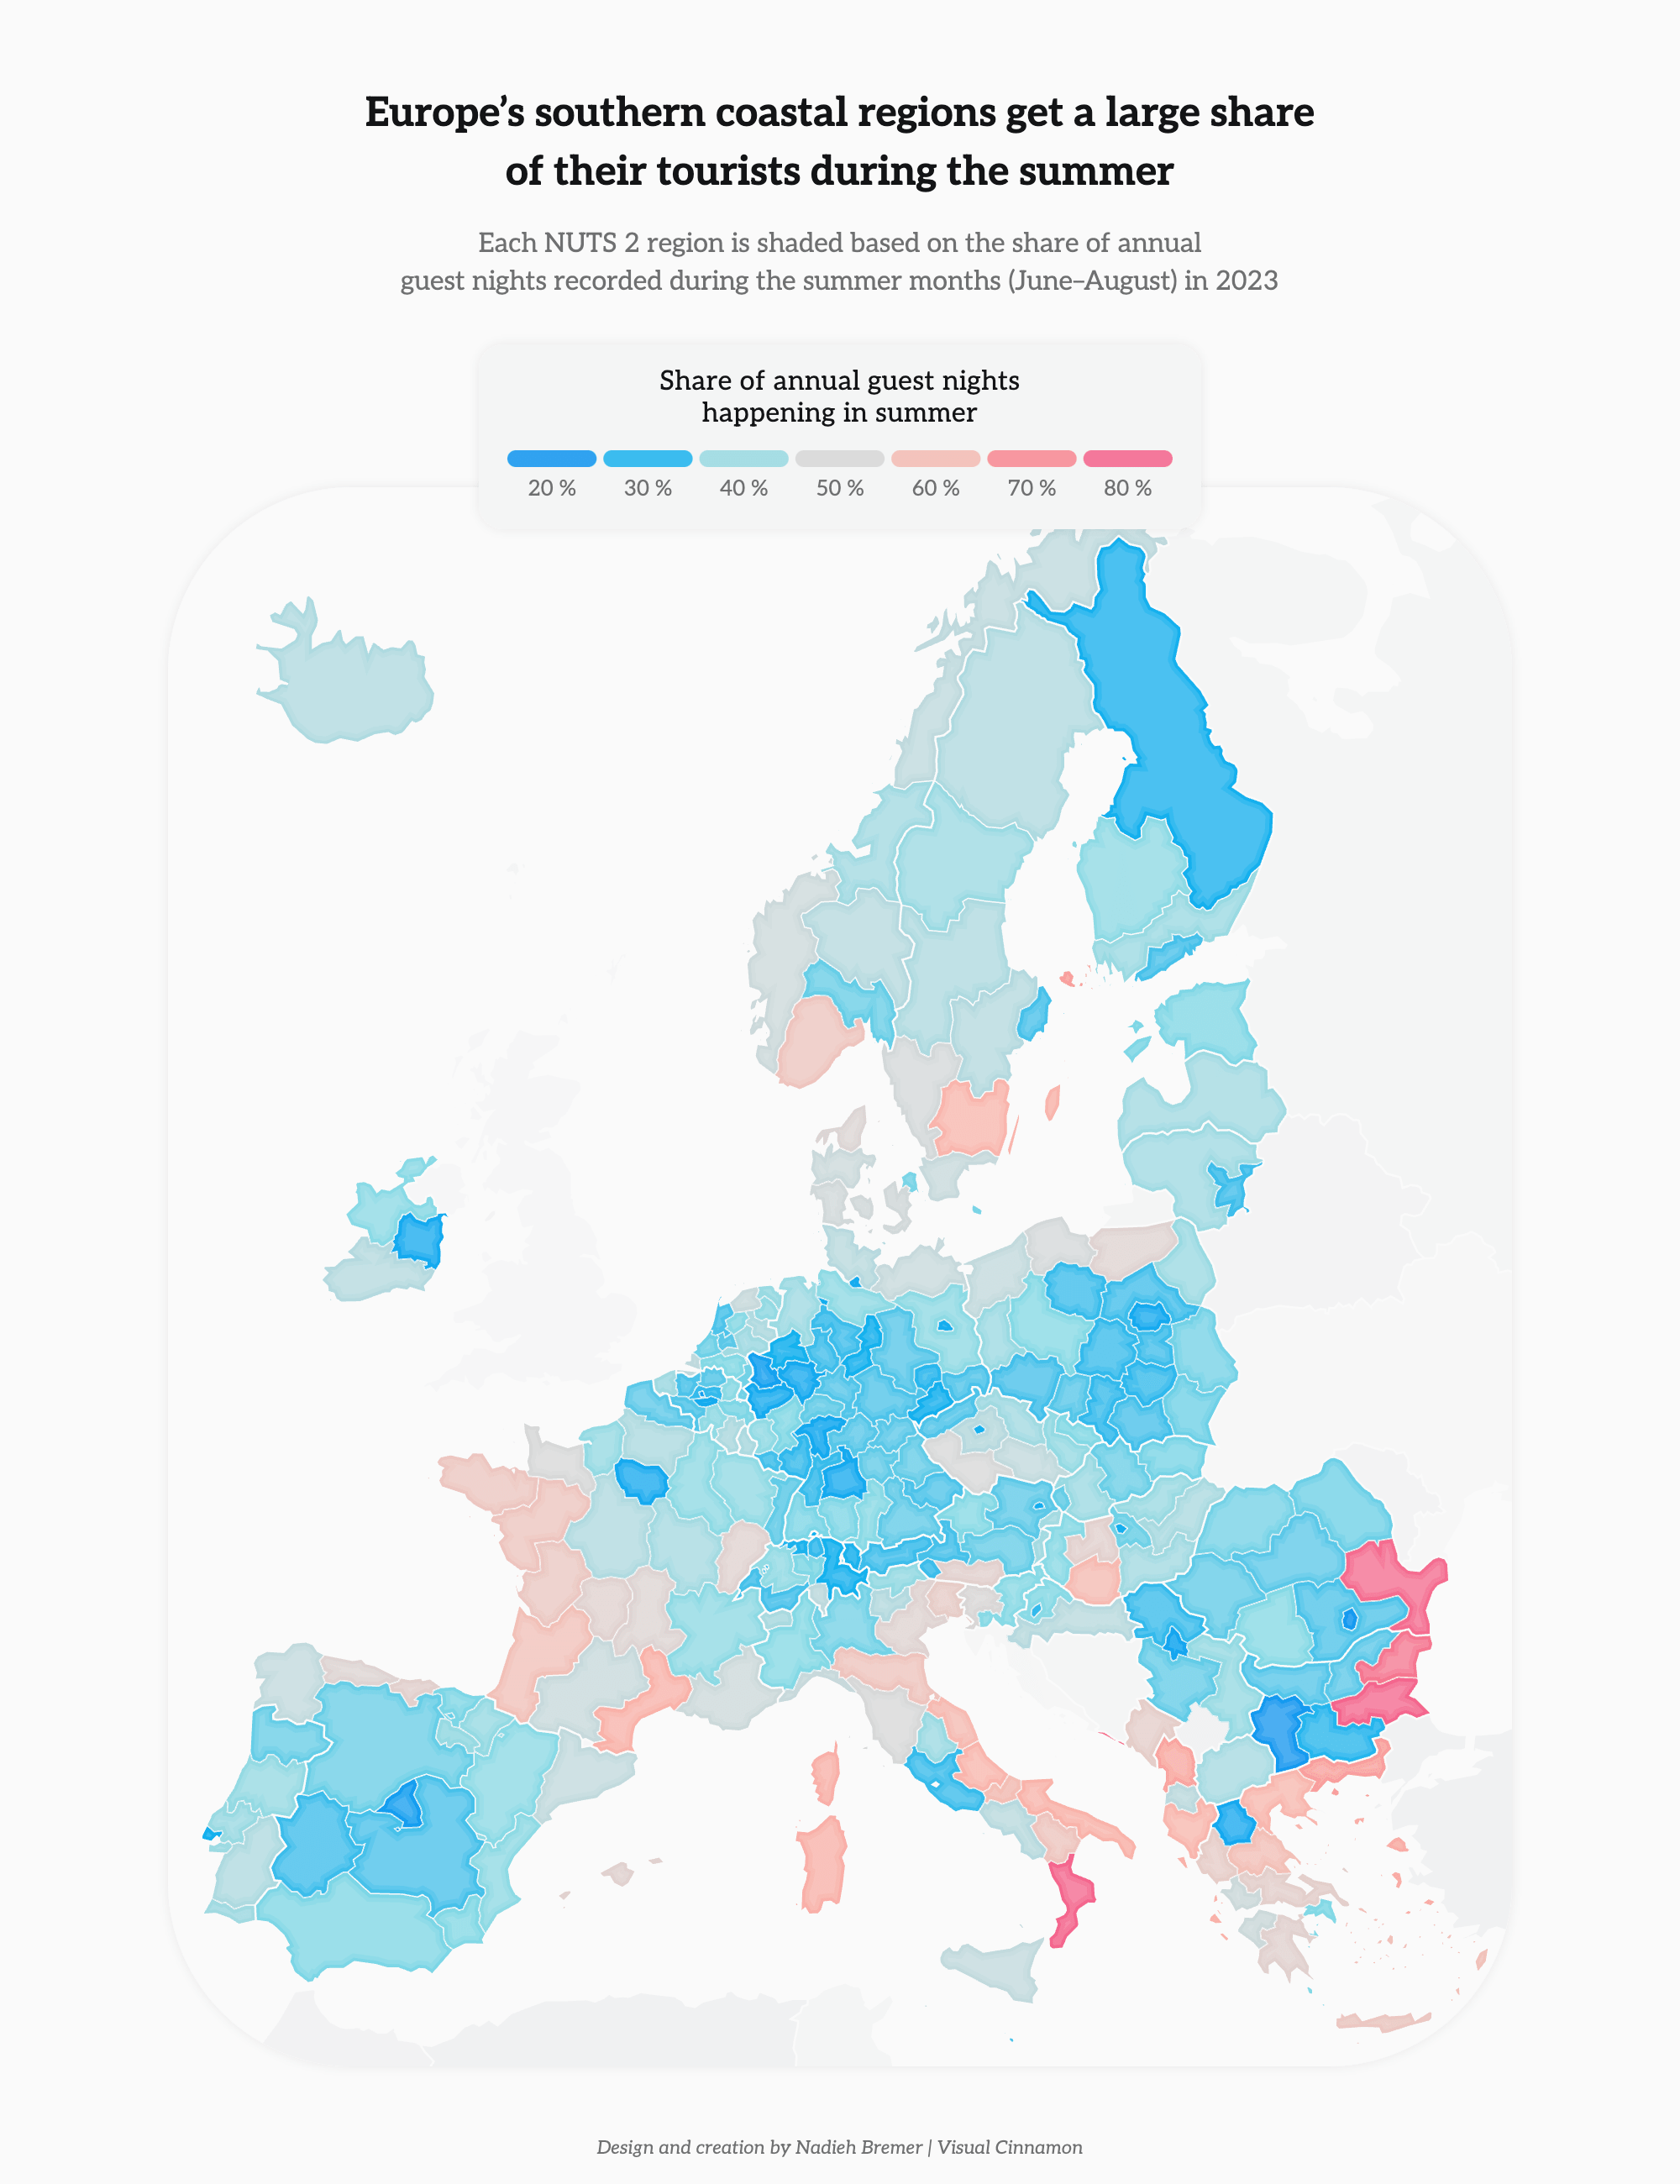
Figure 3: Share of annual guest nights recorded during the summer months (June–August), 2023
Source: Eurostat/data.europa.eu
Conclusion
This data story shows how participation in and spending on specific leisure activities vary across Europe. The differences between countries and regions are striking: in some places, people spend more than four times as much on food services as others, and similarly large disparities exist in cultural and sporting participation. Moreover, while some regions rely heavily on summer tourism, others attract visitors all year round.
These patterns highlight the many factors that shape leisure across Europe – and the value of open data in revealing key differences. Continued access to timely, comparable data helps not only to describe lifestyles, but also to inform decisions in areas such as tourism, infrastructure and cultural policy.
To explore more insights like these, visit data.europa.eu and see how open data brings Europe’s diversity to life.