The shift to digital payments: Understanding payment behaviour through open data
Exploring payment trends, preferences and barriers across the euro area
Do you still mostly pay with cash or has your phone replaced your wallet?
Regardless of your answer, across Europe, digital payments are becoming an everyday reality. Offering speed, convenience and new ways to transact, they are reshaping how people buy goods and services. However, the shift away from cash is not happening at the same pace everywhere. Adoption rates vary widely between countries, age groups and income levels.
To guide this transformation, the European Union has launched key policy initiatives such as the digital finance strategy and the retail payments strategy. These aim to promote a secure, inclusive and innovative digital payment ecosystem across Europe.
But how do Europeans pay today and what shapes their choices? Using data from the study on the payment attitudes of consumers in the euro area, published by the European Central Bank, this data story explores the evolving digital payment landscape across the euro area. It examines how people pay, what shapes their choices and where barriers to adoption remain.
How are payment habits shifting in the euro area?
To understand how payment habits are evolving, we begin by looking at how people pay at physical points of sale and how this behaviour has changed over time.
Figure 1 compares how people in the euro area pay at physical points of sale. Graphs 1A and 1B show a clear shift in payment methods between 2016 and 2024. Over this period, the use of cash steadily declined: its share of transactions fell from 79 % to 52 %, while its share of total value dropped from 54 % to 39 %. At the same time, card payments became more common, rising from 19 % to 39 % of transactions and from 39 % to 45 % of value. Mobile payments, though still a smaller share overall, grew significantly – from less than 1 % to 6 % of transactions and from less than 1 % to 7 % of value.
Graphs 1C and 1D offer a country-level comparison, revealing significant variation among the euro-area countries. The Netherlands leads in non-cash point-of-sale payments, with 78 % of payments made by card or through a mobile application, followed by Finland (72 %) and Luxembourg (63 %). In contrast, cash remains dominant in countries such as Malta, Austria and Slovenia, where more than 60 % of transactions are still conducted in cash. Notably, in nearly every country, non-cash payments account for a larger share of total value than of total transactions, suggesting that higher-value purchases are more likely to be made by card or through a mobile application.
These findings highlight the uneven pace of non-cash payment adoption. While some countries have embraced cards and mobile payments as the norm, others continue to rely more heavily on cash. This reflects a mix of cultural preferences, existing infrastructure and consumer habits.
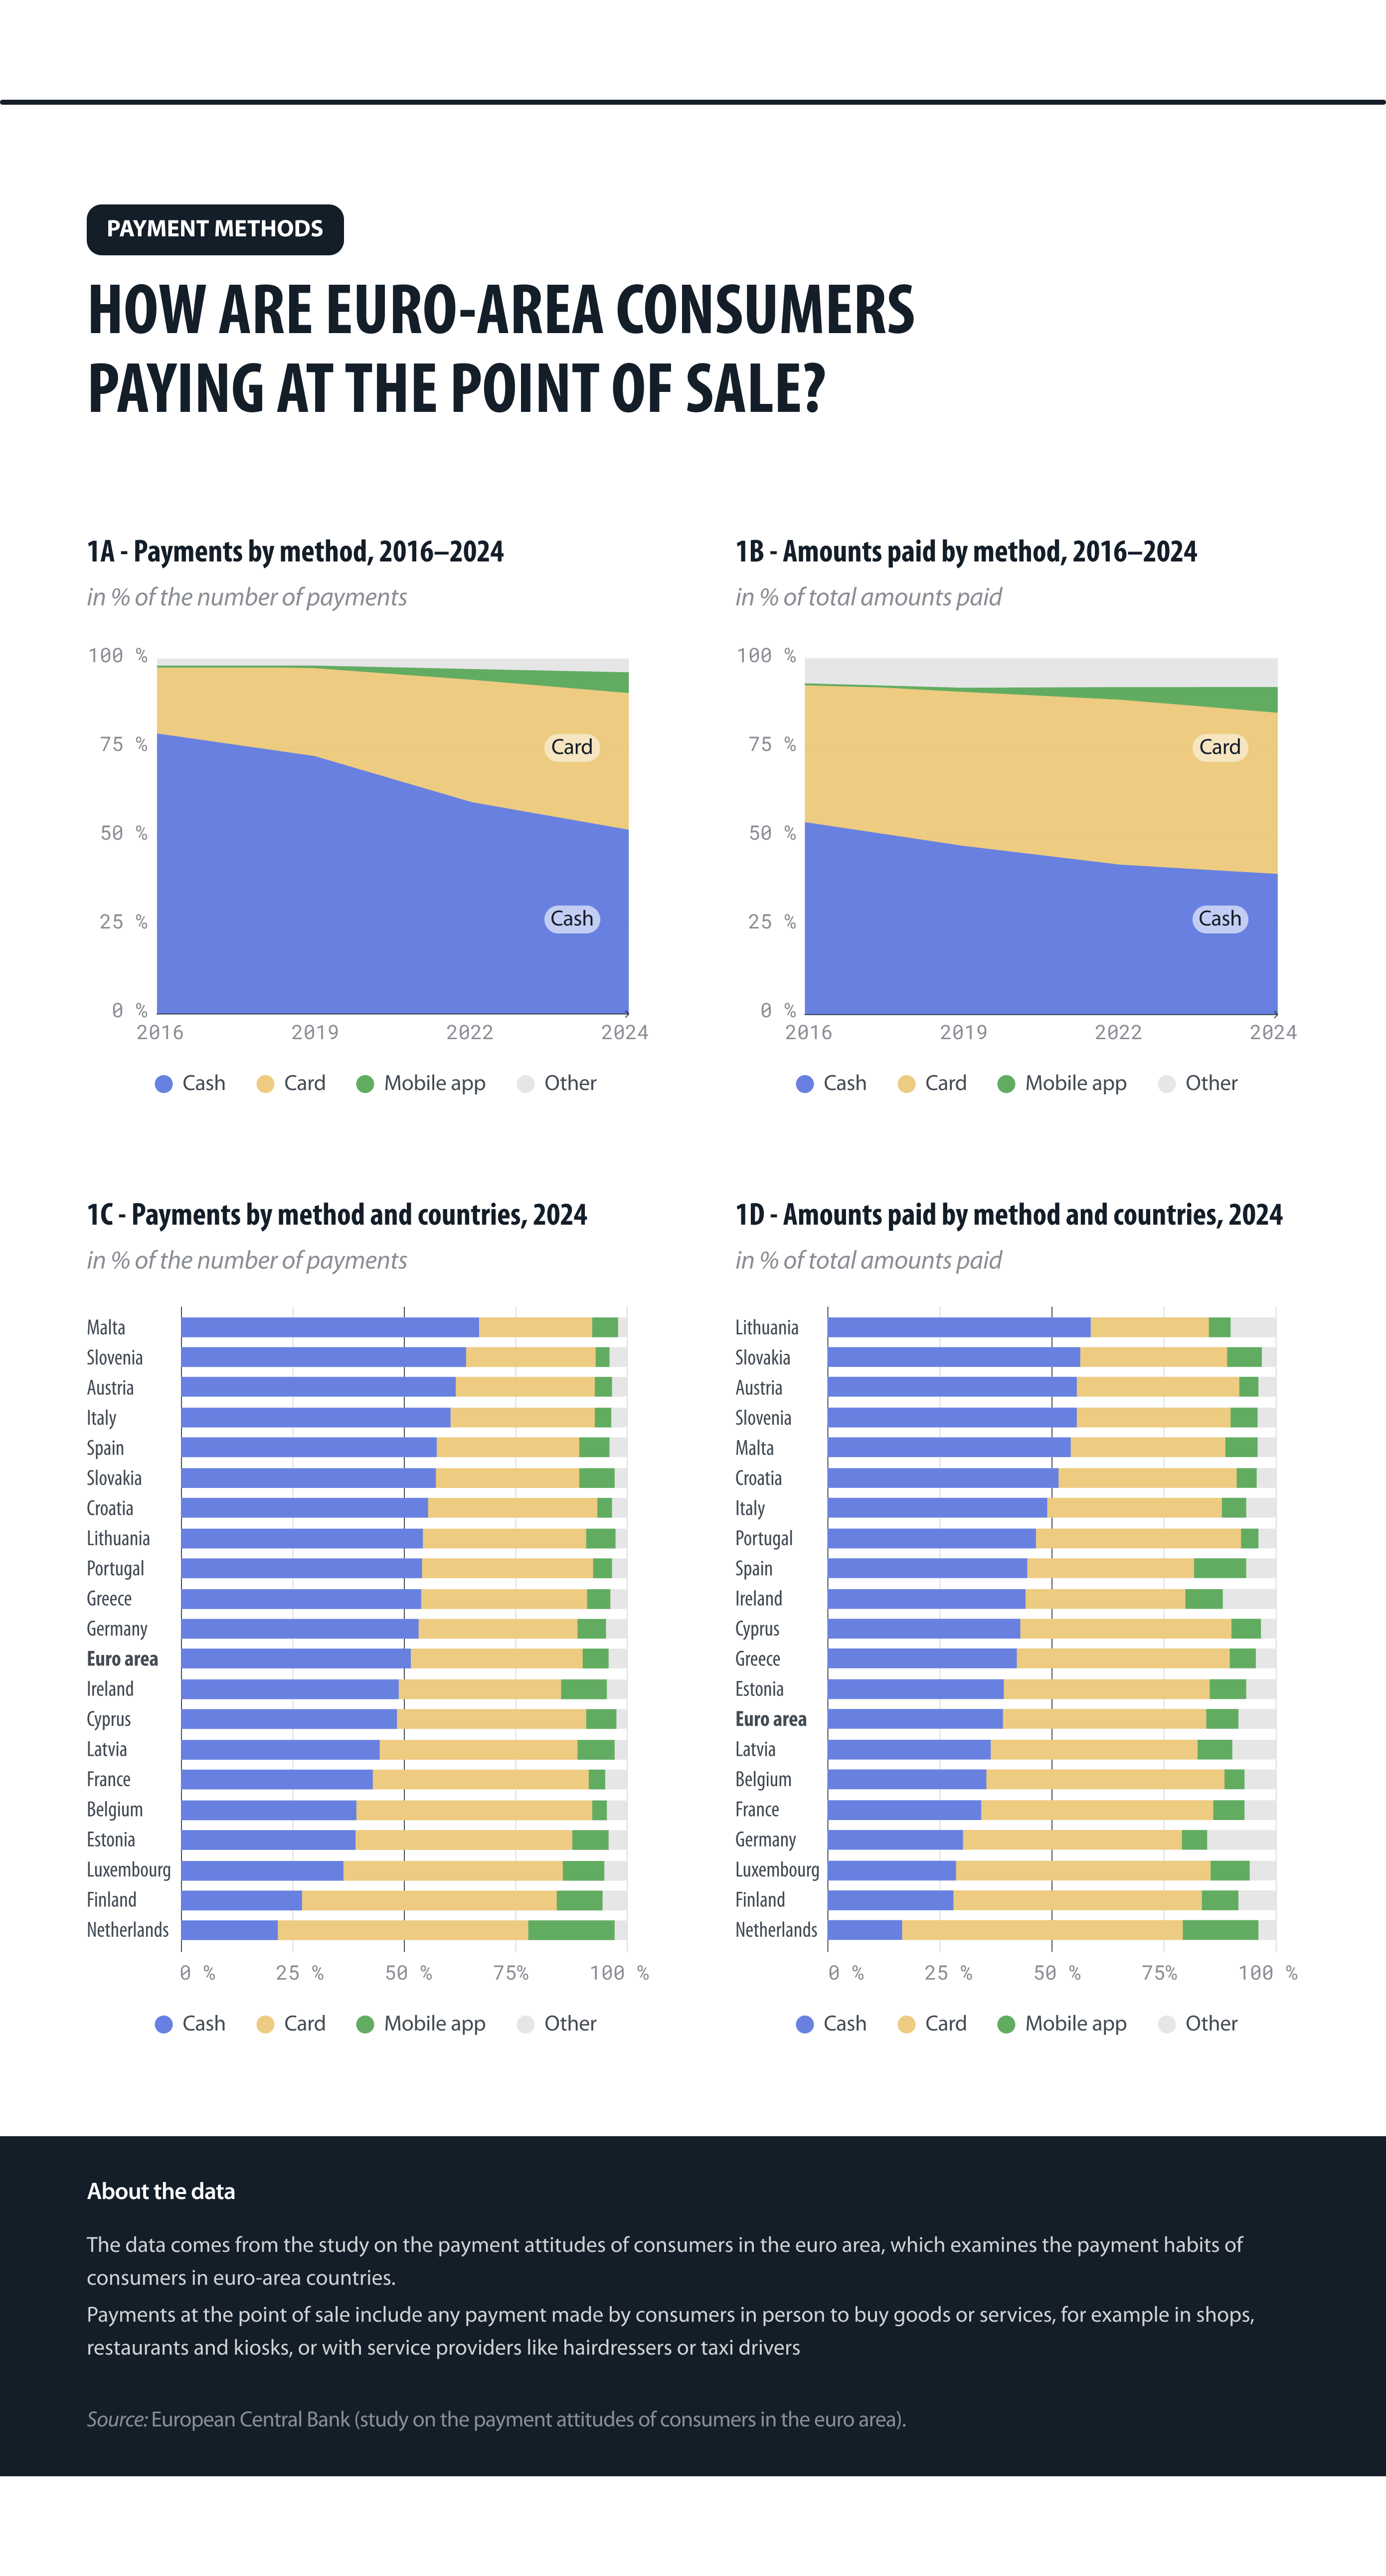
Figure 1: How euro-area consumers are paying at the point of sale
Source: European Central Bank.
What drives payment choices?
Understanding why people choose to pay with cash or card helps explain the uneven pace of non-cash payment adoption across the euro area. While access and infrastructure play a role, payment behaviour is also shaped by other factors, such as convenience, control and privacy.
Figure 2 presents the most commonly cited advantages of each method, based on survey responses. For cash, the strongest factor is privacy: 41 % of respondents value its anonymity. Many also find that using cash makes them more aware of their spending (35 %) or helps them appreciate the fact that a transaction is settled immediately (30 %).
For card payments, not needing to carry physical money (61 %) is the main advantage, followed by the speed of transactions (40 %) and the ease of use (36 %).
Some benefits – such as speed, safety and acceptance – are mentioned for both methods, showing that the distinction is not always clear-cut.
These findings show that while non-cash payments are gaining ground, they do not appeal equally to all citizens. Concerns around privacy and control over spending continue to shape payment choices. Addressing these concerns is a key challenge for policymakers in their effort to build a secure and inclusive digital payment ecosystem, as outlined in the digital finance strategy.
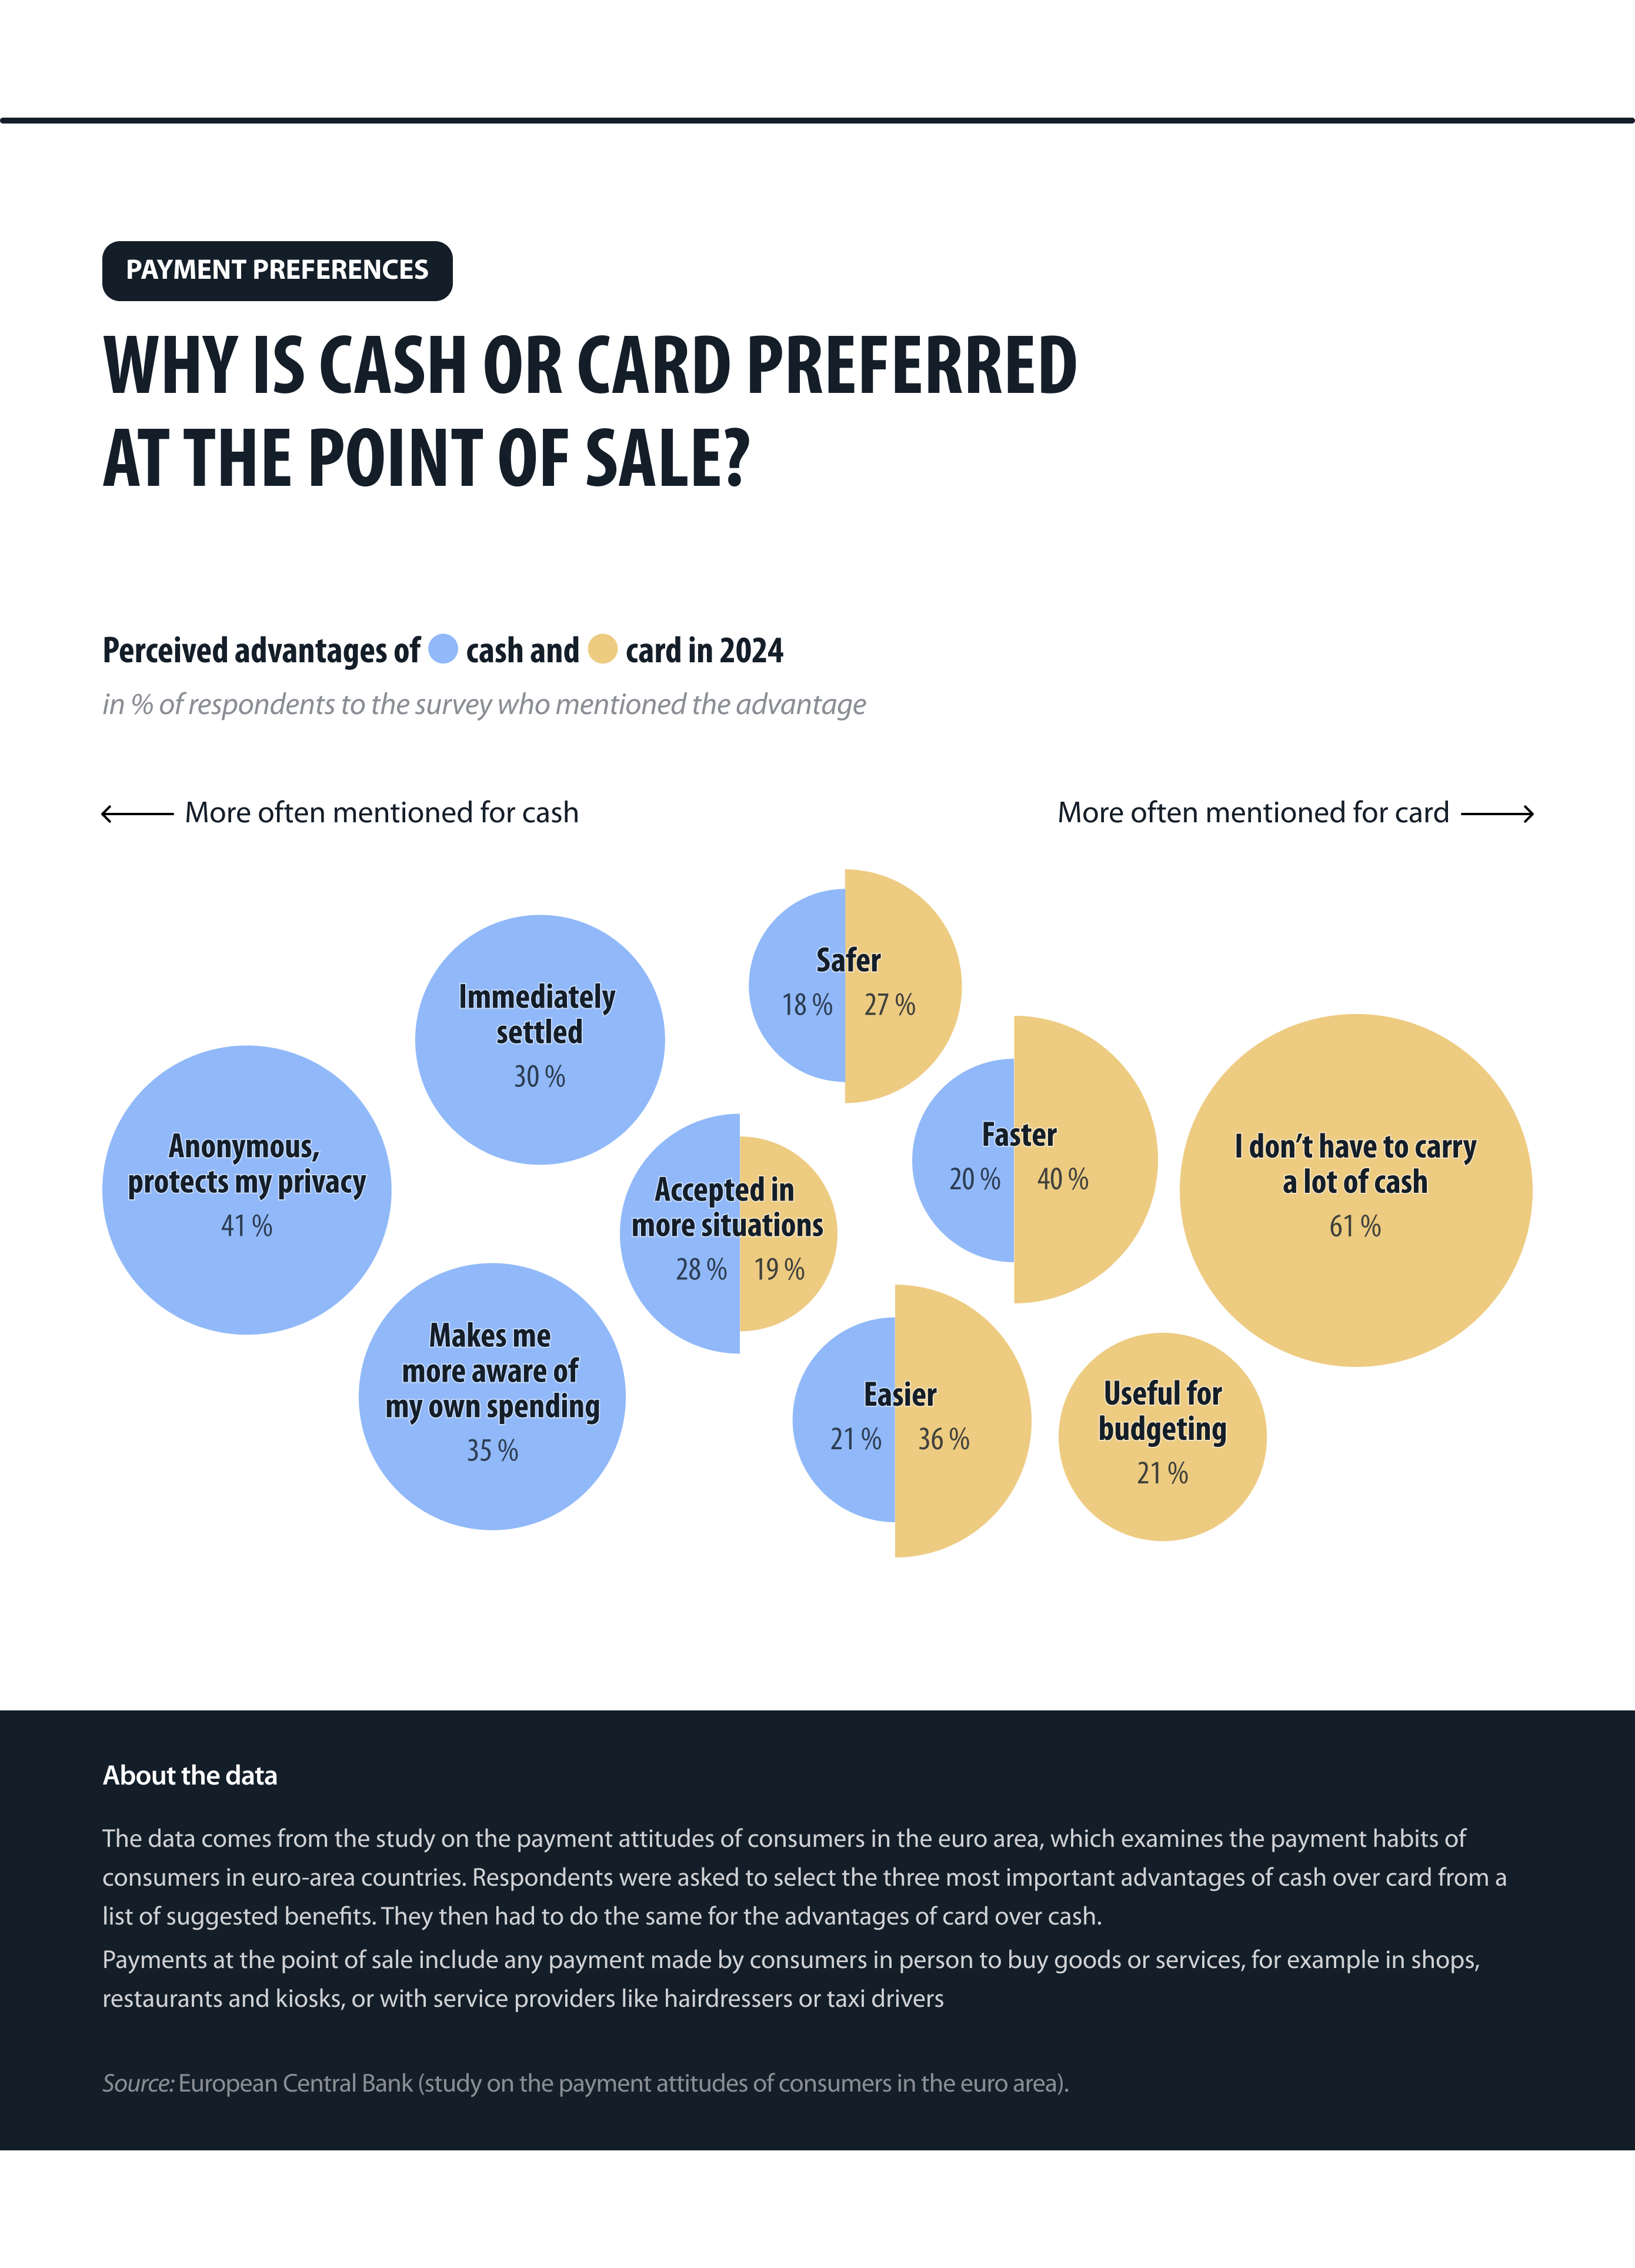
Figure 2: What people like about cash compared with card payments
Source: European Central Bank.
Digital payments are rising in the euro area, and so is the need for support
As digital payments become more common, especially online, not everyone finds them easy to use. Alongside concerns about privacy and convenience, digital skills play a critical role in determining who can confidently navigate digital transactions and who may be left behind.
Figure 3A shows two key trends. Firstly, between 2019 and 2024, the share of payments made online tripled – from 7 % to 21 % of all transactions – while their share of total value doubled from 18 % to 36 %. During the same period, in-person payments at the point of sale declined in both frequency and value, signalling a broader shift towards remote and digital purchasing.
Figure 3B shows which demographic groups are most likely to report needing help with digital payments. Around 9 % of respondents say they require assistance. While gender does not appear to play a significant role, the need is slightly higher among older adults (aged 65+) but also younger adults (aged 18 to 24). Older adults also include many who are least likely to use card, mobile or online payments at all. At the same time, education and income show a clear pattern: the lower their level, the higher the likelihood of requiring assistance.
These findings highlight that access to digital payments alone is not enough; support and skills also matter. As the EU advances its digital agenda, bridging these gaps will be essential. The digital education action plan (2021–2027) is one example of how the EU is helping citizens build the skills needed to participate fully in an increasingly cashless economy.
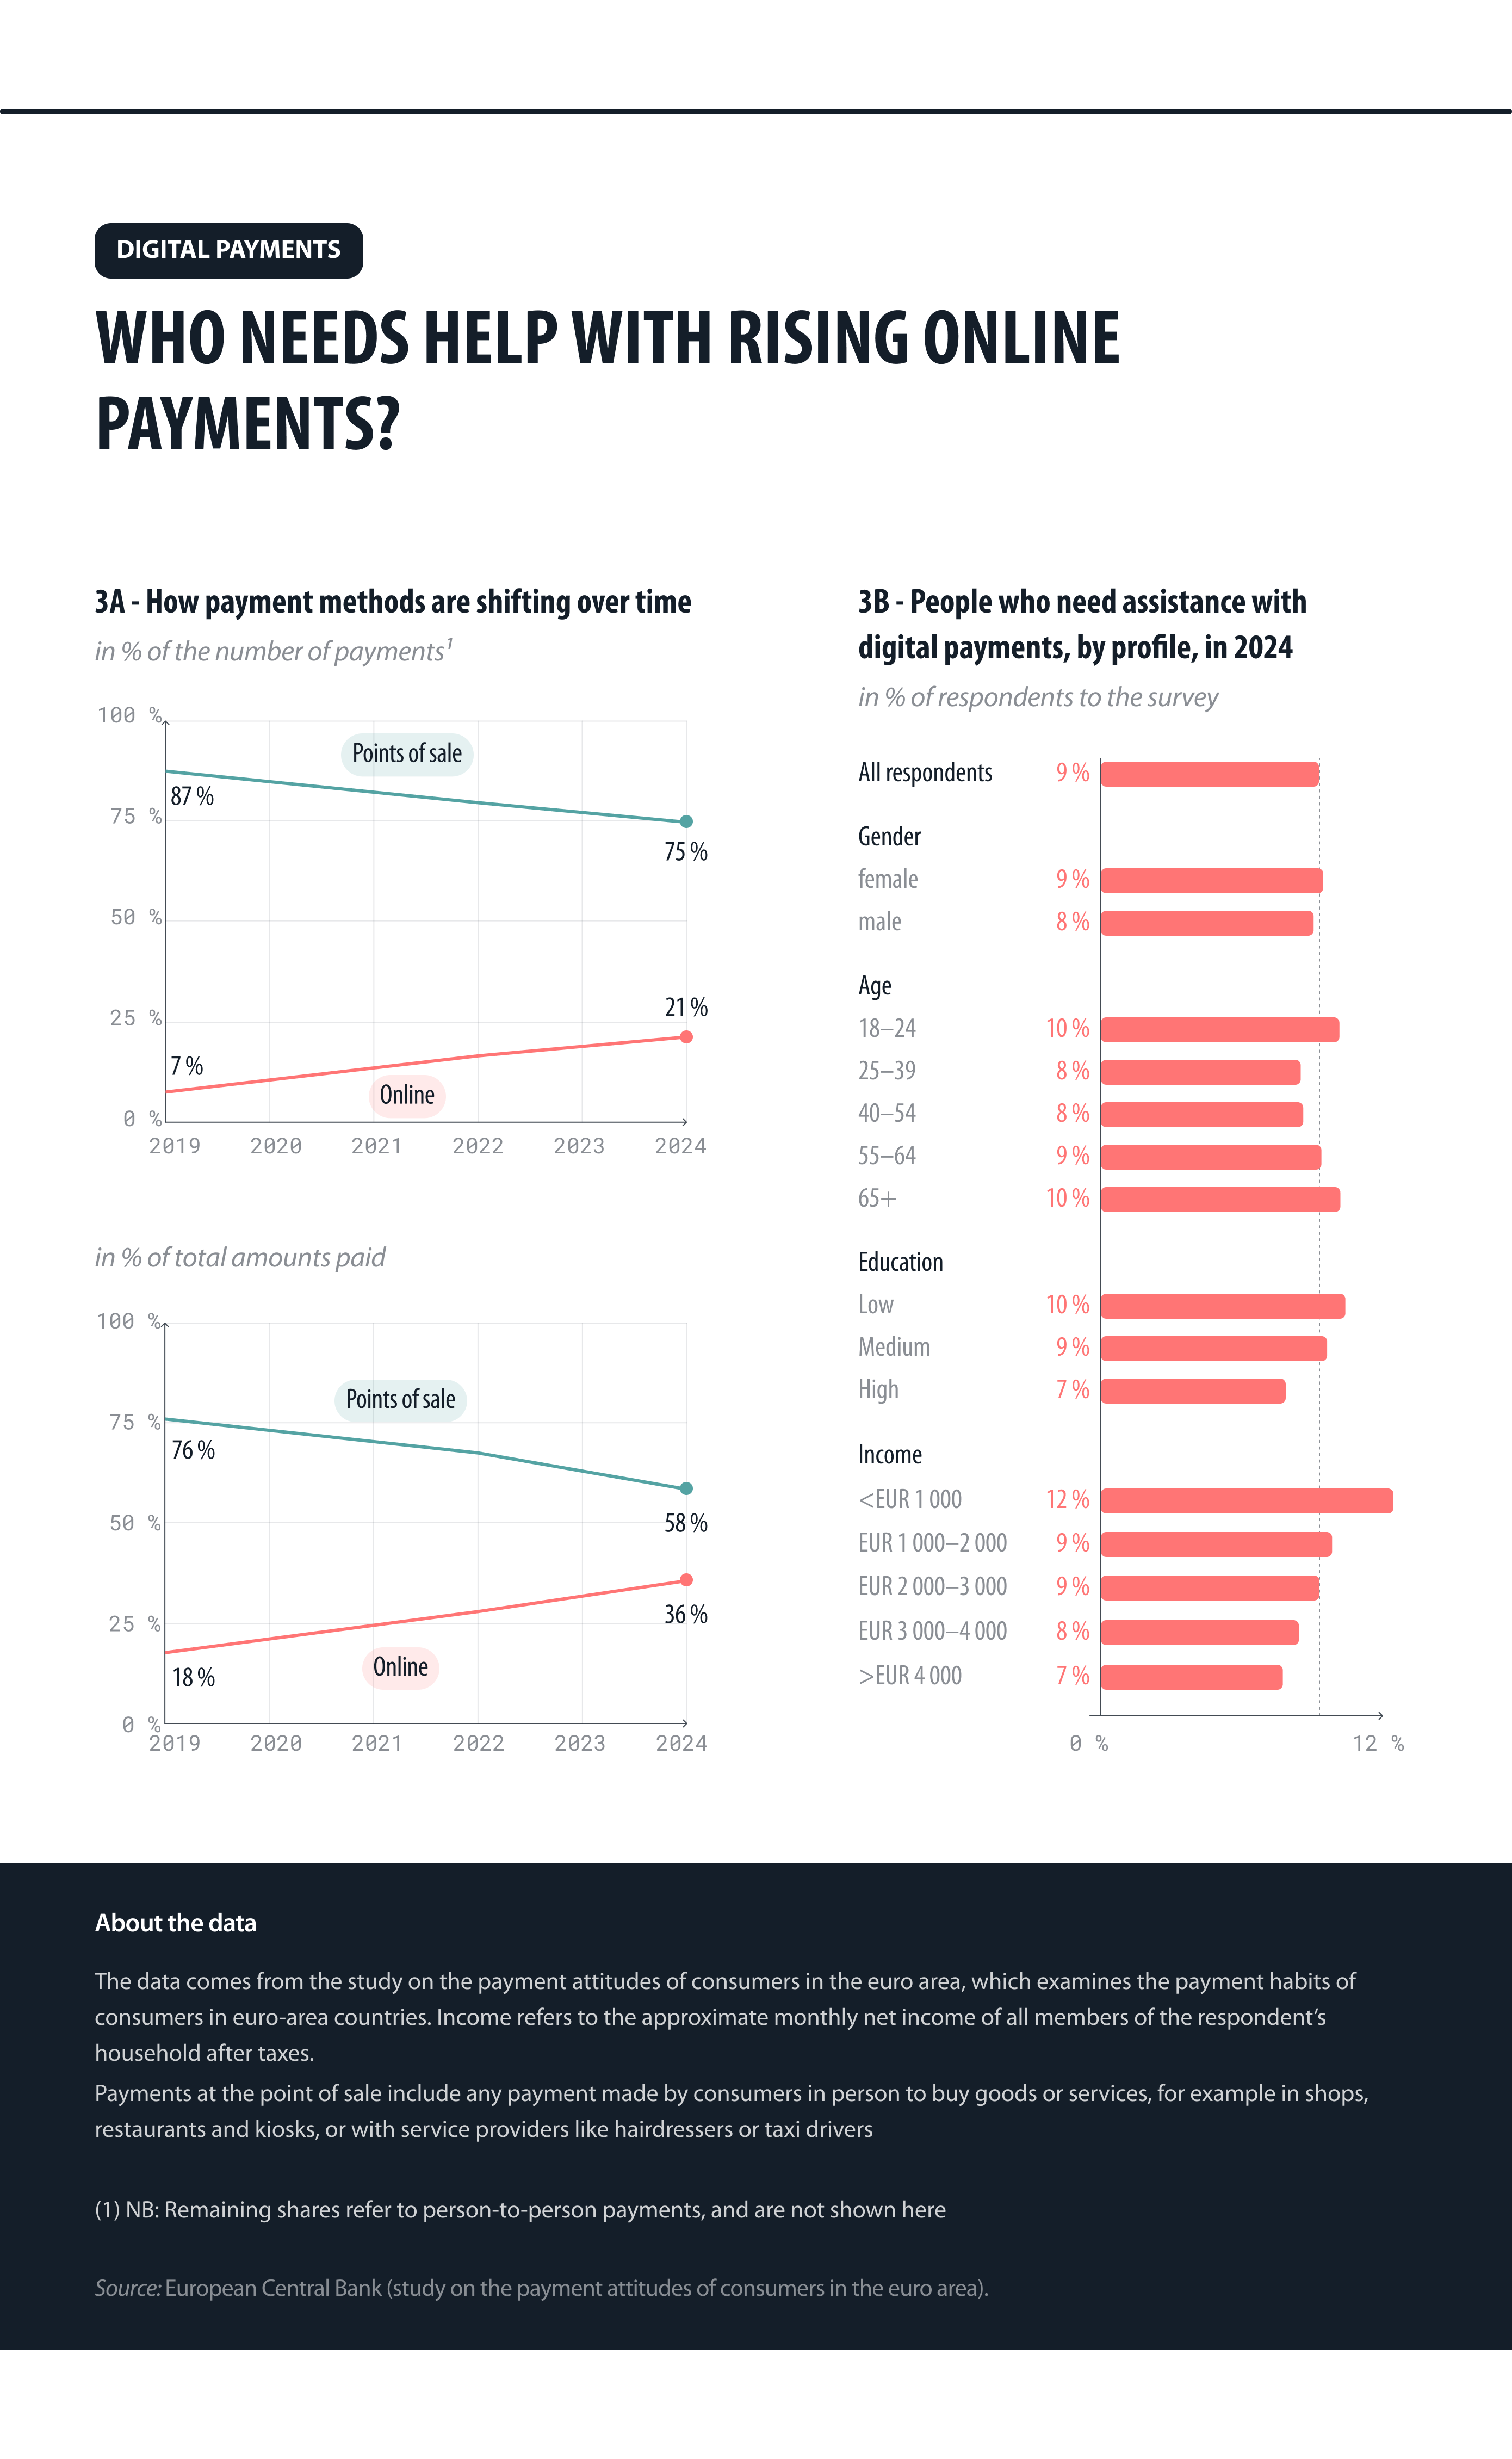
Figure 3: The rise of digital payments and who still needs support
Source: European Central Bank.
Conclusion
Digital payments are becoming the norm across the euro area, but not for everyone and not in the same way all around. While many consumers are embracing cards and mobile applications for their speed and convenience, others still value the control and privacy that cash provides. Patterns vary not only across countries but also across age, income and education levels, reminding us that digital inclusion is not guaranteed.
The insights from this data story highlight two priorities: first, ensuring that digital payment solutions are not only available but also easy to use and trustworthy; and second, closing the digital divide by supporting those who may struggle, particularly older people, younger adults and low-income groups. Open data plays a crucial role in this effort by shedding light on where gaps exist and how we can address them.
To explore more insights like these, visit the European Data Portal and see how open data supports a smarter, more connected and accessible Europe.