Executive summary
The Open Data Maturity Assessment of the Publications Office of the EU and European Commission is a highly recognised and widely known study in the field of open data. It evaluates progress and effectiveness of open data initiatives across four thematic dimensions intended to capture the end-to-end value chain of open data: Policy, Portal, Quality and Impact. The current open data maturity levels group countries into four categories: 1) Beginners, 2) Followers, 3) Fast-trackers, and 4) Trendsetters.
In order to foster more effective peer-to-peer learning, and better deliver tailored communication and support, an explorative profiling and clustering analysis was conducted. Beyond the existing absolute performance groups, profiles help to better understand the open data approaches of countries and how they go about improving open data practices. Macro country clusters help to compare countries that are relatively similar, in terms of economic, social, geographical, political, data and digital background characteristics.
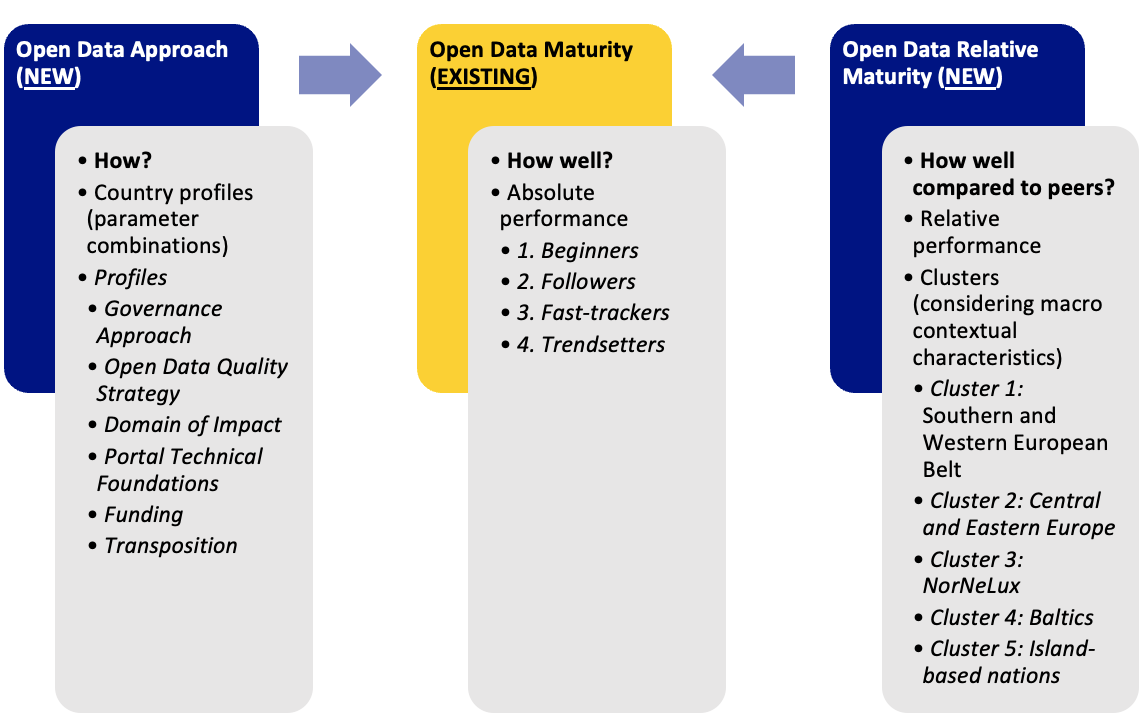
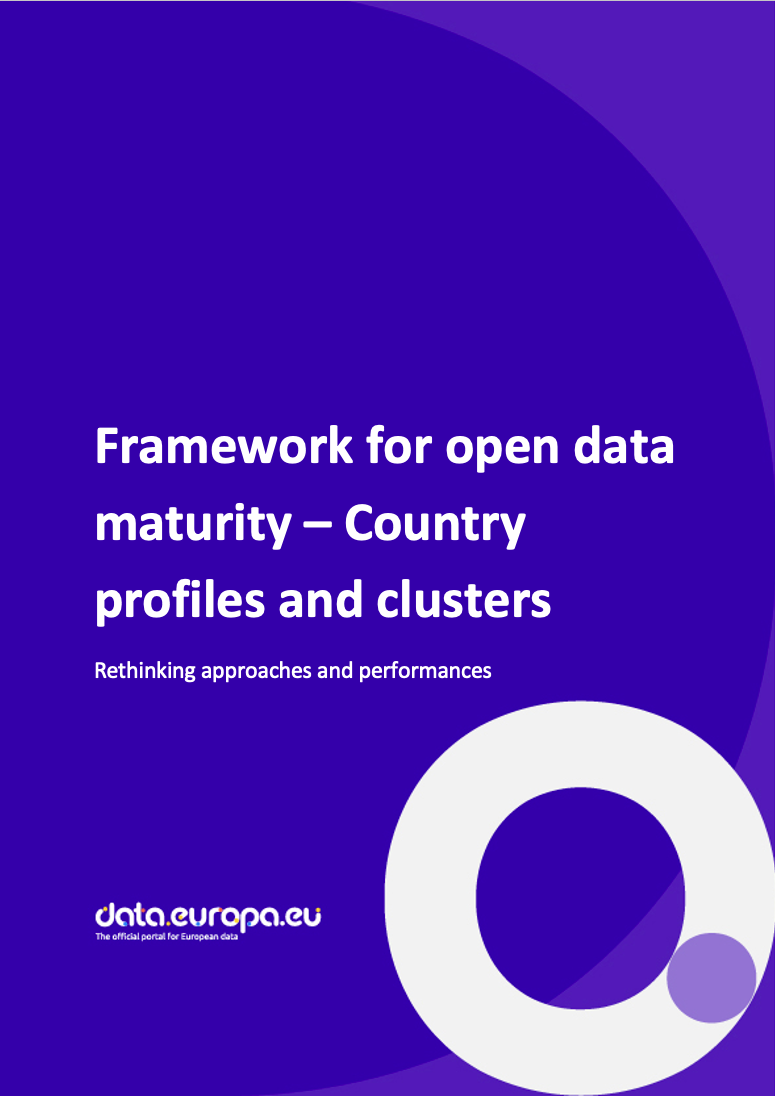
Figure 1: Framework of existing open data maturity performance groups and newly explored open data profiles and macro country clusters
By combining desk research, questionnaire data and statistical analysis, open data profiles as well as macro clusters were identified. Six parameters were considered to be most effectively describing a country’s open data descriptive profile: Governance Approach, Open Data Quality Strategy, Domain of Impact, Portal Foundations, Funding, and Transposition of the Open Data Directive. Each country profile shows a unique mixture of open data approaches, orientations and stances. How countries approach open data and put policies into practice may explain performance differences. For example, some countries may show signs of a top-down Governance Approach, with an Open Data Quality Strategy focused on depth and richness of data, all-round Impact, standardised Portal Technical Foundations, high Funding levels and amended the Directive into existing law. At the same time, other countries report a hybrid Governance Approach, with an Open Data Quality Strategy focused on diversity of open data types, more narrow and specialised Impact, custom Portal Technical Foundations, low Funding and multi-instrument approach of Open Data Directive Transpositions. Better understanding these characteristics helps in knowing how results come about and whether other countries should follow such examples.
In addition, macro country clusters were identified in order for countries to find most relevant peer countries. The five clusters of countries with most commonalities are: Southern and Western European Belt (Germany, France, Italy, Spain, Belgium, Portugal, Greece), Central and Eastern Europe (Poland, Romania, Czechia, Hungary, Austria, Bulgaria, Slovakia, Croatia, Slovenia), NorNeLux (Netherlands, Sweden, Denmark, Finland, Luxembourg), Baltics (Lithuania, Latvia, Estonia), and Island-based nations (Ireland, Cyprus, Malta). These countries are most comparable when looking at macro economic, social, geographical, political, data and digital characteristics. Yet, the overall open data maturity levels of countries within a cluster may differ. In order to bridge performance gaps with peers, countries may examine the open data profiles of peer countries closer, and exchange good practices, either in the context of the EU or bilaterally.
Depending on the views of the Publications Office of the European Union, European Commission and other relevant stakeholders, the 2026 edition of the Open Data Maturity Assessment may incorporate the framework of open data descriptive profiles and macro country clusters as presented in this report. For instance, by including the profiles and clusters in the main report or in the foreseen mini-site that accompanies the 2026 publication materials. Additions could be made for both the EU27 Member States and the other participating countries for the open data descriptive profiles, whereas specific data gaps need to be addressed before the macro country clusters can be extended to non-EU countries in future editions of the Open Data Maturity Assessment too.
Introduction
Context and current Open Data Maturity country profiles
The Open Data Maturity Assessment of the Publications Office of the EU and European Commission is a highly recognised and widely known study in the field of open data.[1] It evaluates progress and effectiveness of open data initiatives across four thematic dimensions intended to capture the end-to-end value chain of open data: Policy, Portal, Quality and Impact. In particular, the assessment measures the progress of European countries in making public sector information available and stimulating its reuse, in line with the Directive (EU) 2019/1024, also known as the Open Data Directive.[2] In the 10th edition of the measurement in 2024, a total of 34 countries were assessed: the 27 EU Member States, 3 European Free Trade Association (EFTA) countries (Iceland, Norway and Switzerland) as well as 4 EU candidate countries (Bosnia and Herzegovina, Albania, Serbia and Ukraine).
Ever since the first Open Data Maturity Report in 2015, the EU27 Member States and other participating countries have been grouped based on their overall open data performance. In general, such typologies promote peer-learning and allow for taking more targeted follow-up actions. The current open data maturity levels group countries into four categories: 1) Beginners, 2) Followers, 3) Fast-trackers, and 4) Trendsetters.
Figure 2: Four-category groups of participating countries based on overall maturity score
These groups are based on the absolute overall open data maturity score. To group the countries, overall open data maturity scores are plotted from lowest to highest. Groups are demarcated where observable gaps in the ordered scores are identified. The distribution of composite maturity scores is skewed towards higher scores. The groups in the 2024 report were as follows:
- Beginners (overall maturity score of 15–69 %). Bosnia and Herzegovina (BA), Albania (AL), Malta (MT), Iceland (IS), Greece (EL), Bulgaria (BG), Croatia (HR) and Romania (RO).
- Followers (overall maturity score of 74–80 %). Belgium (BE), Germany (DE), Hungary (HU), Finland (FI), the Netherlands (NL), Sweden (SE) and Switzerland (CH).
- Fast-trackers (overall maturity score of 83–90 %). Luxembourg (LU), Serbia (RS), Austria (AT), Norway (NO), Portugal (PT), Slovenia (SI), Latvia (LV) and Denmark (DK).
- Trendsetters (overall maturity score of 94–100 %). Cyprus (CY), Estonia (EE), Italy (IT), Czechia (CZ), Lithuania (LT), Spain (ES), Ireland (IE), Slovakia (SK), Ukraine (UA), Poland (PL) and France (FR).
The value of Open Data Maturity clusters and the need to explore alternatives
The four existing country groups in essence help countries understand and communicate their absolute position in the European open data maturity spectrum. Despite serving this purpose over the past years, it is clear from conversations with Member States and reflections by the Publications Office of the EU that these groupings are not always appropriate for a contextualised comparison among countries. For instance, countries within the same performance group may highly differ in terms of size, (data) infrastructure, re-user population, etc, but they are nonetheless grouped together due their Open Data Maturity scores. This presents two key challenges:
- A de-contextualised interpretation of performance which may risk undervaluing progress or challenges over time;
- Reduced opportunity for meaningful peer-to-peer learning, as countries may struggle to identify relevant peers to learn from.
Therefore, to more accurately reflect countries’ open data maturity, foster more effective peer-to-peer learning, and better deliver tailored communication and support, the Publications Office of the European Union aims to develop a framework for ‘profiling and clustering’ countries based on intrinsic characteristics and relevant descriptive parameters. This entails developing two metrics which, when viewed with the Open Data Maturity scores, would enable a layered approach to evaluating open data maturity. As displayed in Figure 3, the first new layer would be ‘Open Data Descriptive Profiles’, which is defined as a structured set of descriptive parameters that characterise how countries implement open data in practice, providing a contextual and practice-oriented view of their behaviours and approaches. The second new layer would be ‘Macro Country Clusters’, which is defined as groupings of countries based on shared intrinsic characteristics—such as economic, socio-cultural, geographical, political, and digital factors—that, while external to open data, significantly influence its implementation. Together, while the Open Data Maturity scores show what countries achieve, the Descriptive Profiles explain how they achieve it, and the Macro Country Clusters provide context for what those achievements mean, given each country’s broader characteristics.
Adding these profiles and clusters to the Open Data Maturity Report could benefit several data.europa.eu stakeholders. For policymakers, an exploration of meaningful profiles and clusters helps to tailor future policy actions and learn more effectively from peer countries. For media partners of data.europa.eu the presentation of findings into profiles and clusters opens up new ways to write news articles about the annual Open Data Maturity Assessment Report and progress made. Citizens, educational stakeholders and private sector re-users are expected to benefit from the publication materials too. By better understanding open data approaches (open data descriptive profiles) and relative performance (macro country clusters), may help them to better spot new re-use opportunities within the more specific context of their Member State.
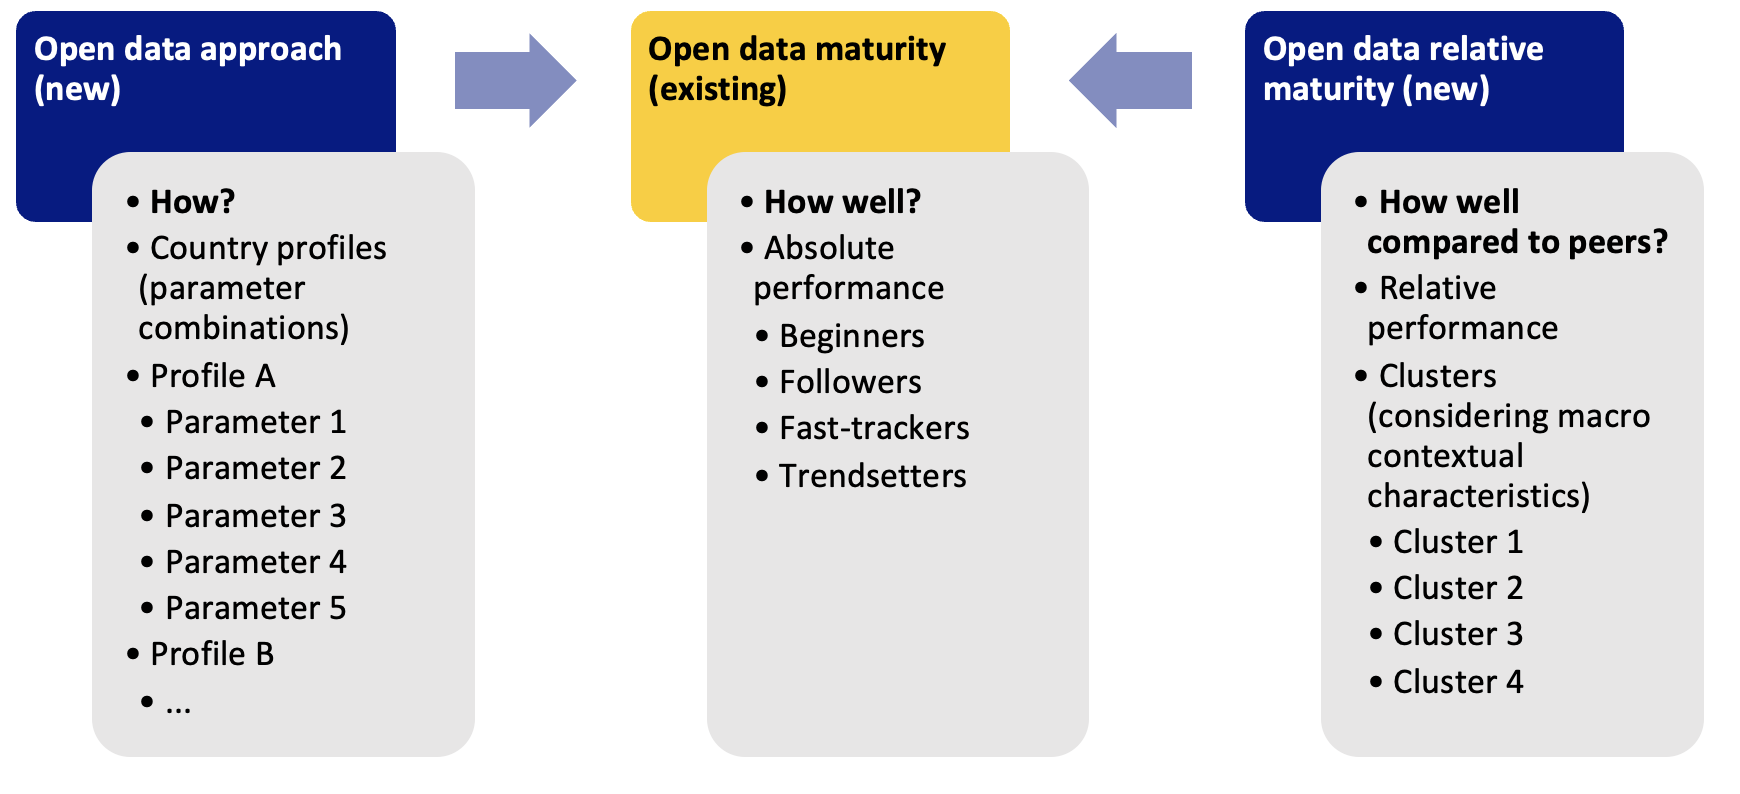
Figure 3: Linkages between the open data profiles, open data maturity performance and macro country clusters
The country profiles and clusters developed in this report can be implemented at a later stage, for example in the 2026 edition of the Open Data Maturity Assessment. Moreover, the Publications Office of the EU plans to launch a data.europa.eu mini-site on which the Open Data Maturity Report 2026 will be published. Country profiling is a key differentiator of the Open Data Maturity mini-site, delivering value far beyond the static report. By grouping countries based on intrinsic characteristics, it transforms a complex, diverse dataset into an intuitive experience. Instead of manually scanning dozens of profiles, users can quickly identify relevant peers, benchmark performance in context, and focus on targeted learning. Furthermore, this approach turns raw data into actionable insight, fostering smarter decision-making and more meaningful collaboration.
The following research questions have guided this exploratory analysis:
- What parameters best reflect the open data performance and characteristics of EU27 Member States?
- How are intrinsic country characteristics associated with national performance across the four dimensions of open data maturity?
- Policy: What institutional or legal factors shape a country’s approach to open data policy?
- Portal: What role does user feedback or participatory design play in shaping the evolution of open data portals, as well as how is the management, maintenance, and strategic development of national open data portals structured and organised, and how does this impact usability and sustainability?
- Quality: What infrastructure, technical capabilities or standards (e.g., ICT infrastructure, interoperability frameworks) support the publication of high-quality open data?
- Impact: How do digital literacy levels influence the observed impact of open data?
- What is the feasibility of extending this profiling framework to non-EU countries?
- How can these parameters promote peer-to-peer learning and inform actionable policy directions?
Chapter 2 of this report details the methodological approach of the analysis. Chapter 3 presents the findings from the desk research and the insights about the identified open data descriptive profiles, as well as the macro country clusters. In Chapter 4 the report concludes with main observations and recommendations for future editions of the Open Data Maturity Assessment.
Methodological approach
In order to explore open data descriptive profiles and macro country clusters, desk research was combined with analysing the Open Data Maturity questionnaire and a series of statistical sources. Importantly, this pilot serves testing purposes. It should not be interpreted as the beginning of a recurring data collection process under the Open Data Maturity Assessment. In addition, this exercise should lead to only minimal or no changes to the Open Data Maturity questionnaire. Any future integration into the regular Open Data Maturity Assessment cycle would require a separate decision and planning process from the Publications Office of the EU. Yet, the pilot study does provide the necessary information on measurement frequency and periodicity in order to assess the feasibility of regularly updating the country profile and cluster information and its sustainability of maintaining it over time.
Desk research was used to explore conceptual models and potential profiling and clustering indicators. Other studies in the area of data-driven and digital governments show different ways to profile and cluster Member States based on performances and rankings. Next to studies from various international and supranational organisations, private sector publications were analysed.
Data from the Open Data Maturity questionnaire was used as the main source for populating the open data maturity profile parameters for the EU27 Member States. This includes values and properties related to the four dimensions of the Open Data Maturity Assessment. The relevant profiles were constructed looking at the combination of values and properties. This allows for analysing how countries with similar approaches and country profiles perform compared to each other in terms of Open Data Maturity scores.
Statistical sources were used to develop the macro country clusters. Factors include economic, social and cultural, geographical, political and digital country characteristics. The more similar these contexts, the more effective the comparison of countries is expected to be. This helps to understand why some countries may underperform or overperform relative to their peers. Given the scope and aim of the analysis, existing and readily available data was taken into account. Specific inputs from the EU27 Member States were not necessary, avoiding data collection burden.
Government representatives from Greece (Beginner), Germany, (Follower) and Slovakia (Trend-setter) were consulted to validate the framework for open data maturity descriptive profiles and macro clusters. Openly shared views and feedback on a draft framework helped to improve and strengthen the results of the analysis. After standardising and completing the open data profiles and macro country clusters for the EU27 Member States, the feasibility of extending the framework to non-EU countries was assessed. Relevant recommendations were listed, such as the additional data collection that would be needed for Iceland, Norway and Switzerland, as well as Albania, Bosnia and Herzegovina, Serbia and Ukraine.
Findings
Exploration of conceptual models and country profiles for the EU27
EU Member States have several characteristics in common. However, one-on-one comparisons are oftentimes difficult to make. As a consequence, there are many different ways to group EU Member States and make meaningful comparisons. In order to find the most relevant approaches to profiles and clustering, a series of other studies in the field of (open) data and digital government were analysed on the use of country profiles and clusters.
Besides the Open Data Maturity Assessment, various international open data measurements have been performed over the years. These comparative studies also provide different ways to profile countries and cluster them. For example, the Open Data Inventory (ODIN) looks into data coverage and openness, in order to rank countries both globally and based on geographical regions.[3] The country contextual factors included in the inventory for comparative purposes are related to: legal frameworks, data commitments, global indexes of statistical capacity, and global indexes of governance and human development. The Open Data Barometer is a global measure of how governments are publishing and using open data for accountability, innovation and social impact.[4] In terms of country clustering, it distinguishes between governments that have adopted the Open Data Charter and those that, as G20 members, have committed to the G20 Anti-Corruption Open Data Principles. It compares both clusters to analyse how such international commitments influence open data performance. In a fairly similar way, the Global Data Barometer provides overall countries scores, based on performance in data governance, data capabilities, and data availability. The analysis takes into account key challenges and development areas, such as governance foundations, critical competencies, public finance, public procurement and political integrity.[5] The Global Open Data Index used to look into multiple types of open datasets and their public availability and quality, without comparing countries on the basis of other contextual factors.[6] Moreover, the OECD Open, Useful and Re-usable data (OURdata) Index provides insights into the data-related availability, accessibility and government support.[7] In addition, the OECD Digital Government Index (DGI) assesses digital by design, data-driven public sector, government as a platform, open by default, user-driven approaches and proactiveness. Findings from both OECD measurement frameworks are specifically analysed in terms of performance gaps between the cluster of OECD member countries and accession countries.
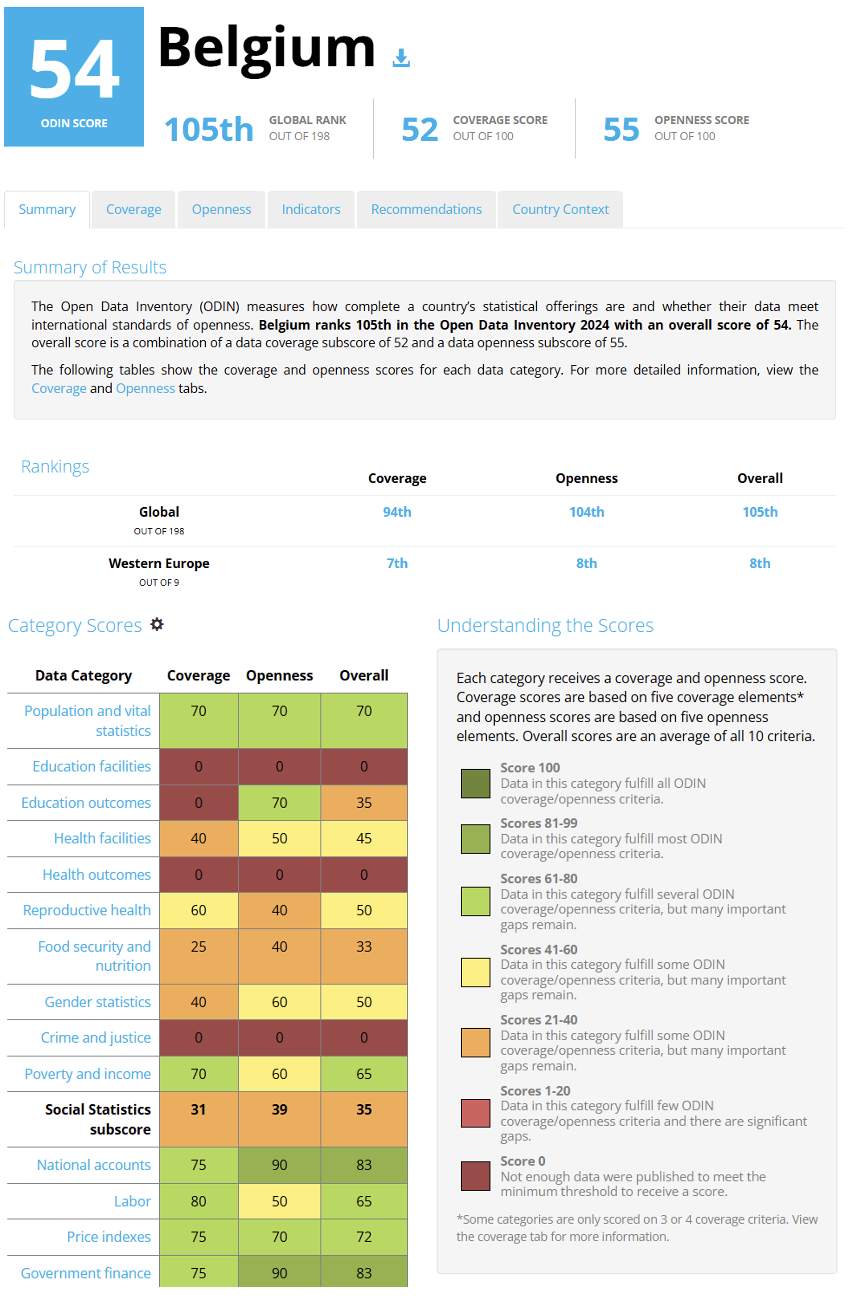
Figure 4: Illustration of Open Data Inventory (ODIN) country profile
Beyond the field of open data, one of the AI Watch publications from the Joint Research Centre of the European Commission illustrates how countries may be grouped on the basis of descriptive orientations rather than normative performance.[8] The study explores conceptual ways to profile the national AI strategies based on how much the strategy insists on three main focus areas concerning: data, internal AI capacity, and the external AI network.
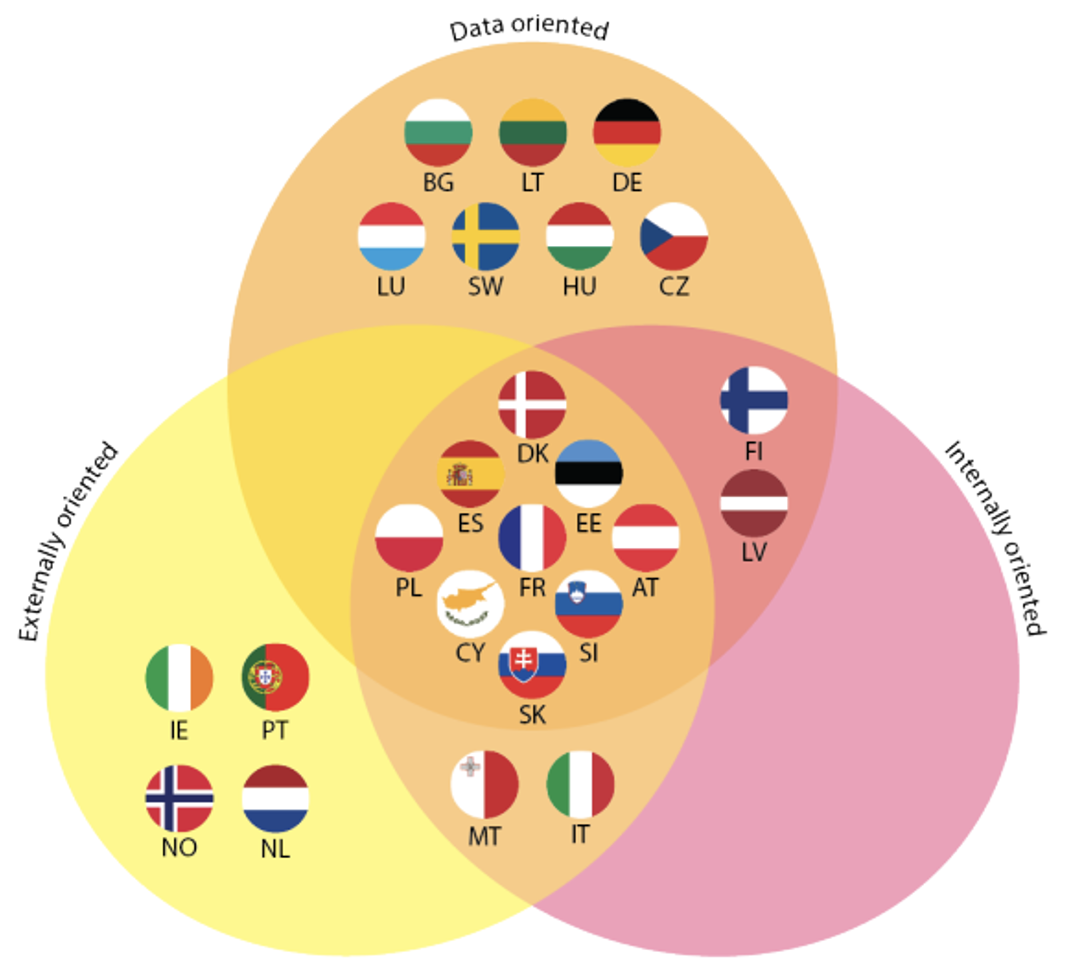
Figure 5: Clustering of national AI strategies
The United Nations e-Government Development Index (EGDI) groups countries on the basis of their overall score (low, medium, high, very high), as well as based on their development and income levels.[9] It also offers breakdowns by global regions and data comparisons on the levels of countries and cities specifically. In a similar way, the ICT Development Index from the International Telecommunication Union relates ICT performance to income groups, regions and gross national income (GNI) per capita.[10] An example of a Commission study that clusters countries based on both absolute and relative performance is the eGovernment Benchmark. Countries obtain a score for a series of indicators on eGovernment provision and obtain a score for the extent to which the population uses these eGovernment services. This results in a typology with five eGovernment profiles: Neophytes (low digitalisation and low uptake), High Potentials (low digitalisation, medium or high uptake), Progressives (medium digitalisation, low uptake), Builders (high digitalisation, low or medium uptake) and Matures (high digitalisation, high uptake).[11] These profiles increase the comparability of countries, as countries in the same group are ought to be more similar with similar challenges moving forward. The study also grouped EU countries into five clusters on the basis of several homogeneous contextual background statistics, such as population size, (digital) educational skills levels, urbanisation and implementation maturity of digital infrastructure. More recent editions of the study divided eGovernment provision and uptake into four clusters: Non-Consolidated eGovernment (low digitalisation, low uptake), Unexploited eGovernment (low digitalisation, high uptake), Expandable eGovernment (high digitalisation, low uptake) and Fruitful eGovernment (high digitalisation, high uptake).[12]
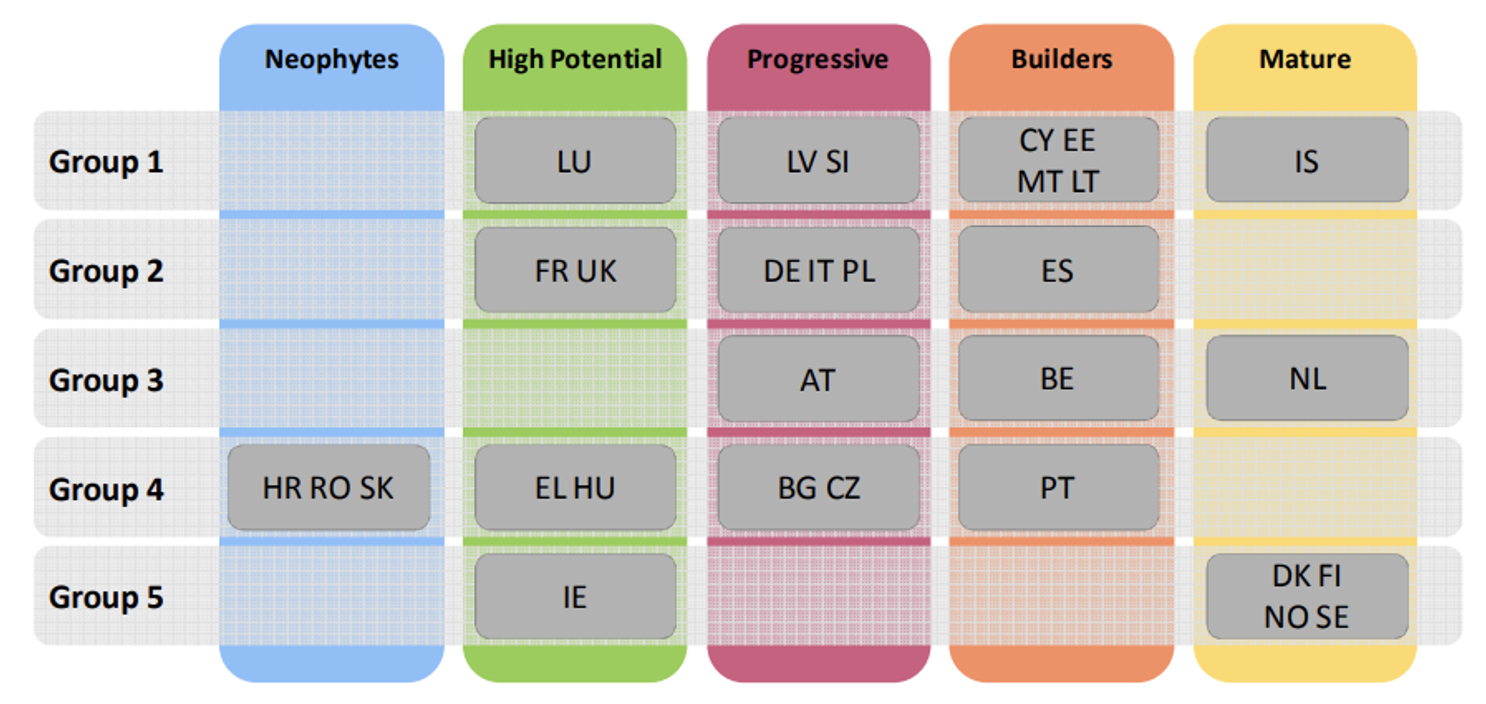
Figure 6: eGovernment Benchmark country clusters
Next to studies from various international and supranational organisations, country profiling and clustering is also visible in various private sector studies on data-driven and digital governments. For example, the Huawei Global Digitalisation Index (GDI) clusters countries according to their level of ICT maturity and economic development: starters (low digitalisation levels, with relatively low GDP per capita), adopters (average digitalisation levels, with average GDP per capita), frontrunners (high digitalisation levels, with relatively high GDP per capita).[13] The Data-Powered Enterprisessurvey from the Capgemini Research Institute analyses two key pillars: data foundations and data behaviours. [14]Organisations can be characterised based on all underlying indicators as: data laggards (low data foundations, low data behaviours), data aware (low data foundations, high data behaviours), data enabled (high data foundations, low data behaviours) or data masters (high data foundations, high data behaviours).
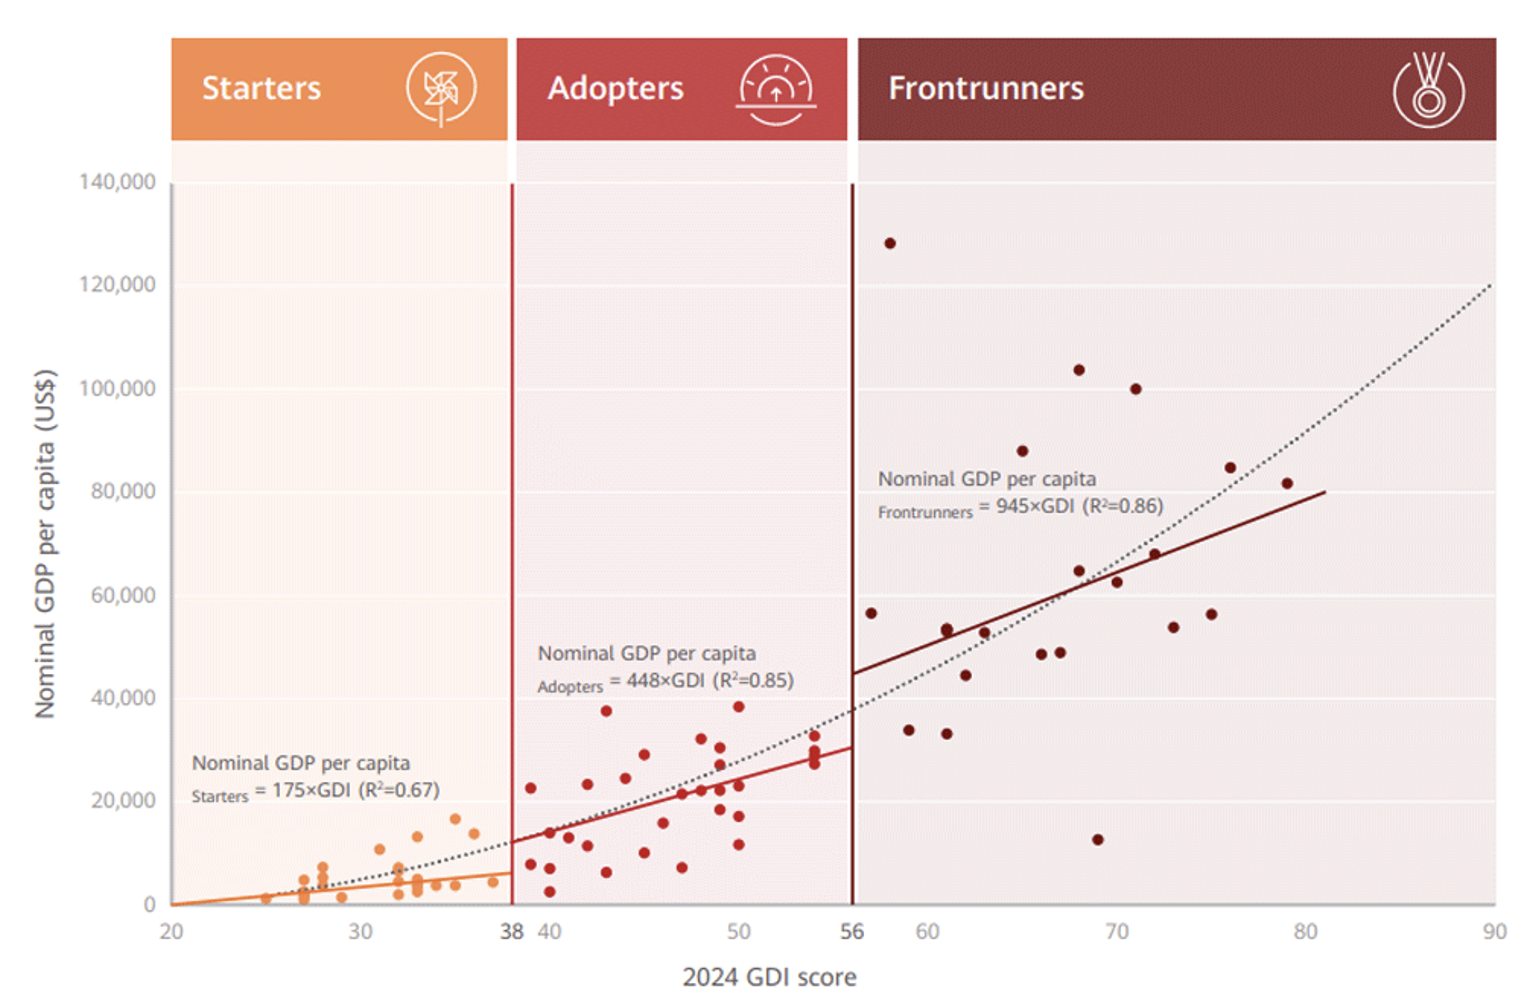
Figure 7: Global Digitalisation Index (GDI) country clusters
Similar quadrants are presented in several AI publications. For example, the matrix from Gartner’s AI Opportunity Radar has two axes, equally on the level of organisations. [15] It looks at whether Artificial Intelligence augments everyday processes or create something game-changing. Furthermore, it considers whether the technology primarily adds value to internal audiences and operations or external client-facing audiences. The BCG Distribution of AI Economies covers six archetypes based on AI readiness and exposure: AI emergents (bottom 10% readiness, low AI exposure), AI gradual practitioners (average readiness, low AI exposure), AI exposed practitioners (average readiness, high AI exposure), AI rising contenders (high readiness, low AI exposure), AI steady contenders (high readiness, high AI exposure).[16]
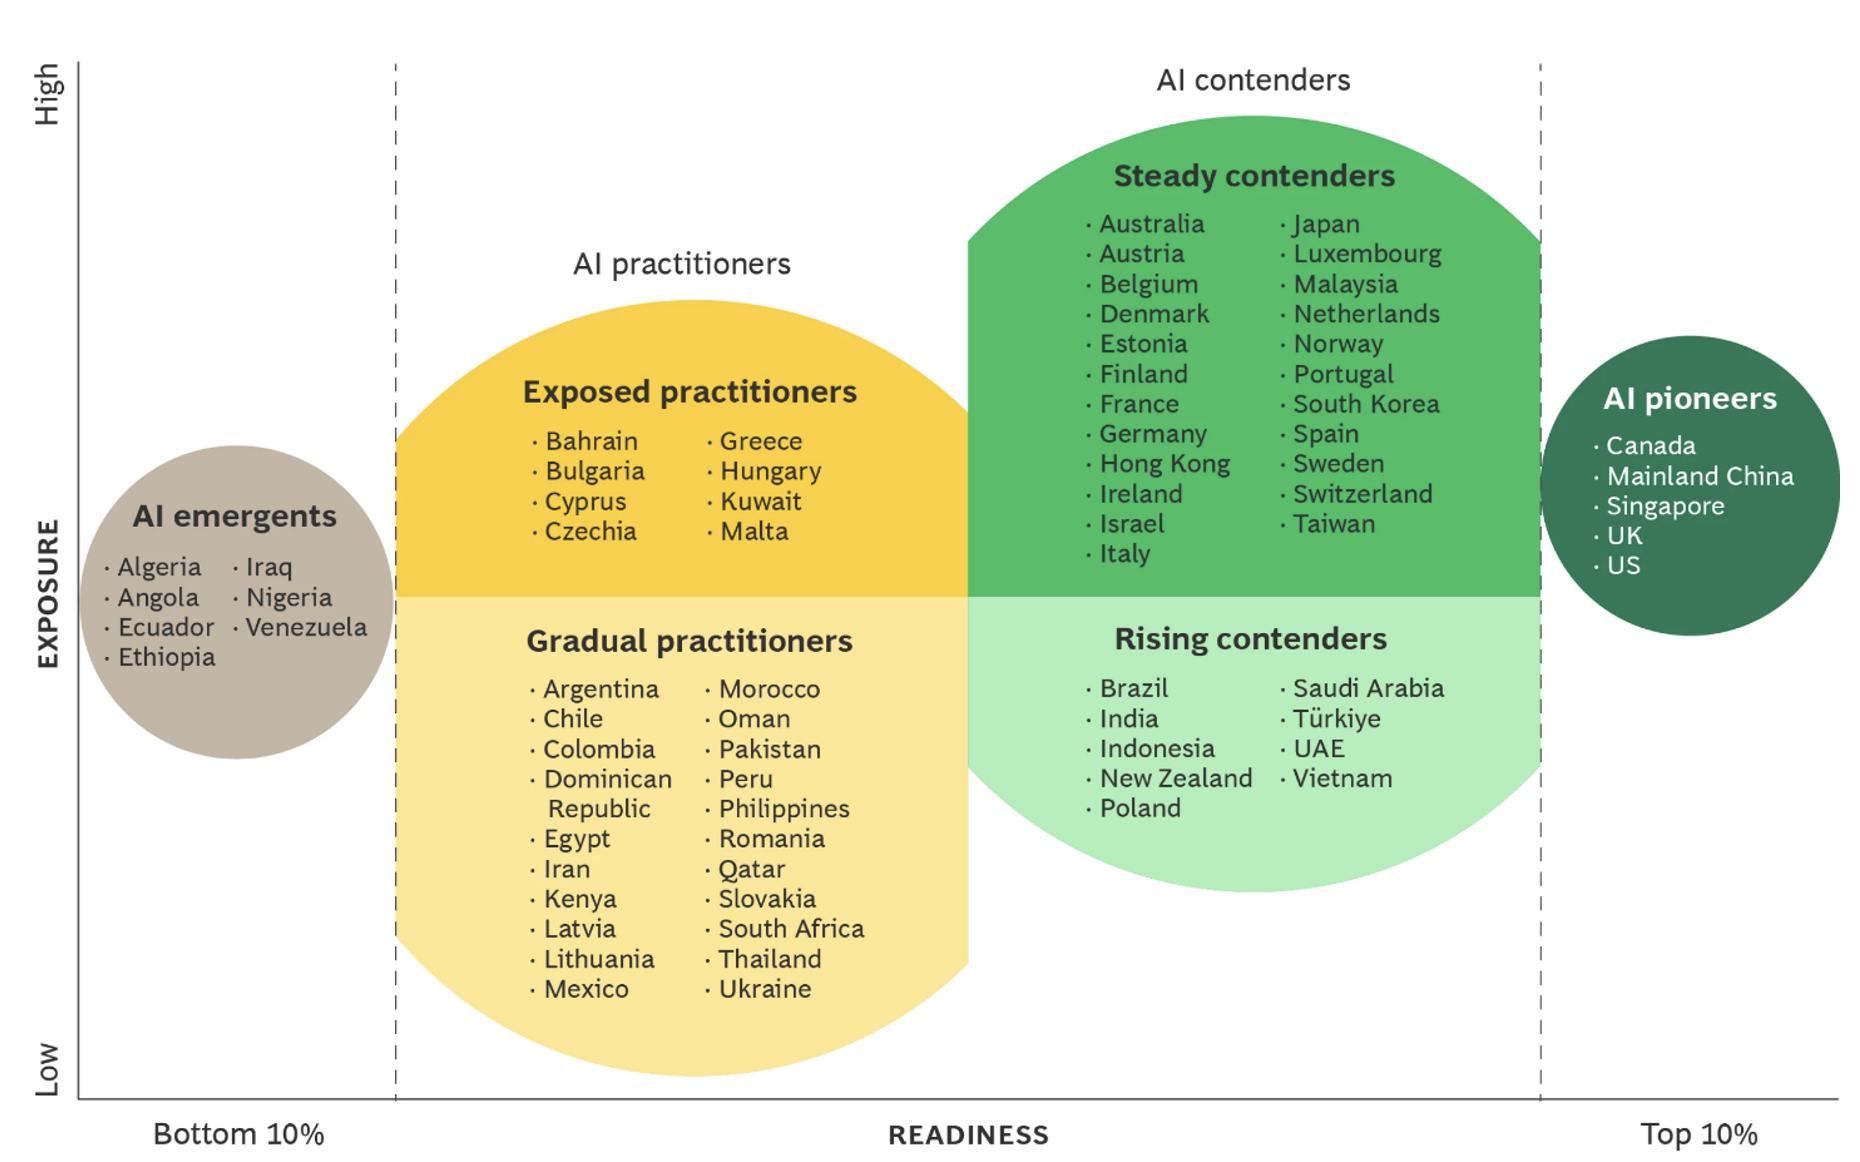
Figure 8: Distribution of economies across the archetypes of AI adoption
The above studies show that profiling countries based on their approaches as well as clustering countries based on macro context variables can be done in various ways. In many studies the focus is on using macro variables, such as economic statistics, to better interpret findings and compare countries on their performance. Fewer studies have been looking into what approach or country profile is underlying performance. Hence, analysing the specific open data descriptive profiles and macro country clusters are both considered to be valuable in light of the Open Data Maturity Assessment and wider studies on data-driven governments.
Open Data Descriptive profiles
Approach
While this study aims to go beyond the normative structure of the Open Data Maturity Assessment by developing a more descriptive framework, the data.europa.eu Open Data Maturity Assessment remains a valuable starting point. This is because the Open Data Maturity Assessment provides a comprehensive way to understanding the development of countries in making public sector information available and stimulating its reuse. In fact, since its inception in 2015, the methodology and the concepts encompassed in the Open Data Maturity Assessment have been regularly updated in order to reflect the most prominent open data developments across Europe. Furthermore, given the breadth and depth of its coverage, the contents of the Open Data Maturity questionnaire serve as an effective starting point for creating a descriptive framework for understanding countries’ open data activities and behaviours.
This study follows a two-phase approach for developing Open Data Descriptive Profiles: first, by conceptualising the key parameters, and second, by operationalising them. Starting with the conceptualising phase, due to the normative nature of the Open Data Maturity questionnaire and its broad groupings of questions under each dimension, the analysis deliberately moved away from its original indicator-based format. Instead, this study utilises the Open Data Maturity questionnaire not as a fixed evaluative tool, but as a thematic foundation.[17] In this sense, conceptualisation of the open data descriptive profiles took an inductive approach: starting with questions under each dimension, and ultimately arriving at a list of descriptive parameters that describe how countries engage with open data based on themes that appear between questions. The process, as displayed in Figure 8, begins by ungrouping the questions from their original indicator-based structure within each dimension and examining them individually. The focus, then, is shifted to identifying groups questions that represent shared descriptive characteristics or behaviours. These groups then form the basis for defining descriptive parameters through which countries’ open data practices can be profiled and better understood.
Once a set of descriptive parameters have been identified within each dimension, they are then examined across dimensions to detect overlapping themes. When overlaps are found, similar parameters are merged, resulting in a more concise and integrated set of descriptive parameters that span all four dimensions. It is important to note, throughout both the initial identification and the cross-dimensional comparison phases, the parameters are continuously revised, refined, and tested for coherence. This ensures that each parameter is clearly defined, avoids redundancy, and captures a distinct aspect of open data behaviour. This will also entail rigorous evaluation of which questions are most relevant to distinguishing a certain parameter, and which questions should be omitted from the exercise due to a lack of relevance. Nonetheless, the goal is to arrive at a focused and manageable list of parameters that are analytically meaningful and practical. By keeping the list as concise as possible, we aim to ensure relevance, maintain analytical focus, and reduce unnecessary complexity.
For example, several Open Data Maturity questionnaire items from the Policy dimension were considered to describe the policy approach of a country, rather than the evaluative results of such an approach. These questions were grouped and then compared with approach-type of questions from the dimensions Quality, Portal and Impact dimensions, as to bundle related questions and shape a meaningful parameter.
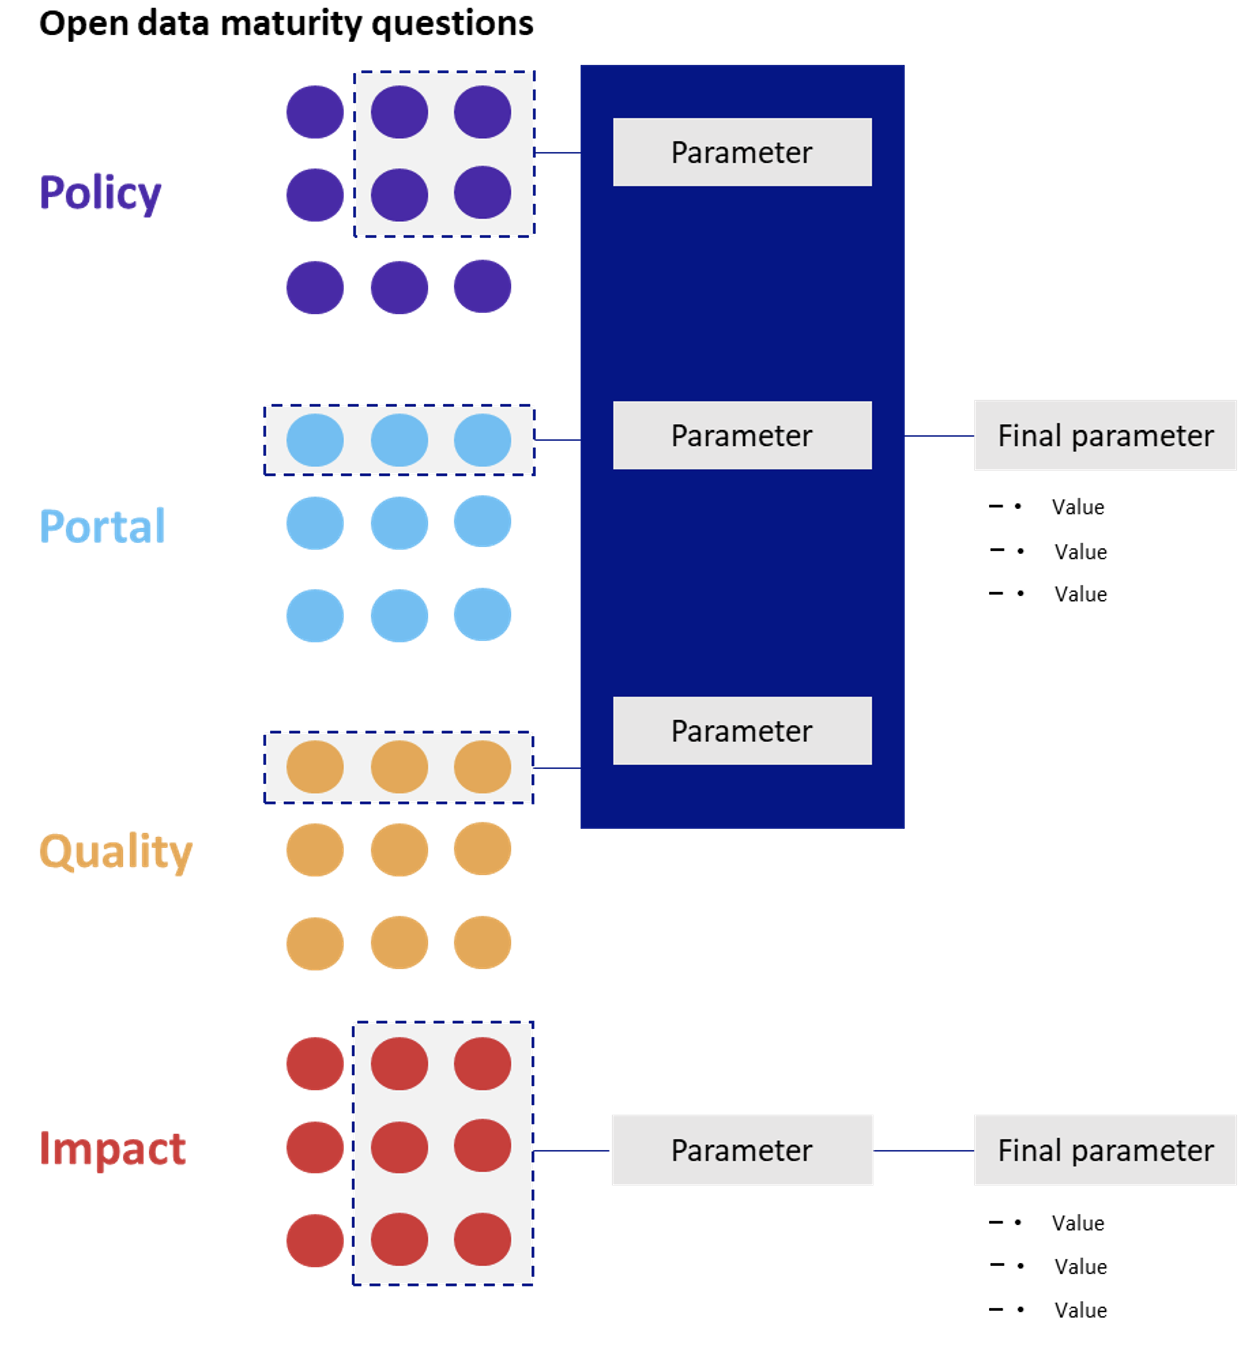
Figure 9: Open data parameter development process
Once the final set of descriptive parameters are defined, the next task is to concretise the values that can be used to measure them, which we envision as the operationalising phase. This phase is driven by the definitions of descriptive parameters that were defined in the previous step. Moreover, each parameter can be measured in one of two ways: either directly through the original questions that informed its definition, or through custom-developed metrics inspired by those questions. These values serve as operationalisations of the descriptive parameters, allowing them to be meaningfully assessed. The data sources for these values are either the direct responses provided by countries to the questions that are maintained as values under each parameter, or alternative sources where relevant. Furthermore, Individual questions from the Open Data Maturity questionnaire serve two key purposes. First, when grouped they can reveal shared descriptive traits or behaviours. Second, they can act as direct evaluative tools, i.e., a means of collecting specific data from countries about particular open data characteristics. In this sense, we utilise the questionnaire to conceptualise the country profiling framework and its parameters, and these parameters are operationalised (i.e., measured) through, but not limited to, the questions used to conceptualise them, with additional sources as well.
The final step is to profile countries based on the results of each associated value. These results provide insight into how a country goes about or behaves with respect to a specific descriptive parameter. It is important to note that this profiling framework can be seen as a dynamic and evolving tool – to be continuously updated in response to technological advancements, emerging practices, and shifts in the open data landscape, just as it is in the overall Open Data Maturity Assessment Methodology.
Findings
Conceptualising phase
The process of conceptualising descriptive parameters from the Open Data Maturity questionnaire involved two key steps. First, we examined the wording and intent questions in order to identify commonalities in what they aimed to assess. This thematic regrouping allowed us to define a set of descriptive parameters that more accurately reflect the underlying practices and behaviours of countries in relation to open data. For example, several questions within the Policy dimension focused on the presence and coherence of national strategies, legal frameworks, and governance structures. These were collectively interpreted as relating to the ‘Strategic and Legal Foundations’ of open data. Accordingly, we defined this parameter as: “the existence, scope, and coherence of national and subnational open data policies, strategies, and legal frameworks.” The full list of preliminarily parameters can be found in Figures the Annex 5.2.
This process resulted in a total of 19 preliminary parameters: five within the Policy dimension, four within the Quality dimension, four within the Portal dimension, and six within the Impact dimension. These parameters are displayed in the appendix, with asterisks beside the questions that ultimately made it to the final set of parameters.
In the second step, these parameters were compared across dimensions to identify overlapping themes and reduce redundancy. As previously noted, this involved continuous revision and refinement to ensure each parameter was clearly defined, analytically meaningful, and free of redundancy. Building on this foundation, multiple factors were considered when revising the original 19 parameters into a more concise and integrated set. First, we assessed cross-dimensional alignment to identify parameters that reflected similar behaviours across different dimensions. One example is the Ecosystem Development parameter under the Policy dimension, which focused on stakeholder engagement in open data capabilities. This parameter was found to closely relate to Community Engagement under the Portal dimension, which examined stakeholder interaction with the national portal. Due to their similarity, they were initially merged to form a unified parameter capturing stakeholder collaboration.
The second factor considered was feasibility, specifically the practicality of measuring each parameter using the available data. Parameters were evaluated based on the clarity, consistency, and relevance of the underlying questions. In the case of the merged Ecosystem Development and Community Engagement parameter, it was ultimately excluded from the final set due to feasibility concerns. The questions and/or metrics associated lacked sufficient specificity to support reliable cross-country comparison. Moreover, the behaviours it aimed to capture were partially reflected in other, more robust parameters such as the Governance parameter, which reduced its distinctiveness and analytical value. Another example is the original Data Accessibility and Reusability parameter, which sought to describe how countries ensured that open data was both available and usable. While conceptually rich, it drew on 19 underlying questions from both the Portal and Quality dimensions, making it difficult to operationalise in a focused and consistent way. To address this, the parameter was revised and reframed into a more targeted open data supply approach, which allowed us to isolate and measure specific aspects of accessibility and reusability more effectively. This transformation reflects a broader principle in our approach: while conceptual breadth is valuable, it must be balanced with methodological clarity and practical measurability to ensure the framework remains both meaningful and usable.
This consolidation process led to a refined set of seven parameters. Following a second round of evaluation, focused on the definitions and underlying questions of each parameter, the final set was narrowed down to six.
Operationalising phase
Each of the six parameters are operationalised by the most accurate and relevant source of data that enables its measurement for participating countries. In some instances, this meant keeping the questions used to conceptualise the parameter as a metric for measuring countries approaches. For others, additional data sources (e.g., form the data.europa.eu portal, official documentation online) were incorporated. The full list of data sources used to operationalise each parameter is displayed in Figure 10.
| Parameter | ID | Question |
| Governance Approach | P14 | How would you classify the model used for governing open data in your country? |
| Open Data Quality Strategy | PT39 | Does the national portal provide a way for non-official data (e.g. community-sourced or citizen-generated data) to be published? |
| PT7 | Does the national portal provide functionality for users to contribute datasets they have produced or enriched? | |
| Q23 | Do you use a model (such as the 5-Star Open Data or FAIR) to assess the quality of deployment of data in your country? | |
| Q24 | Do you conduct activities to promote and familiarise data providers with ways to ensure higher quality data? | |
| Q15 | Does the national portal follow the DCAT-AP framework or, if not, are standards in place to ensure interoperability with DCAT-AP? | |
| P6 | Does the national strategy/policy outline measures to incentivise the publication of and access to citizen-generated data? | |
| Domain of Impact | I12 | Is any data on the impact created by open data on governmental challenges (e.g. efficiency, effectiveness, transparency, decision-making capacity) available in your country? |
| I13 | Is the use of open data in your country having an impact on the efficiency and effectiveness of the government (at any level) in delivering public services? | |
| I14 | Is the use of open data in your country having an impact on transparency and accountability of public administrations? | |
| I15 | Is the use of open data in your country having an impact on policy-making processes? | |
| I16 | Is the use of open data in your country having an impact on decision-making processes? | |
| I17 | Is any data on the impact created by open data on social challenges (e.g. inequality, healthcare, education) available in your country? | |
| I18 | Is the use of open data in your country having an impact on society’s ability to reduce inequality and better include minorities, migrants, and/or refugees? | |
| I19 | Is the use of open data in your country having an impact on issues about housing in urban areas? | |
| I20 | Is the use of open data in your country having an impact on the issues of health and wellbeing? | |
| I21 | Is the use of open data in your country having an impact on the society’s level of education and skills (e.g. data literacy)? | |
| I22 | Is any data on the impact created by open data on environmental challenges (e.g. climate change and environmental degradation, as highlighted in the European Green Deal) available in your country? | |
| I23 | Is the use of open data in your country having an impact on the level of protection of biodiversity (e.g. maintaining a good air and water quality)? | |
| I24 | Is the use of open data in your country having an impact on the achievement of more environment-friendly cities (e.g., environment-friendly transport systems, waste management etc.)? | |
| I25 | Is the use of open data in your country having an impact on the fight against climate change, for example by undertaking predictive monitoring, preventive actions, or a differentiated response to connected disasters? | |
| I26 | Is the use of open data in your country having an impact on the consumption of energy based on fuel and the switch to renewables? | |
| I27 | Is any data on the economic impact (e.g. GDP, employment, productivity, innovation, new businesses created etc.) of open data available in your country? | |
| I28 | Is the use of open data in your country having an impact on the level of employment? | |
| I29 | Is the use of open data in your country having an impact on the level of innovation and the adoption of new technologies? | |
| I30 | Is the use of open data in your country having an impact on the level of entrepreneurship (especially of women and minorities) and business creation (especially with Small- and Medium-sized Enterprises)? | |
| I31 | Is the use of open data in your country having an impact on the level of productivity? | |
| Portal Technical Foundations | PT2 | What is the technology stack of your portal (e.g. based on uData, CKAN, etc.) |
| Funding | R6 | What is the annual budget of the national portal? |
| Transposition of the Open Data Directive | P1 | Is there a national open data policy in your country and, if your country is an EU Member State, does this include a national legislation for the transposition of the Open Data Directive? |
Figure 10: Specific questionnaire questions and data sources informing each parameter
Governance Approach
The Governance Approach parameter is based on question P13, which asks: “How would you classify the model used for governing open data in your country?”. [18] Countries can choose from three governance models—top-down, hybrid, or bottom-up—which are used to profile their approach to open data governance. 27 countries (Albania, Austria, Bosnia and Herzegovina, Belgium, Switzerland, Germany, Denmark, Spain, Finland, France, Croatia, Hungary, Iceland, Italy, Lithuania, Luxembourg, Latvia, Malta, Netherlands, Norway, Poland, Portugal, Romania, Serbia, Sweden, Slovakia, Ukraine) reported a hybrid approach, and 7 (Bulgaria, Cyprus, Czech Republic, Estonia, Greece, Ireland, Slovenia) reported a top-down model. Notably, no country identified with a bottom-up model, suggesting that open data governance across Europe tends to involve some level of central coordination or mixed responsibility.
However, insights gathered through consultations with Member States reveal that the real-world governance of open data is often more nuanced than the questionnaire suggests. Specifically, Member States expressed that the concept of open data governance remains vague and underdefined as it appears in the current question listed above. In our discussions we explored the concept of open data governance with Member States and their interpretation of the ‘hybrid’ category, inquiring about whether it should be understood in terms of coordination mechanisms, funding sources, or even technical infrastructure. One country described a hybrid governance model is both central government and external actors (such as NGOs) actively contribute to the development and promotion of open data initiatives. This interpretation reflects ‘hybrid’ as a collaborative governance structure. Another country emphasised the importance of understanding constitutional and organisational structures. They noted that while their states and NGOs run their own programs, the overarching governance is shaped by legal and institutional frameworks. This highlights that governance can not only be about coordination but also about legal authority and infrastructure. Furthermore, these sentiments highlight the need for the Open Data Maturity questionnaire to explicitly articulate the dimensions of governance it seeks to capture.
Open Data Quality Strategy
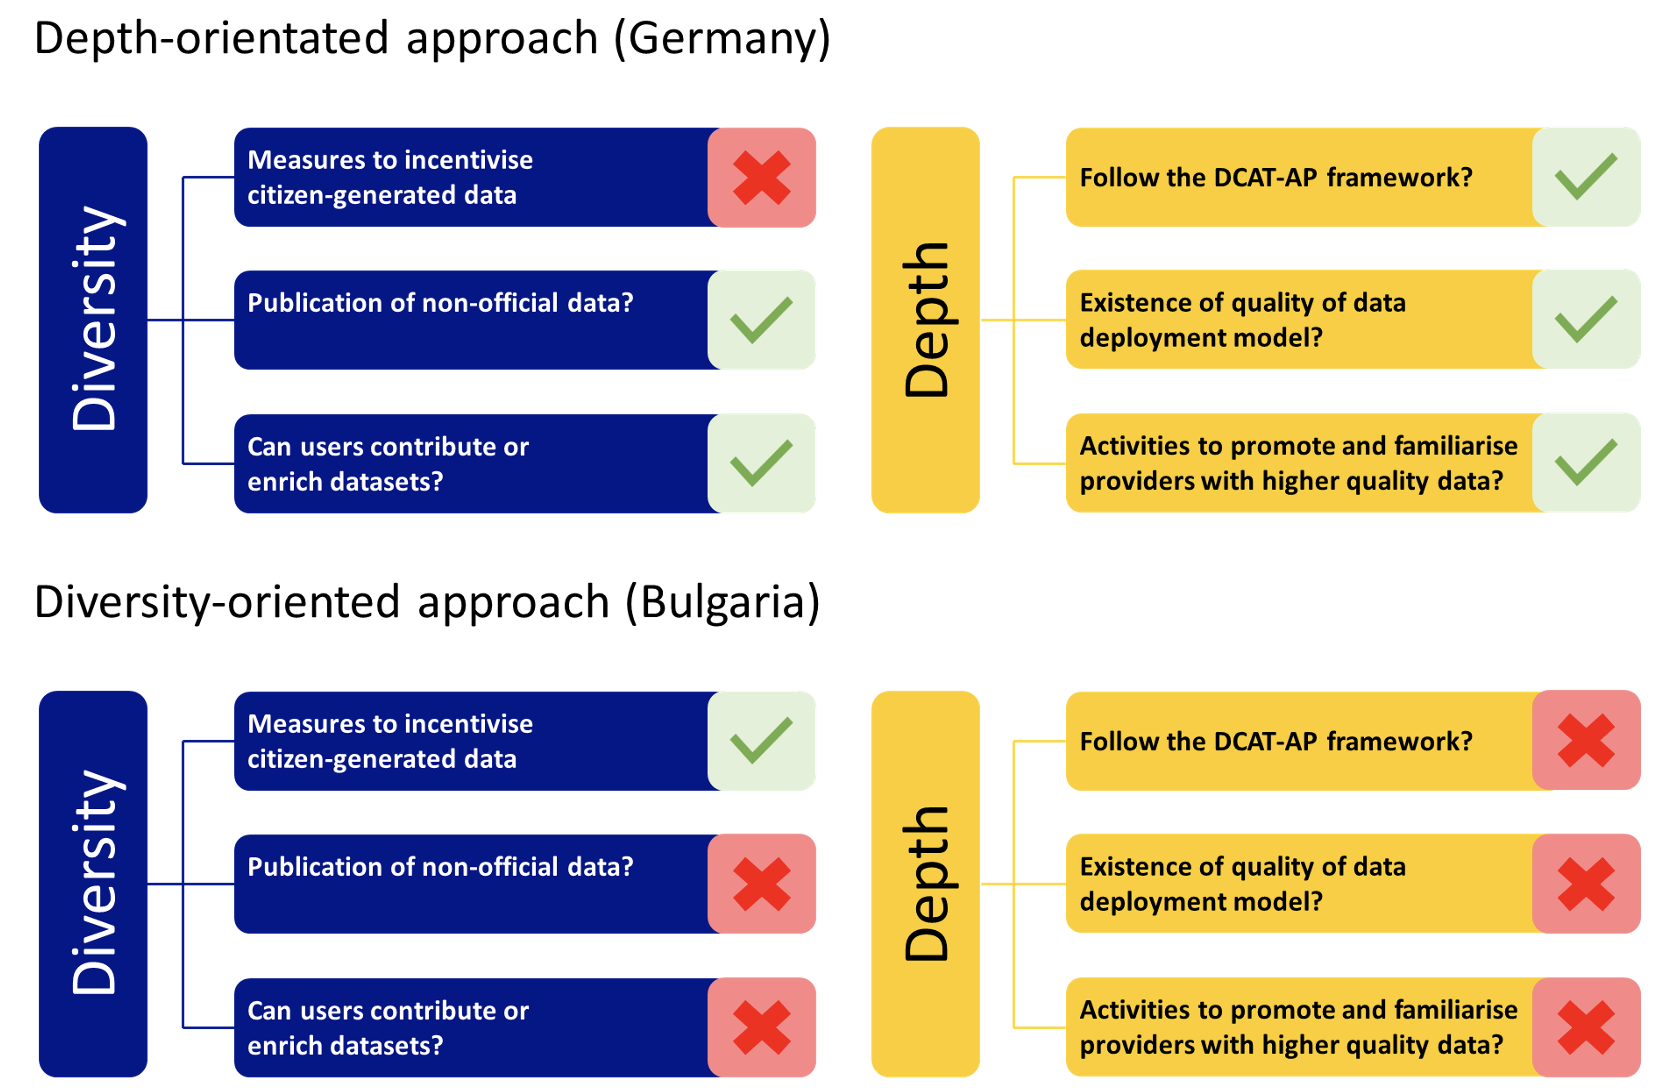
The Open Data Quality Strategy parameter captures whether the orientation of a country’s open data efforts is more tailored towards diversity, depth, or both. When profiled, most countries (over 60%) adopt a depth-oriented approach, indicating that currently there is a strong emphasis on data richness, technical standards, and interoperability rather than expanding the diversity of data sources.
A depth-oriented approach implies a country places greater focus on ensuring that the open data published is of high quality, maintaining technical standards and interoperability. To assess this, three questions from the Open Data Maturity questionnaire are considered, specifically measuring whether the national portal complies with interoperability standards (DCAT-AP) (Q15), whether a formal model such as the 5-Star or FAIR framework is used to assess data quality (Q23), and whether activities are undertaken to promote and familiarise data providers with practices that ensure high-quality data publication (Q24).[19]
A diversity-oriented approach implies a greater focus on publishing a greater variety of data types. It reflects openness to community participation and alternative data generation. For a diversity-oriented approach, three questions from the questionnaire are used, specifically measuring whether the national portal allows user-contributed datasets (PT7) whether it supports the publication of non-official data (PT39), alongside a third metric, whether the national strategy/policy supports publication of and access to citizen generated data (P6).
In order to distinguish a specific profile for countries under this parameter, the responses to these two sets of questions were examined, one for measuring data diversity and one for measuring data depth, analysing the distribution of "yes" answers within each set. The profiling logic is as follows: a country is considered more ‘depth-oriented’ if it has a greater number of ‘yes’ responses to depth-related questions than to diversity-related ones, and vice versa for a ‘diversity-oriented’ classification. If the number of ‘yes’ responses is equal across both sets of questions—or if all responses are ‘yes’—the country is categorised as having a ‘balanced approach.’ Finally, if all responses are either ‘no’ or ‘I don’t know,’ the country is classified as ‘unclassified’.
Among the countries assessed, 21 (Belgium, Switzerland, Czech Republic, Germany, Denmark, Greece, Finland, Croatia, Hungary, Iceland, Italy, Lithuania, Luxembourg, Latvia, Malta, Netherlands, Norway, Romania, Serbia, Sweden and Slovenia) were profiled as demonstrating a depth-oriented approach. These countries focus on improving the quality of open data rather than stimulating a wide variety of open data. An additional 11 countries (Albania, Austria, Cyprus, Estonia, Spain, France, Ireland, Poland, Portugal, Slovakia and Ukraine) were found to exhibit a balanced approach, showing quality approaches that cover both depth and diversity of open data. Bulgaria was the only country profiled with a diversity-oriented approach, meaning it puts greater efforts on ensuring pluriform open data compared to richness of datasets, while Bosnia and Herzegovina was the sole country categorised as unclassified, as it demonstrates neither depth nor diversity related orientation traits.
Figure 11:
Domain of Impact
The Domain of Impact parameter describes the breadth of open data impact across four domains: governmental, social, environmental, and economic. This is based on five standardised questions per domain in the Open Data Maturity questionnaire, focusing on governmental (I12-I16), social (I17-I21), environmental (I22-I26) and economic (I27-I31) open data impact.[20] These questions assess the availability of impact data, contributions to societal goals (e.g., biodiversity, public service delivery, social inclusion), practical and strategic impacts (e.g., on cities, public health, entrepreneurship), and influence on decision-making and productivity. A country is considered "active" in a domain if it answers "yes" to at least three out of five questions. Based on the number of active domains, countries are categorised as follows: "All-rounders" (active in all four domains), "Partial All-rounders" (active in three), "Specialists" (active in one or two, with domains specified), and "Non-engaged" (active in none). In total, 18 countries (Austria, Switzerland, Cyprus, Czech Republic, Denmark, Estonia, Spain, France, Ireland, Italy, Lithuania, Netherlands, Poland, Portugal, Serbia, Sweden, Slovakia, Ukraine) demonstrated an all-rounder approach, 9 (Belgium, Bulgaria, Germany, Finland, Hungary, Luxembourg, Latvia, Norway, Slovenia) reported a partial all-rounder approach, 2 (Croatia, Iceland) demonstrated a specialised approach, and 5 (Albania, Bosnia and Herzegovina, Greece, Malta, Romania) demonstrated a non-engaged approach.
Consultations with Member States underscored the need for greater clarity and specificity in defining what “impact” entails, as the current formulation was perceived as too abstract. Several participants emphasized that the definition should be more nuanced, capturing dimensions such as the duration of impact (e.g., short-term versus long-term effects). To address this, the definition of “impact” in the questionnaire could be expanded to explicitly include dimensions such as duration and scope.
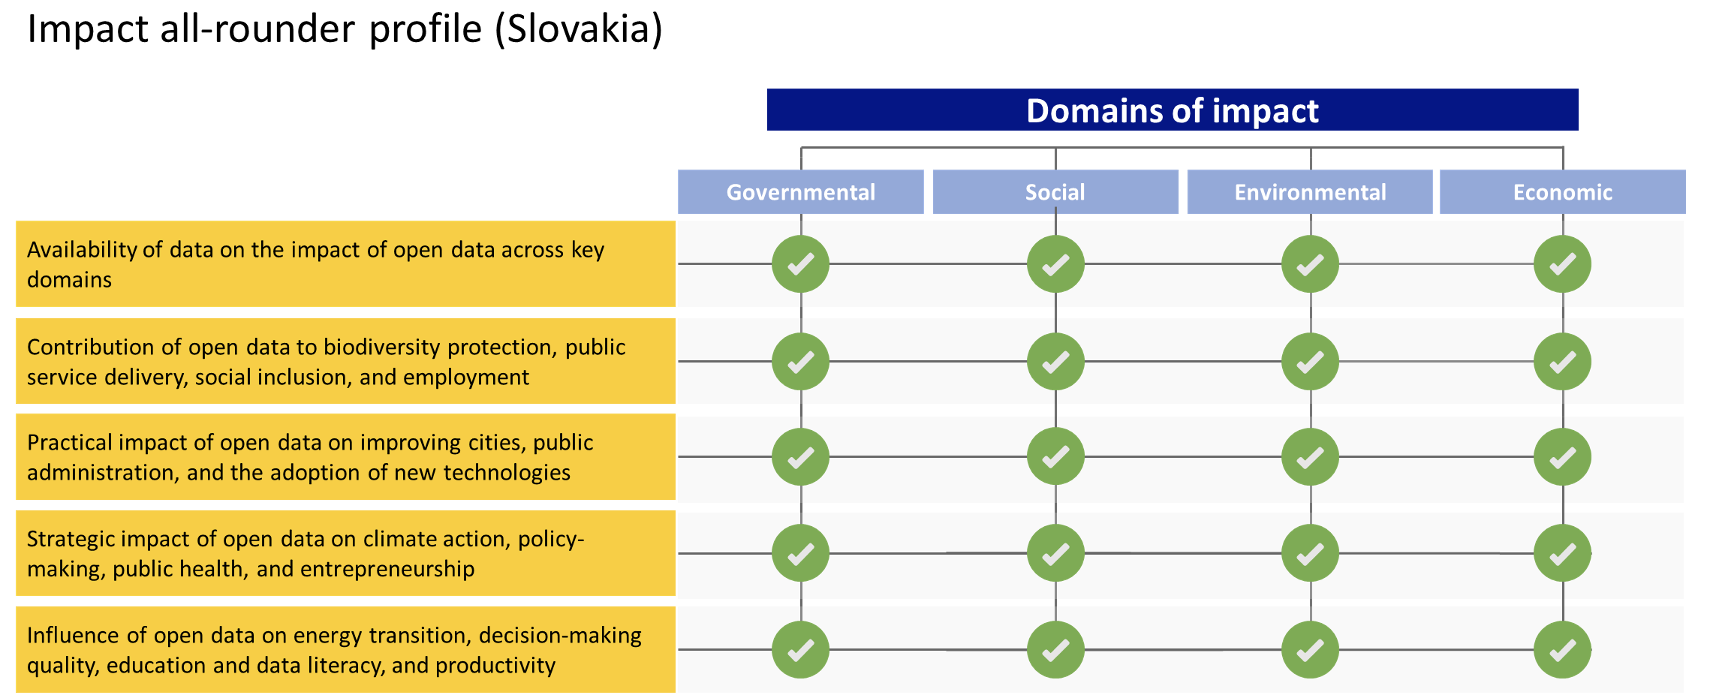
Figure 12: Example of the Domain of Impact country profile and its criteria
Portal Technical Foundations
The Portal Technical Foundations parameter describes the technical setup of a country’s national open data portal, with a specific focus on the underlying technology stack. This parameter is derived from question PT2[21] in the Portal dimension of the Open Data Maturity questionnaire, which asks: “What is the technology stack of your portal?”. Countries are profiled based on whether their portal is built on a standard platform (e.g., CKAN, uData, or Piveau), which are widely adopted open-source solutions commonly used for open data portals, or on a custom platform, which includes bespoke or proprietary systems tailored to national or organisational needs. Although countries could be categorised based on the specific platform they report, for the sake of comparability, they are grouped into these two broader categories. 22 countries (Denmark, Serbia, Hungary, Bosnia and Herzegovina, Germany, Croatia, Iceland, France, Austria, Switzerland, Greece, Italy, Slovenia, Finland, Luxembourg, Portugal, Spain, Ireland, Romania, Netherlands, Latvia, Ukraine) reported utilising a standard platform, while 12 (Bulgaria, Estonia, Poland, Belgium, Lithuania, Norway, Czech Republic, Slovakia, Malta, Sweden, Albania, Cyprus) reported a custom platform. It is important to note that the platform technologies referenced may evolve or become obsolete over time. Considering the ‘live’ nature of this framework, this parameter will be updated routinely to reflect newer technologies, ensuring its profiling is relevant and up-to-date.
Funding
The Funding parameter reflects the financial commitment and sustainability of a country’s investment in open data, specifically focusing on the annual budget allocated to the national portal. Due to the limited availability of open and verifiable data on broader open data investments, often considered back-end or confidential, this parameter relies on question R6 from the Open Data Maturity questionnaire, which asks: “What is the annual budget of the national portal?”. To categorise countries, a percentile-based method is used instead of averages, which can be skewed by extreme values. This approach allows for a more accurate understanding of how countries compare relative to one another. Based on this method, countries are grouped into three categories: Low (budgets between €0 and €200,000), Medium (€200,001 to €600,000), and High (above €600,001). 6 countries (Germany, Denmark, Estonia, France, Norway, Poland) reported a relatively high funding, 7 (Austria, Spain, Ireland, Italy, Luxembourg, Netherlands, Portugal) reported a relatively medium budget, while 21 (Albania, Bosnia and Herzegovina, Belgium, Bulgaria, Switzerland, Cyprus, Czech Republic, Greece, Finland, Croatia, Hungary, Iceland, Lithuania, Latvia, Malta, Romania, Serbia, Sweden, Slovenia, Slovakia, Ukraine) reported a relatively low funding.
When consulting Member States regarding this funding parameter, the need to broaden the scope of budget analysis beyond the national level and the open data portal was highlighted. Namely it was expressed that it would be more accurate to include regional and local funding, such as municipal open data budgets, in order to capture the full picture of financial commitment. Participants also underlined that examining how budgets are allocated—whether toward technical infrastructure, capacity building, or promoting data reuse—can reveal important insights into a country’s open data priorities. For example, one country noted that its national portal budget is primarily directed toward technical underpinnings, with less emphasis on reuse promotion.
These insights suggest that the funding parameter requires greater nuance in both scope and structure. Rather than relying solely on a single annual portal budget figure, it would be beneficial to change the scope of question R6 to capture a broader set of variables. Specifically, this may involve extending the temporal scope of budget analysis. Since many Member States operate on multi-year financial cycles, often undertaking major portal upgrades every three to five years and allocating the remaining funds to routine maintenance, it is more accurate to assess the average open data budget over the past five years rather than relying on a single-year figure. In addition, this may involve broadening the definition of budget to include both national and regional allocations, disaggregated across key expenditure categories such as technical infrastructure, capacity-building, and promotional or engagement activities.
Transposition of the Open Data Directive
The Transposition of the Open Data Directive parameter describes how countries have adopted or implemented the Open Data Directive within their national legal frameworks. Unlike for the transposition of the Public Sector Information Directive, detailed and publicly available information on how countries have transposed the Open Data Directive is more limited.[22] Therefore, at the moment the most accurate and accessible source for this parameter is question P1 from the Open Data Maturity questionnaire, which asks: “Is there a national open data policy in your country and, if your country is an EU Member State, does this include a national legislation for the transposition of the Open Data Directive?”.
The responses to this question provided valuable insights into the legal instruments used for transposition, such as dedicated laws, amendments to existing legislation, or broader digital laws, as well as supporting strategies, roadmaps, and the institutional arrangements for coordination and enforcement. This comparative analysis enabled to group countries based on shared structural and procedural characteristics in their approach to transposing and implementing the Directive. Nearly all Member States have already implemented the Directive or plan to do so within the next two years, so the emphasis here is not on whether transposition has occurred, but rather, the way in which it has been achieved. While non-EU countries are not formally required to transpose EU legislation, they are included in this analysis as active participants in the Open Data Maturity study.[23] In addition, their inclusion remains valuable for peer-to-peer comparison as many of these non-EU countries have voluntarily aligned with the directive. In fact, only Norway and Bosnia and Herzegovina reported that their transposition efforts are still in progress.
Countries are categorised into three distinct transposition types: Amending existing laws, Standalone legislation, and multi-instrument approach. 15 countries (Belgium, Croatia, Czechia, Denmark, Estonia, France, Greece, Iceland, Italy, Malta, Netherlands, Serbia, Slovakia, Spain, Switzerland), have amended the Directive into existing law, meaning, they have integrated it into pre-existing frameworks without introducing a separate dedicated act. Meanwhile, 10 countries (Albania, Austria, Cyprus, Germany, Ireland, Luxembourg, Poland, Portugal, Romania, Sweden), have standalone legislation which are explicitly dedicated to open data and public sector information reuse. Lastly, 7 countries (Bulgaria, Finland, Hungary, Latvia, Lithuania, Slovenia, and Ukraine), report a multi-instrument approach, meaning the Directive is transposed using a coordinated set of legal and policy tools (e.g., amendments to several laws, additional decrees or ordinances, strategic or policy documents that complement legal measures).
Overall open data descriptive profiles?
Following the classification of countries across each parameter, a comprehensive overall profile was considered, an encompassing profile that considers all parameters. It would be valuable to know whether several countries have similar open data descriptive profiles, analyse how these shared profiles relate to open data maturity scores, and compare with countries having a different open data approach. However, 33 unique profiles appeared in this attempt among the 34 countries under analysis. This high level of uniqueness posed a challenge: nearly every country had a distinct profile, even when simplifying the combinations of parameters. This made the peer-to-peer aim of this study obsolete. Nevertheless, future iterations may revisit the concept of overarching profiles to assess whether they can be refined in ways that enhance their comparative utility and practical relevance for participating countries. In any case, the open data maturity scores and country-specific profiles can be related to countries grouped in macro country clusters, discussed in the next section.
Macro country clusters
Approach
In order to facilitate peer-to-peer learning among countries, ideally countries are compared that share as much similarities as possible. The previous chapter analysed open data approaches and related descriptive profiles. This showed how countries organise and improve open data practices. By looking into the background characteristics of countries and clustering them, it becomes clear whether similar countries perform similarly, or whether some countries outperform others, potentially because they use different open data approaches.
Taking inspiration from the studies discussed in chapter 3.1, a set of macro context characteristics has been analysed to serve this purpose. Factors include economic, social and cultural, geographical, political and digital characteristics. The more similar these contexts, the more effective the comparison of countries is expected to be.
Findings
Economic characteristics
Economic characteristics are commonly used to find comparable countries. The Eurostat country factsheets summarise key indicators for all Member States, including indicators that relate to their economy.[24] Key examples of economic characteristics are: gross domestic product (GDP) per capita, unemployment rates, inflation rates, and government debt as percentage of the gross domestic product (GDP). Other economic indicators were considered of less relevance in light of this open data study, including country statistics on gender pay gap, minimum wage, people at risk of poverty or social exclusion, etc.
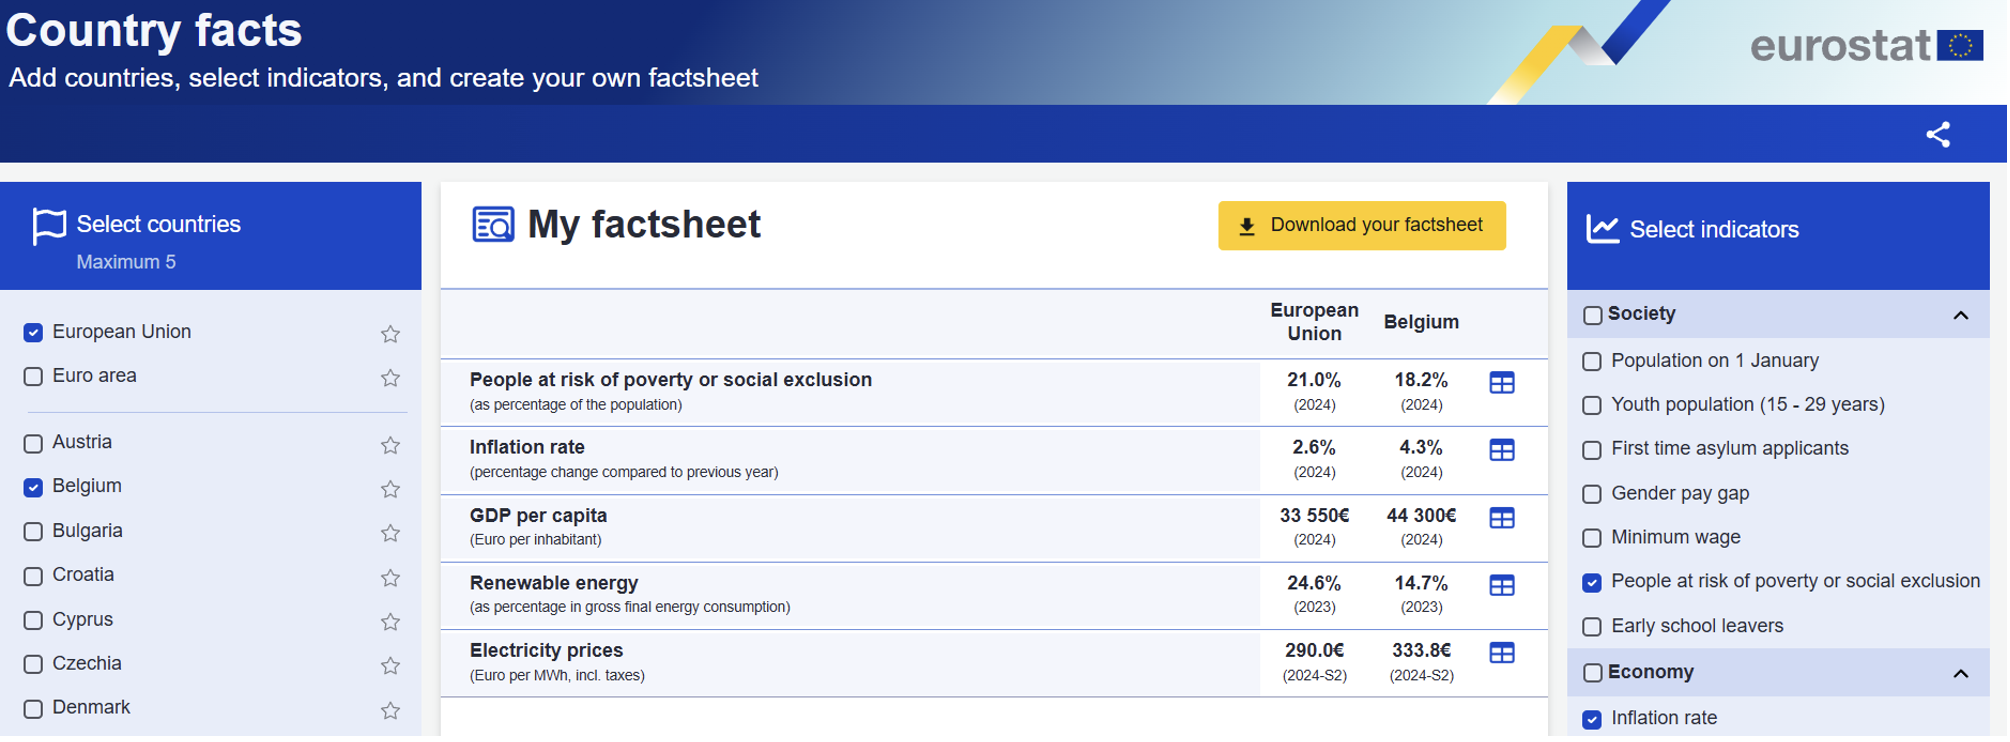
Figure 13: Illustration of Eurostat country factsheets
Social and cultural characteristics
Countries can also be clustered on the basis of social and cultural characteristics. The EU published official country profiles on its website, listing several indicators.[25] A common indicator is the population size of a country.[26]Demographics are considered to be a defining element too (e.g. the ratio between youth and elderly).[27] The same goes for education levels.[28] The EU has 24 official languages, besides minority languages, dialects, sign languages, etc. Eight of these languages are official national languages in multiple Member States.[29] These may shape linguistic regions: Dutch (Belgium, Netherlands), English (Ireland, Malta), Finnish (Finland, Sweden), French (Belgium, France, Luxembourg), German (Austria, Belgium, Germany, Luxembourg), Greek (Cyprus, Greece), Slovak (Slovakia, Czechia, Hungary), and Swedish (Sweden, Finland). More specific and less relevant characteristics include life expectancy, poverty rate, Gini coefficient and composites like the Human Development Index (HDI) from the United Nations.[30]
Geographical characteristics
Countries that are geographically close to each other may be clustered together. The EuroVoc Geographic Regions defines the EU27 countries into four European regions: Central and Eastern Europe (Bulgaria, Croatia, Czechia, Hungary, Poland, Romania, Slovakia, Slovenia), Northern Europe (Denmark, Estonia, Finland, Latvia, Lithuania, Sweden), Southern Europe (Cyprus, Greece, Italy, Malta, Portugal, Spain) and Western Europe (Austria, Belgium, France, Germany, Ireland, Luxembourg, Netherlands).[31] Although the geographical size of countries is not included in this analysis, urbanisation levels have been included as it often relates to other key macro indicators.[32]
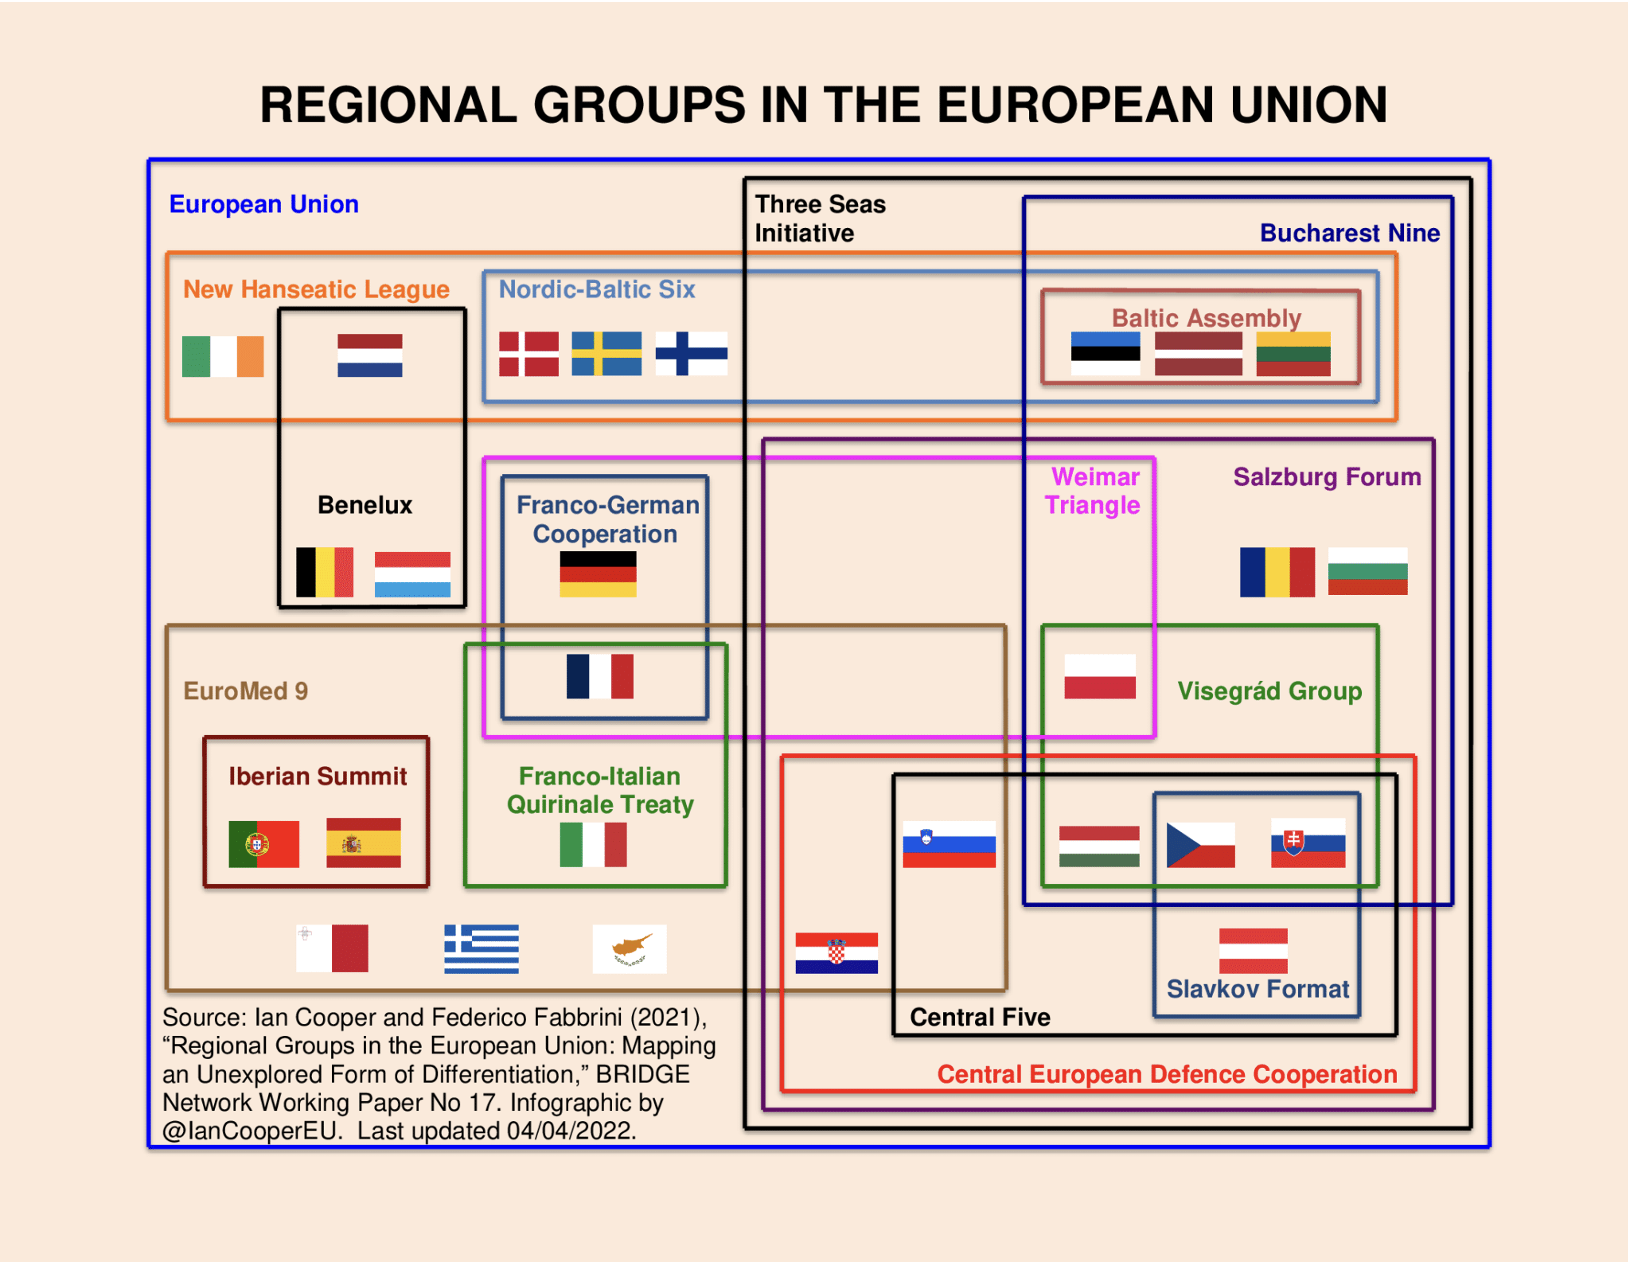
Figure 14: Example of political alliances in the EU
Political characteristics
The EU Member States have different types of political systems with different types of government and different types of parliaments. Government forms ranges from parliamentary, semi-presidential, presidential, with federal, devolved and unitary structures, as well as republic states and constitutional (popular) monarchies.[33] These systems can play an important role in how democratic power and roles are allocated. Accordingly, the (de)centralisation levels of Member States differ. For instance, Ireland measures as most centralised for fiscal, administrative and political decision making, while Germany most decentralised.[34] Relevant to open data and transparency, the World Bank good governance indicators complement these macro characteristics, related to Voice and Accountability, Political Stability and Absence of Violence/Terrorism, Government Effectiveness, Regulatory Quality, Rule of Law, and Control of Corruption.[35]Furthermore, countries may have different political memberships. Apart from the Euro and Schengen areas, the duration of the EU membership is considered to play a role in the international cooperation among different EU Member States. Other (in)formal regional groups are considered to be less influential, such as the Benelux (Belgium, Luxembourg, Netherlands), Iberian Summit (Portugal, Spain), Salzburg Forum (Austria, Bulgaria, Croatia, Czechia, Hungary, Poland, Romania, Slovakia, Slovenia) and New Hanseatic League (Denmark, Estonia, Finland, Ireland, Latvia, Lithuania, Netherlands, Sweden).[36]
Data and digital characteristics
The European Commission’s Digital Decade Policy Programme sets the digital priorities until 2030. It comes along a set of Digital Decade Key Performance Indicators (KPIs) related to four cardinal points: Digital Infrastructure, Digital Transformation of Business, Digital Skills, and Digital Public Services.[37] Some of these data and digital context characteristics have been included in the clustering model, in light of countries’ open data maturity. From the Digital Infrastructure cardinal point, overall 5G coverage has been taken into account. From the Digital Transformation of Business pillar Cloud take-up, Data analytics take-up and AI take-up are factored in, which all can be considered enablers of open data or technological developments that benefit from open data. From the Digital Skills area Basic digital skills and the number of ICT specialists may influence open data maturity scores.[38] Other contextual factors deemed relevant, and for instance included in the Interoperable Europe (IOPEU) and former National Interoperability Framework Observatory (NIFO) are: Data and information skills that may relate to data reuse opportunities, as well as R&D expenditures from a wider innovation point of view.[39]
Mapping of the EU27 Member States along macro country clusters
The previous chapter analysed open data approaches and related profiles. This showed how countries organise and improve open data practices. By looking into the background characteristics of countries it becomes clear whether similar countries part of cluster perform similarly, or whether some countries outperform others, potentially because they use different approaches.
To find groups of countries with similar macro characteristics, a standard cluster analysis was conducted, using K-means analysis in KNIME, an open-source data science platform used in several EU projects and initiatives.[40] A deliberate split into five clusters was made to ensure each cluster is both meaningful and includes multiple countries per cluster. After collecting all data for all selected context variables, normalisation was applied to synchronise variables using different scales (e.g. some metrics run from 0% to 100%, while others from 0 to 1). Less relevant nominal variables, such as linguistic regions, were left out of the statistical analysis. However, these softer characteristics could be included in country profile pages still, based on the individual comparison preferences of policy makers, journalists, researchers, citizens and others interested in open data maturity.
After running the analysis, Hungary, Romania and Croatia were grouped to the closest statistical cluster, while these initially did not belong in clusters with at least three countries. The analysis resulted in the following clusters, based on set of 19 macro context characteristics:
- Southern and Western European Belt (Germany, France, Italy, Spain, Belgium, Portugal, Greece): this group of countries are relatively large in terms of population, with relatively many elderly compared to youth, with average education levels and average shares of people living in urban areas. These countries show average economic contexts and welfare. This group contains countries that have been member of the EU for a relatively long time. Political decision-making is moderately decentralised, while governance standards are in line with the EU average. Countries show average data and digital related backgrounds and infrastructures.
- Central and Eastern Europe (Poland, Romania, Czechia, Hungary, Austria, Bulgaria, Slovakia, Croatia, Slovenia): this group of countries has medium to large populations with demographical compositions similar to the EU average. Relatively many citizens in these countries attained educational primary and secondary education and relatively many live in rural areas. The economic context in these countries can be describes as below average. Various countries have ‘young’ EU memberships. Political decision-making is as (de)central as the EU at large, while governance standards turn out below average. The data and digital infrastructure of this cluster is matured less than in other clusters.
- NorNeLux (Netherlands, Sweden, Denmark, Finland, Luxembourg): this group of countries are medium sized in terms of population showing demographical compositions similar to the EU trend, yet with many highly educated people, living in average urbanised environments. The economic prosperity of the Nordic countries, Netherlands and Luxembourg is above average. These countries have been relatively long with the EU and share relatively decentral political decision-making, with high governance standards. The wider data and digital capacities of these countries are highly matured.
- Baltics (Lithuania, Latvia, Estonia): this group of countries have relatively small populations with similar demographic structures and educational levels as found elsewhere in the EU. Urbanisation levels are above the EU tendency. The economic context and climate are slightly less optimal than elsewhere in the EU. Furthermore, the Baltic states have joined the EU more recently than countries in some other clusters. Political decision-making processes are as (de)central as in the EU at large, with average governance standards. The data and digital infrastructures are on par with the rest of the EU too.
- Island-based nations (Ireland, Cyprus, Malta): this group of countries have fairly small and young populations, with a relatively highly educated workforce. Comparatively, many people live in the urban parts of the islands where these nations are situated. Economic variables sit around the EU average. Besides medium to long EU memberships, these countries share highly centralised levels of political decision-making and average governance standards. The data and digital environment of this cluster can be characterised as (above) average.
In terms of open data maturity, some groups of countries perform (slightly) better than others. However, these differences are not substantial from a statistical point of view, based on one-way Analysis of Variance (ANOVA) and Tukey Honestly Significant Difference (HSD) post-hoc statistical test. In fact, the open data maturity levels of the Clusters 1, 2 and 3 centre closely around the EU27 average of 84%, with respective scores of 83%, 84% and 82%. Even though Cluster 4 averages 93% and Cluster 5 performs below average with 79%, differences are not statistically significant compared to each other. In other words, the five country clusters perform relatively alike.
Moreover, different performances also occur within each of the clusters. Some of the country performances within a specific cluster do show statistical gaps, meaning a country outperforms or underperforms one or several peer countries. For example, in the first group of countries, France outperforms most of its cluster peers, while Greece underperforms relative to countries like Germany, Italy, Spain, Belgium and Portugal. In its country cluster, Poland outperforms Croatia and Bulgaria, while the open data maturity of countries in this cluster is fairly comparable, including those of Romania, Czechia, Hungary, Austria, Slovakia and Slovenia. Furthermore, Denmark outperforms most peers, while the Netherlands, Sweden, Finland and Luxembourg perform much alike. In the last cluster, it becomes visible that Malta lags behind its peers Cyprus and Ireland, even though these countries have greater similarities looking at their macro contextual characteristics.
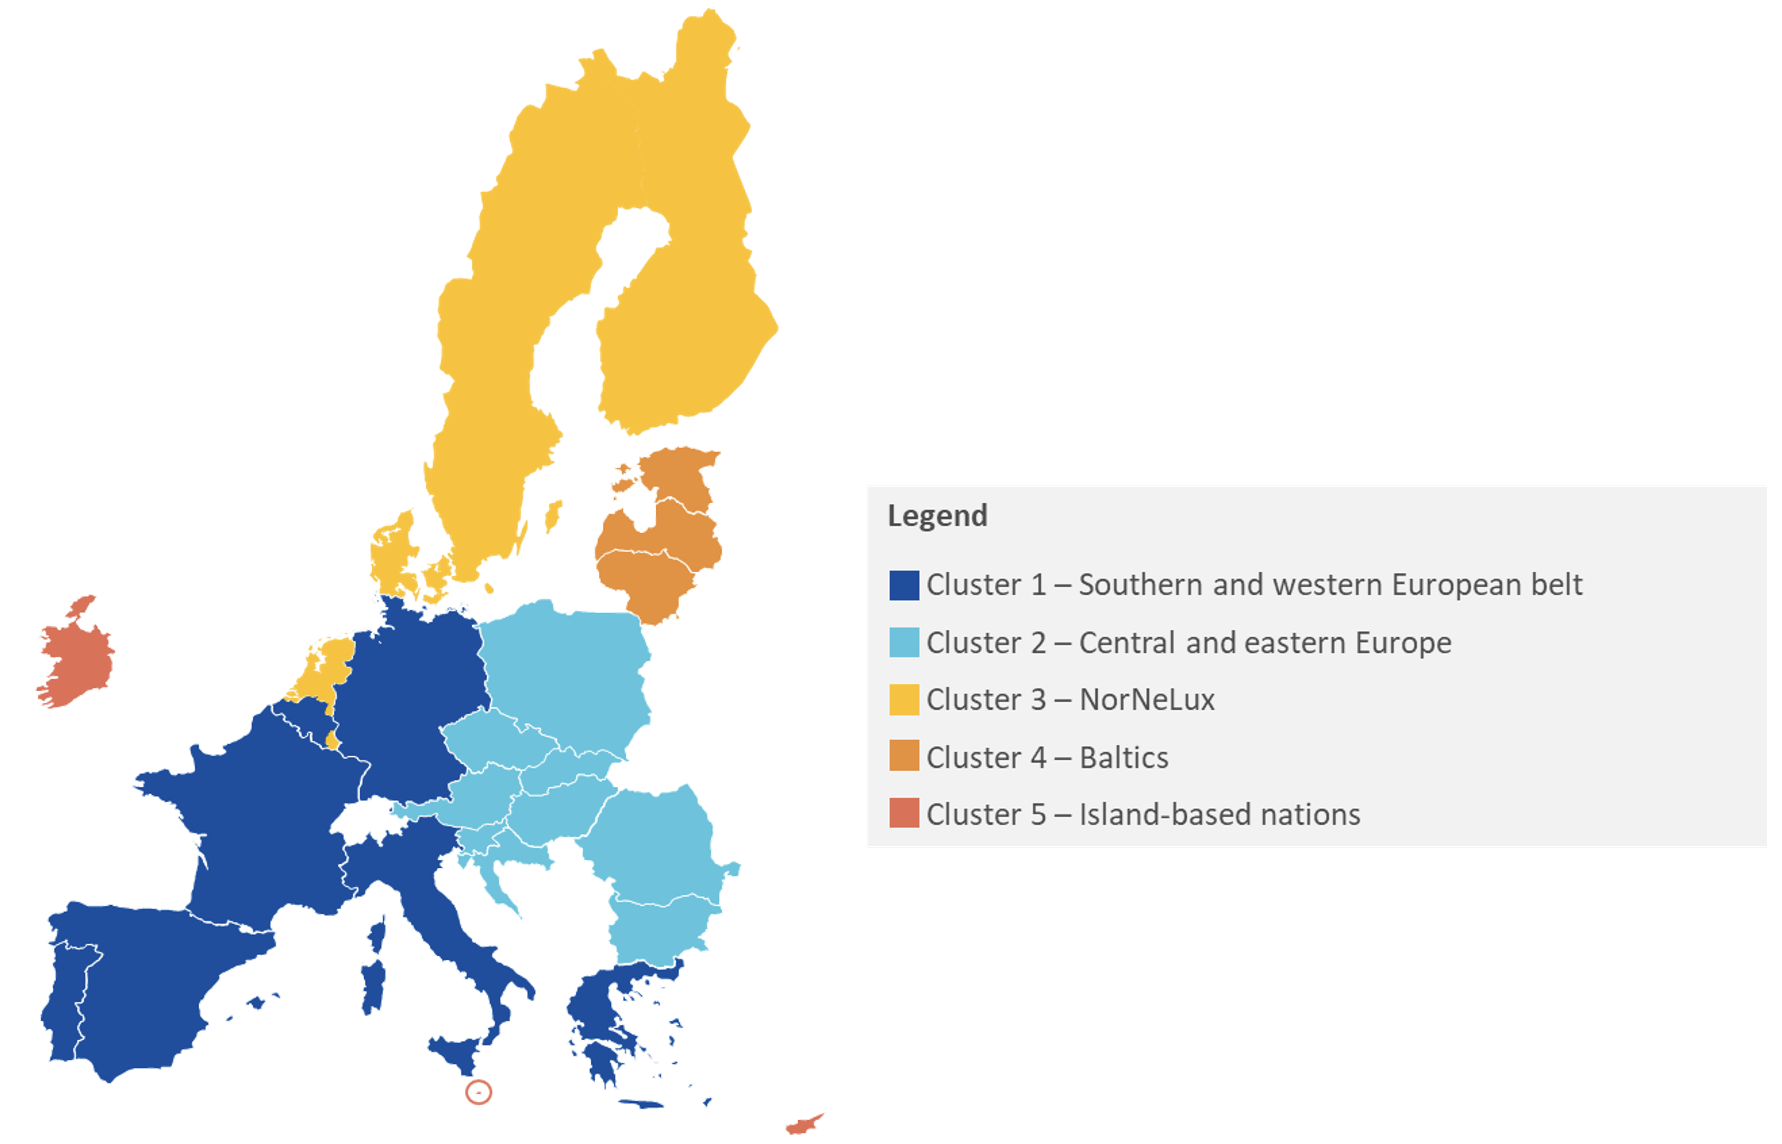
Figure 15: Macro EU country clusters
Overview of macro context characteristics
The following statistical variables were used in the clustering analysis (leaving out less relevant nominal variables*). The full dataset is provided in a separate attachment.
| Country context characteristics | Description | Measurement frequency | Reference year | Coverage | Source |
| Economic | |||||
| GDP per capita (in PPS) | The gross domestic product per capita in Purchasing Power Standards shows the economic output per person adjusted for differences in price levels. | Annually | 2024 | EU27+ | Eurostat |
| Unemployment rate | Share of the labour force without work. | Annually | 2024 | EU27+ | Eurostat |
| Inflation rate | The annual percentage change in the price index. | Annually | 2024 | EU27+ | Eurostat |
| Government debt as % of GDP | Economic ratio between a country's total government debt and its gross domestic product. | Annually | 2024 | EU27 | Eurostat |
| Social and cultural | |||||
| Population size | The total number of people residing in a country. | Annually | 2025 | EU27+ | Eurostat |
| Demographic dependency ratio | Ratio between the number of persons aged 65 and over and the number of persons aged between 15 and 64. | Annually | 2024 | EU27+ | Eurostat |
| Linguistic regions* | Countries with the same language as official language. | Annually | 2024 | EU27 | Eurostat |
| Education level | Share of people with tertiary educational attainment (ISCED levels 5-8). | Annually | 2024 | EU27+ | Eurostat |
| Geographical | |||||
| Geographical regions* | EuroVoc Geographic Regions: Northern Europe, Western Europe, Central and Eastern Europe, and Southern Europe. | Annually | 2025 | EU27+ | Publications Office of the EU |
| Neighbouring countries* | EU countries that share a border. | Annually | 2025 | EU27+ | Publications Office of the EU |
| Urbanisation level | Share of the population living in cities. | Annually | 2024 | EU27 | Eurostat |
| Political | |||||
| Political system* | Form of government being a presidential republic, semi-presidential republic, parliamentary republic or parliamentary constitutional monarchy. | One-off | 2020 | EU27 | European Committee of the Regions |
| Degree of self-governance* | Allocation of competence, varying from a unitary state, devolved state, federacy or federation. | One-off | 2020 | EU27 | European Committee of the Regions |
| (De)centralisation | Degree of political, administrative and fiscal decision-making being central or decentral. | One-off | 2020 | EU27 | European Committee of the Regions |
| EU Membership (duration) | Duration of the European Union memberships (since European Coal and Steel Community). | Annually | 2025 | EU27 | Commission Services |
| Good Governance (composite) | Levels of Voice and Accountability, Political Stability and Absence of Violence/Terrorism, Government Effectiveness, Regulatory Quality, Rule of Law, and Control of Corruption. | Annually | 2024 | EU27+ | World Bank |
| Data and digital characteristics | |||||
| Basic digital skills | Individuals with basic or above basic overall digital skills. | Biennially | 2023 | EU27+ | Eurostat |
| Data and information skills | Individuals check the truthfulness of the information or content found on the internet. | Biennially | 2023 | EU27+ | Eurostat |
| ICT specialists | Employed ICT specialists as percentage of the total employment. | Annually | 2024 | EU27+ | Eurostat |
| Cloud uptake | The share of enterprises that buy cloud computing services used over the internet. | Annually | 2023 | EU27+ | Eurostat |
| AI uptake | The share of enterprises that use at least one type of AI technologies. | Annually | 2024 | EU27+ | Eurostat |
| Data analytics uptake | The share of enterprises with data analytics performed by the enterprise's own employees or by an external provider. | Annually | 2023 | EU27+ | Eurostat |
| R&D expenditure | Research and development expenditure as percentage of the gross domestic product. | Annually | 2023 | EU27+ | Eurostat |
| Overall 5G coverage | Broadband internet coverage with 5G technology. | Annually | 2024 | EU27 | Eurostat |
Table 1: Overview of relevant secondary statistical data sources for the EU27
Conclusions and next steps
Implementation considerations for the 2026 Open Data Maturity Assessment
In essence, the country profiling exercise repurposes the Open Data Maturity Assessment from a normative evaluation tool into a descriptive analytical framework. Using an inductive, two-phase approach, questions from the Open Data Maturity questionnaire were ungrouped and analysed to identify clusters of shared behaviours, which were refined into six descriptive parameters: Governance Approach, Open Data Quality Strategy, Domain of Impact, Funding, Portal Technical Foundations, and Transposition of the Open Data Directive. These parameters were then operationalised using a mix of original questionnaire items and select external datasets, enabling country profiles that reveal patterns in open data practices.
While this framework is designed to remain dynamic and adaptable, evolving alongside technological and policy developments, insights from country consultations and reflections by the research team highlighted opportunities to refine these sources in future iterations. Firstly, the existing inquiry about a country’s governance model was seen as vague, with countries suggesting that the question and the categories used (e.g., top-down, hybrid, bottom-up) could be clarified further. This was also noted for the Domains of Impact parameter. Member States highlighted the need for a clearer, more specific definition of “impact”, as the current one in the Impact dimension’s questions is seen as too abstract. Furthermore, clear definitions are important, the more so as the Open Data Maturity Assessment relies on self-declared survey data from government representatives.
Regarding the Funding parameter, it was noted that the current focus on national portal funding is too narrow; a broader question could be added to capture all sources of funding supporting open data activities across different levels of government, different types of spendings and long-term budgeting. For the Transposition of the Open Data Directive, a predefined categorisation, potentially based on the typology developed in this study, could be introduced to allow countries to self-identify their transposition approach. This would enhance the accuracy and consistency of the data collected. Lastly, for the Portal Technical Foundations parameter, Member States noted that additional questions could help better capture the diversity and complexity of national portal infrastructures. While the Portal section of the Open Data Maturity questionnaire already contains a wealth of relevant questions, there is a need to distinguish which of these are most critical for profiling purposes. These insights point to the potential for a more nuanced and comprehensive evidence base in future iterations, improving both the accuracy and comparability of country profiles.
These country profiles can be most effectively leveraged through the mini-site, an interactive and accessible outlet designed to country level exploration. The mini-site could feature the ability to view each country’s individual classification under each of the six descriptive parameters, and sort countries accordingly, as similar as to sorting open data maturity scores by country name. Each profile would be accompanied by clear labels, definitions, and the underlying evidence base, including the specific Open Data Maturity questionnaire questions and any supplementary data sources used. This transparency would help countries better understand how their profile was constructed and why others are in the same or a different profile. By visualising this information interactively, the mini-site would enable countries to identify relevant peers and simultaneously contextualise their performance across the four dimensions of the Open Data Maturity study.
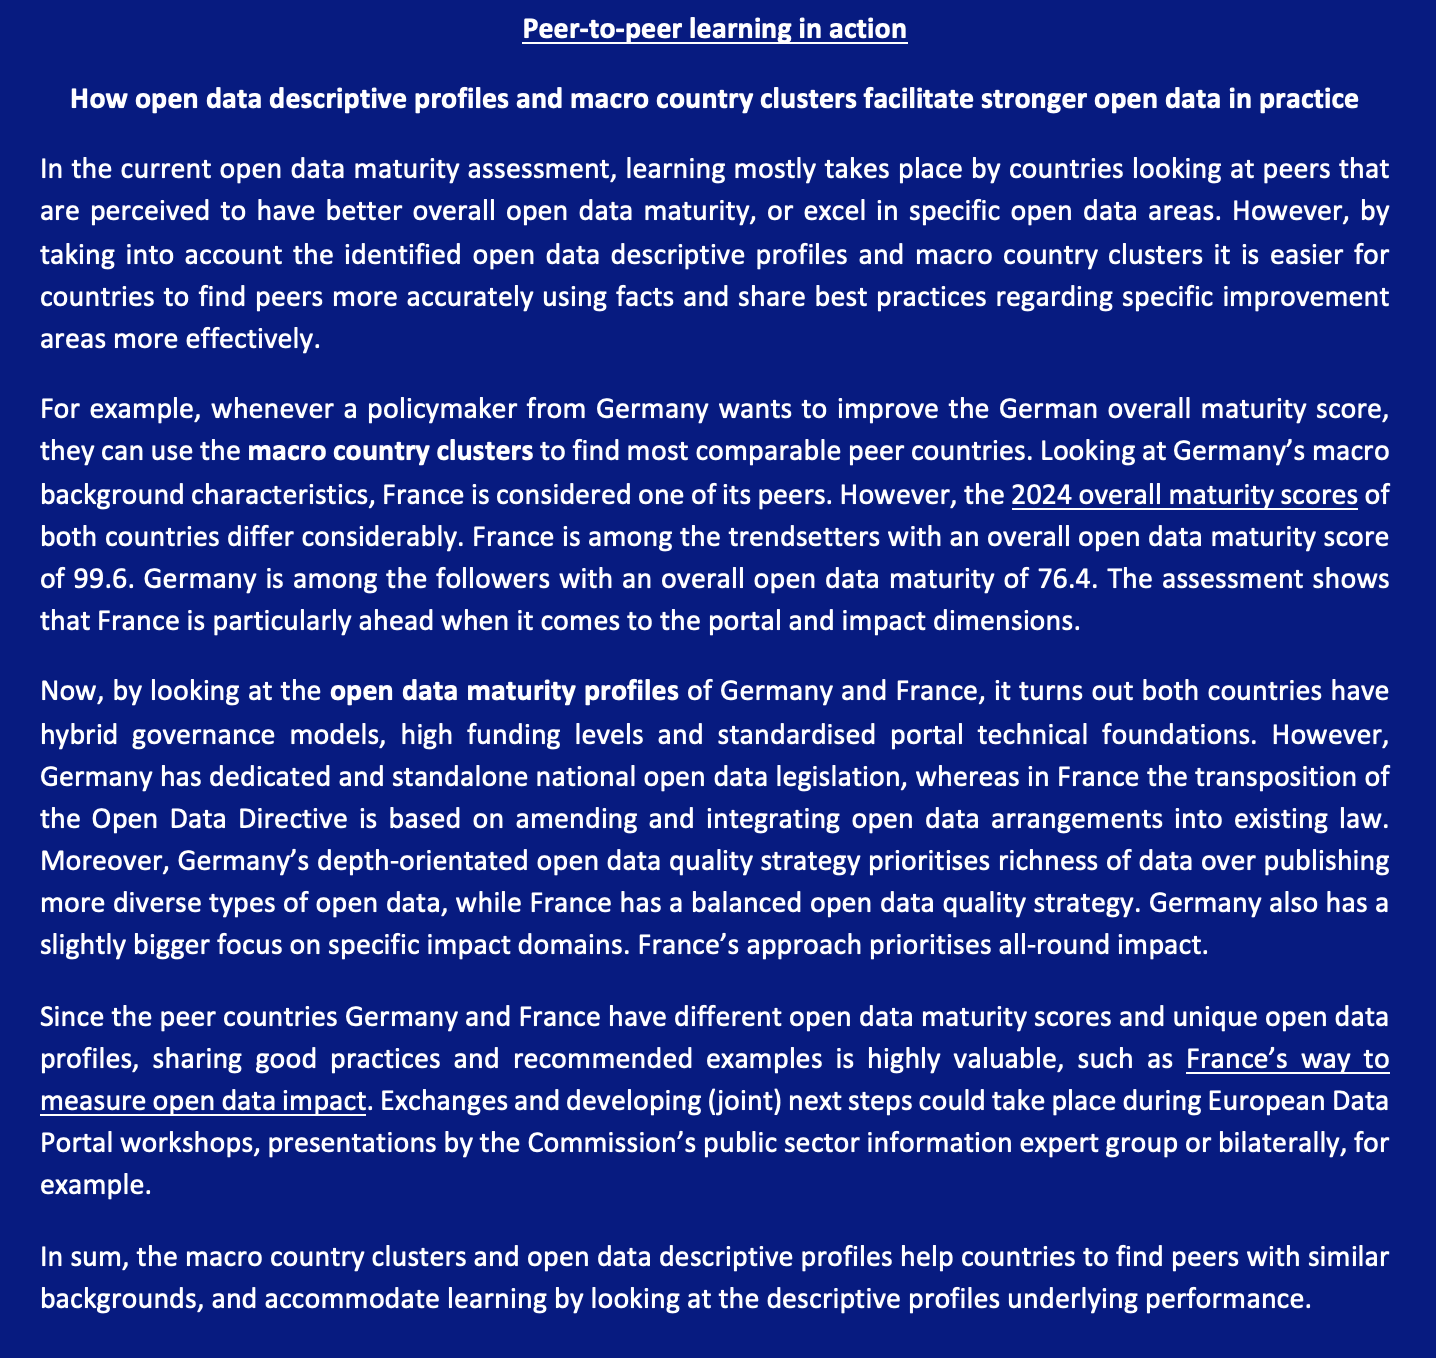
Figure 16: Peer-to-peer learning in action
With regards to the macro country clustering, it should be noted that the identified peer groups could be included in the 2026 edition of the Open Data Maturity Report and mini-site. For the mini-site specifically, clusters could be used to group countries to present their scores, as similar as to grouping scores by EU Member States and non-EU countries. From a statistical point of view, countries in the Southern and Western European Belt, Central and Eastern Europe, NorNeLux, Baltics and Island-based nations are most similar. They share most economic, social and cultural, geographical, political and digital country characteristics. Comparing the open data maturity of countries within those clusters offers most fair comparisons. At the same time, initial responses from Member States indicate that the statistical clusters are relevant for comparison, but cross-country learning is much broader. Some countries may prefer to simply look at the country size, neighbouring countries or government structure alone to compare their results with other countries. Moreover, regardless of the comparability there is a need to compare with top-performing countries and learn from best practices. For the mini-website and country pages this means that filtering and comparison options should allow for a certain degree of flexibility.
Overall, both the open data profiles and macro country clusters can help to promote peer-to-peer learning and inform actionable policy directions, beyond countries’ open data maturity performance. It is recommended to keep the existing performance-based groups of Beginners, Followers, Fast-trackers, and Trendsetters, and to combine with the specific open data profiles and macro country clusters to put these score-based performances into perspective. This will help to set more meaningful and tailored policy recommendations too, sparking collaboration and accelerating open data maturity progress in Europe.
Feasibility and recommendations for extending the framework to non-EU countries
Considering the ambition to include all countries participating in the Open Data Maturity benchmarking, this study extended the descriptive profiling exercise beyond the EU27. This allowed us to explore how non-EU27 countries align with the developed framework, offering early insights into their potential classification. These findings demonstrated that the profiling approach is flexible enough to accommodate a broader set of national contexts, while also highlighting areas where the framework could be refined to ensure continued relevance and inclusivity. Looking ahead, expanding the profiling to all participating countries presents an opportunity to capture greater nuance in national approaches, while still enabling meaningful clustering and comparison.
Extending the macro country clustering framework to non-EU countries is less realistic than for the open data profiles. More than half of the 19 macro statistical sources cover the non-EU countries that participate in the Open Data Maturity Assessment. However, it should be noted that data is more widely available for the three European Free Trade Association (EFTA) countries Iceland, Norway and Switzerland, compared to the four EU candidate countries Albania, Bosnia and Herzegovina, Serbia and Ukraine. Also, in several cases the reference years for the data of the non-EU countries indicates less timely and actual data. Although a partial country clustering is expected to be possible, the missing values for some variables may hinder a full clustering analysis, lowering the quality of the clusters to which these non-EU countries would belong. Should the clustering rely on country size, neighbouring countries or government structure alone, the grouping is expected to be possible and stable over time.
[1] https://data.europa.eu/en/publications/open-data-maturity
[2] https://eur-lex.europa.eu/legal-content/EN/TXT/?uri=celex%3A32019L1024
[3] https://odin.opendatawatch.com/
[4] https://opendatabarometer.org/?_year=2017&indicator=ODB
[5] https://globaldatabarometer.org/
[7] https://www.oecd.org/en/publications/2023-oecd-open-useful-and-re-usable-data-ourdata-index_a37f51c3-en.html; https://www.oecd.org/en/topics/digital-government.html
[8] https://ai-watch.ec.europa.eu/publications/ai-watch-european-landscape-use-artificial-intelligence-public-sector_en
[9] https://publicadministration.un.org/egovkb/en-us/About/Overview/-E-Government-Development-Index
[10] https://www.itu.int/dms_pub/itu-d/opb/ind/D-IND-ICT_MDD-2025-1-PDF-E.pdf
[11] https://digital-strategy.ec.europa.eu/en/news/eu-egovernment-report-2015-shows-online-public-services-europe-are-smart-could-be-smarter
[12] https://digital-strategy.ec.europa.eu/en/library/egovernment-benchmark-2022
[13] https://www.huawei.com/en/gdi
[14] https://www.capgemini.com/ar-es/wp-content/uploads/sites/28/2023/02/Understanding-Digital-Mastery-Report-2July18-17.pdf
[15] https://www.gartner.com/en/information-technology/topics/ai-in-government
[16] https://www.bcg.com/publications/2024/which-economies-are-ready-for-ai
[17] See Annex 5.1 for the full list of questions and their relevant ID
[18] See Annex for the full list of questions and their relevant ID.
[19] See Annex for the full list of questions and their relevant ID.
[20] See Annex for the full list of questions and their relevant ID.
[21] See Annex for the full list of questions and their relevant ID.
[22] https://digital-strategy.ec.europa.eu/en/policies/public-sector-information-directive
[23] EEA members and EU candidate countries are generally expected to align with the Open Data Directive, even though they face no legal obligation or sanctions for non‑compliance.
[24] https://ec.europa.eu/eurostat/cache/countryfacts/
[25] https://european-union.europa.eu/principles-countries-history/eu-countries_en
[26] https://ec.europa.eu/eurostat/databrowser/view/tps00001/default/table?lang=en&category=t_demo.t_demo_pop
[27] https://ec.europa.eu/eurostat/databrowser/view/tps00198/default/table?lang=en&category=t_demo.t_demo_ind
[28] https://ec.europa.eu/eurostat/databrowser/view/edat_lfs_9903__custom_17376930/default/table?lang=en
[29] https://europa.eu/eurobarometer/surveys/detail/2979
[30] https://hdr.undp.org/data-center/human-development-index#/indicies/HDI
[31] https://eur-lex.europa.eu/browse/eurovoc.html?params=72#arrow_7206
[32] https://ec.europa.eu/eurostat/databrowser/view/ilc_lvho01/default/table?lang=en&category=degurb.degurb_livcon
[33] https://portal.cor.europa.eu/divisionpowers/Pages/default.aspx
[34] https://portal.cor.europa.eu/divisionpowers/Pages/default.aspx
[35] https://www.worldbank.org/en/publication/worldwide-governance-indicators
[36] https://bridgenetwork.eu/rise-regional-groups-eu/
[37] https://digital-strategy.ec.europa.eu/en/policies/2025-state-digital-decade-package
[38] https://ec.europa.eu/eurostat/statistics-explained/index.php?title=Skills_for_the_digital_age
[39] https://interoperable-europe.ec.europa.eu/collection/portal/country-knowledge
[40] https://ec-europa.github.io/bdti-infrastructure/blocks/bb_knime/