
Moving goods across Europe: Insights into the EU’s supply chains
How transport modes differ, where freight activity is concentrated and what the EU trades with the rest of the world
How does the food on your table, the clothes in your wardrobe or the phone in your pocket get to you? Every day, huge volumes of goods move across Europe by road, rail, air, sea and inland waterways. Transport is a vital part of the supply chains that connect producers, ports, warehouses, businesses and consumers across the continent.
Using Eurostat transport and trade data, this data story explores how freight moves across the EU, where transport activity is concentrated and what the EU trades with the rest of the world.
Which transport modes dominate freight transport across the EU?
Sea, road, rail, inland waterway and air transport all move freight across the EU but their roles differ dramatically, both at the EU level and from one EU Member State to another.
Figure 1 compares freight transport performance in tonne-kilometres, a measure that takes into account both the weight of the goods and the distance they travel. In 2024, sea transport accounted for 67.0 % of EU freight transport performance and road transport for 25.7 %. Together, the two modes represented almost 93 % of the total. Rail transport accounted for 5.4 %, inland waterway transport for 1.7 % and air transport for just 0.2 % by this measure.
Behind this EU-wide picture are striking national differences. Maritime transport dominates in many coastal and island Member States, including Greece, Cyprus and Portugal, while road transport is the main mode in several landlocked and central European countries. Rail transport also plays a much larger role in some Member States than its EU-wide share suggests, exceeding 30 % in Lithuania and Austria, while inland waterway transport is particularly important in Romania.
These differences between Member States are much larger than the changes in the EU-wide transport mix over time. Between 2014 and 2024, road transport was the only mode to gain share, increasing by 3.3 percentage points (pp), while sea transport remained dominant but fell by 2.5 pp. Rail transport and inland waterway transport declined by 0.3 and 0.5 pp, respectively, while air transport was virtually unchanged.
The contrast is clear: Member States rely on very different combinations of transport modes, while the overall EU freight mix has changed only gradually over the past decade.
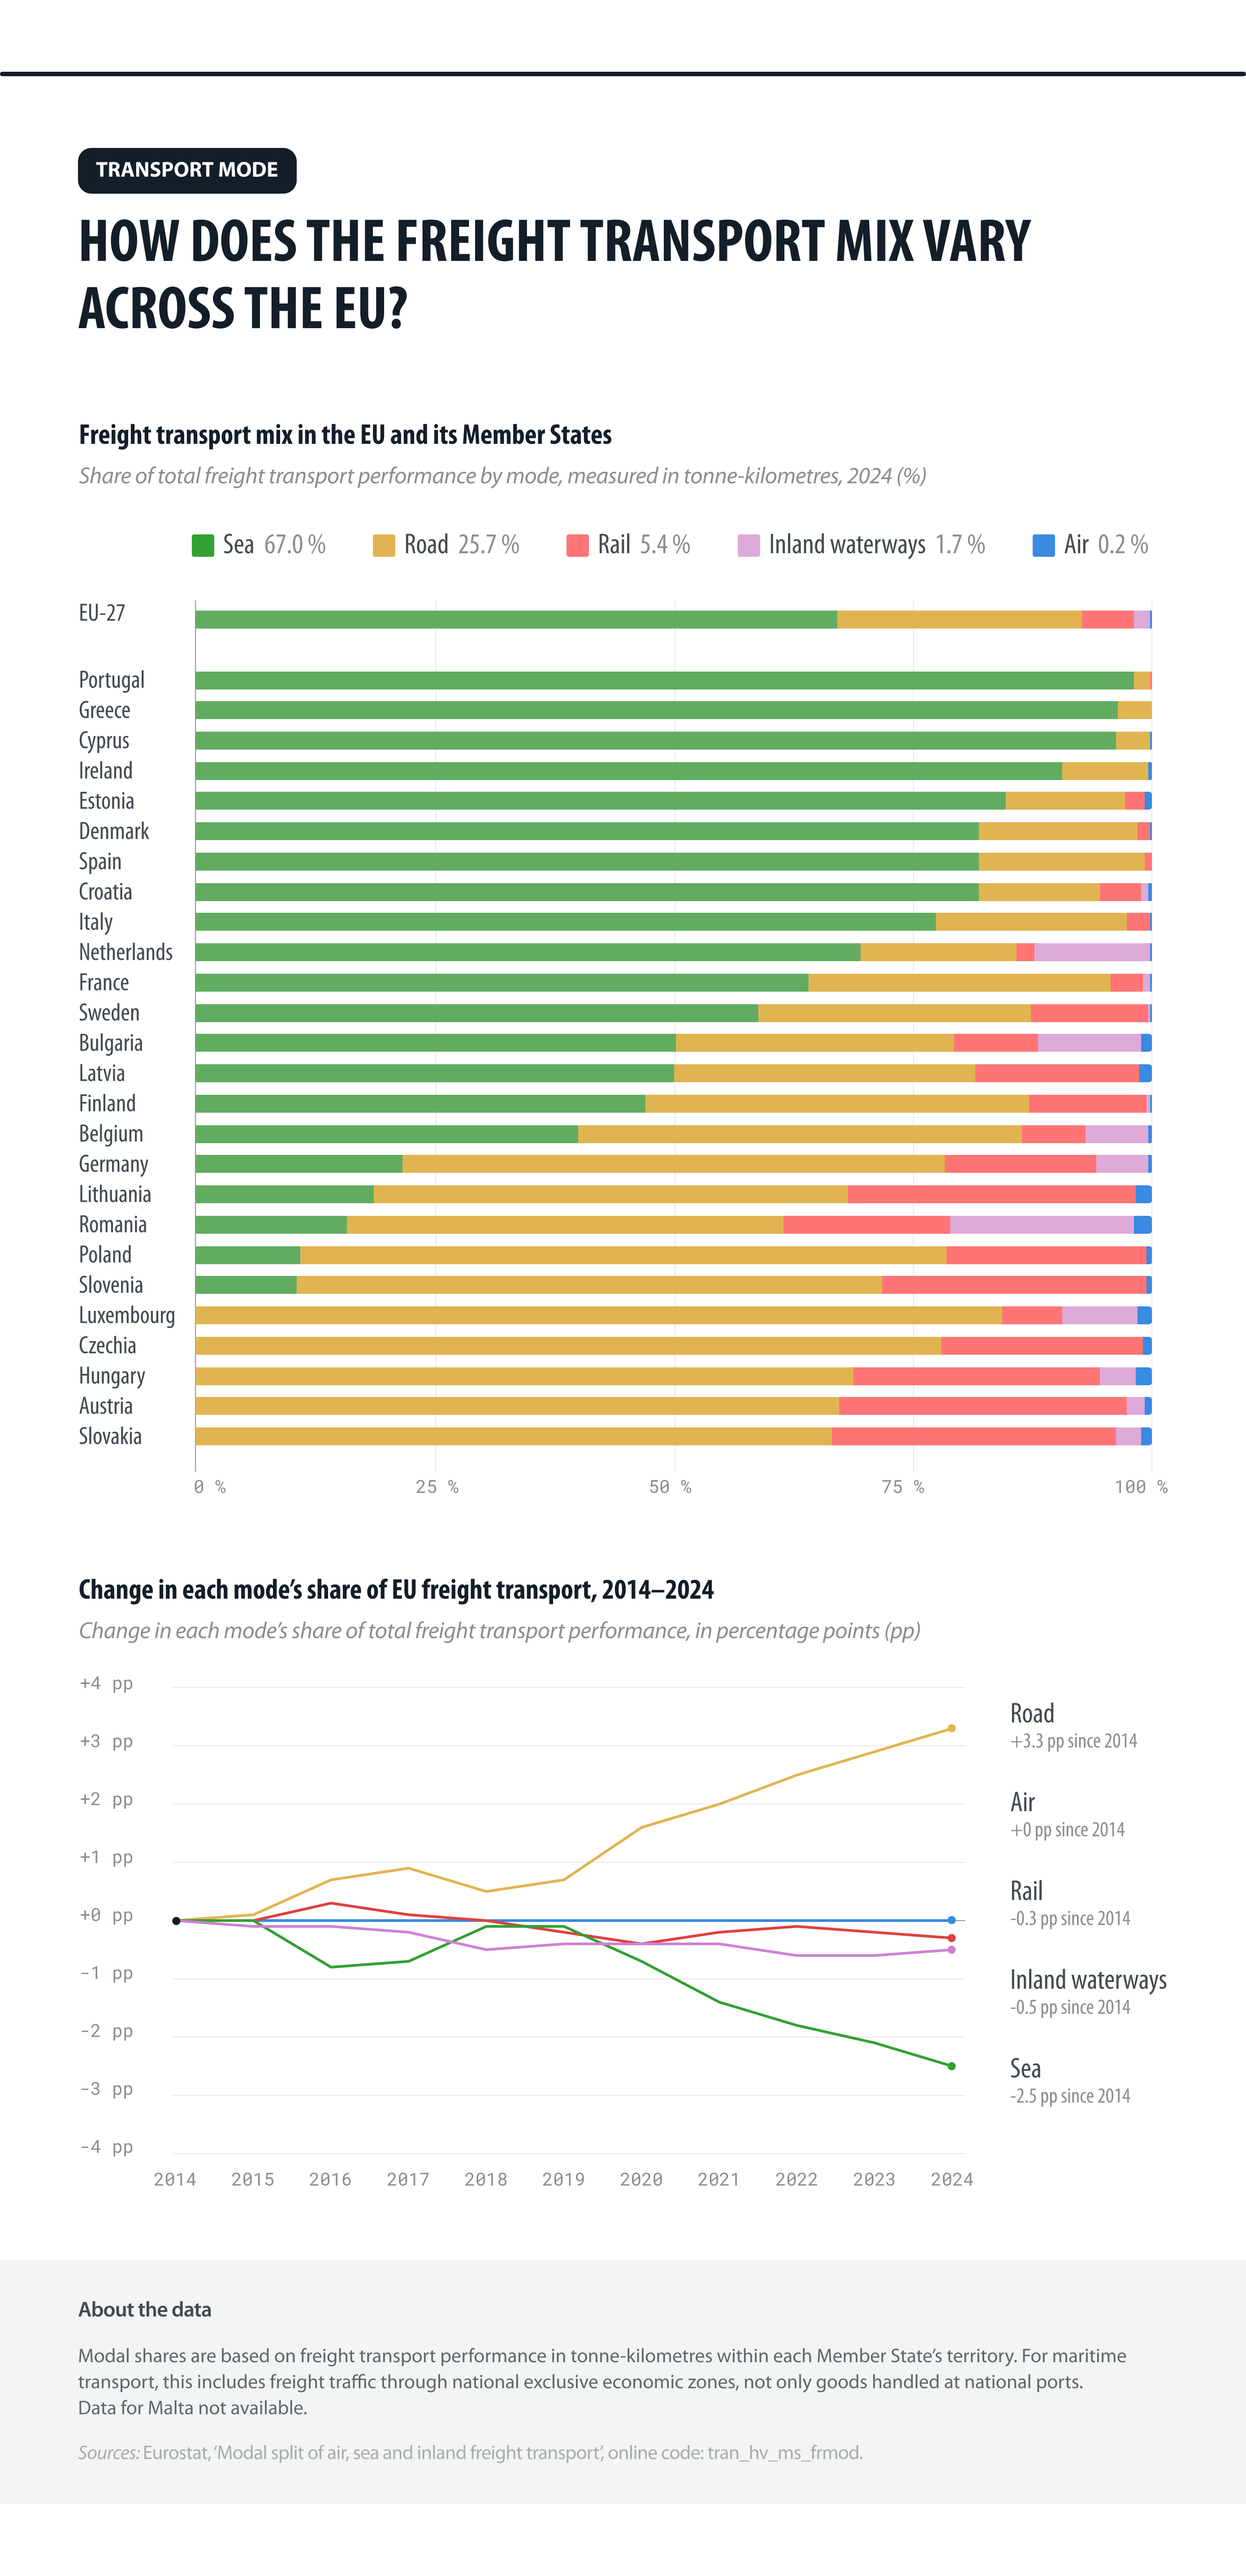
Figure 1: Freight transport mix in the EU and its Member States
Source: Eurostat / European Data Portal.
Where is freight activity concentrated across the EU?
The EU-wide transport mix is only part of the picture. Where is freight activity actually concentrated?
Figure 2 maps freight volumes loaded and unloaded by road, sea and air across EU regions in 2024. Unlike Figure 1, which measures transport performance in tonne-kilometres, these maps show physical freight volumes in tonnes. Sea and air data are shown at NUTS 2 (nomenclature of territorial units for statistics) level, while road data are available at the more detailed NUTS 3 level, so the maps are best used to identify geographical patterns within each mode rather than to compare their degree of concentration directly.
Air freight has a small number of particularly prominent regions. The highest volumes were recorded in Darmstadt (1.99 million tonnes), Île-de-France (1.98 million tonnes) and Noord-Holland (1.50 million tonnes), which include Frankfurt Airport, Paris Charles de Gaulle Airport and Amsterdam Schiphol Airport, respectively.
Sea freight follows a different geography, centred on major coastal regions. Zuid-Holland and Antwerpen stand out, with 407 million and 244 million tonnes, respectively, in 2024. Major maritime freight activity is also visible along the North Sea, Atlantic Ocean, Baltic Sea and Mediterranean Sea coastlines.
Road freight shows a much more widespread regional pattern, with substantial activity visible across both inland and coastal parts of the EU. Rather than being centred around a relatively small number of ports or airports, road loading and unloading takes place across a dense network of regions.
Together, the maps reveal three distinct geographies of freight: air activity clustered around major airport regions, sea freight centred on coastal gateways and road freight spread across a much broader regional network.
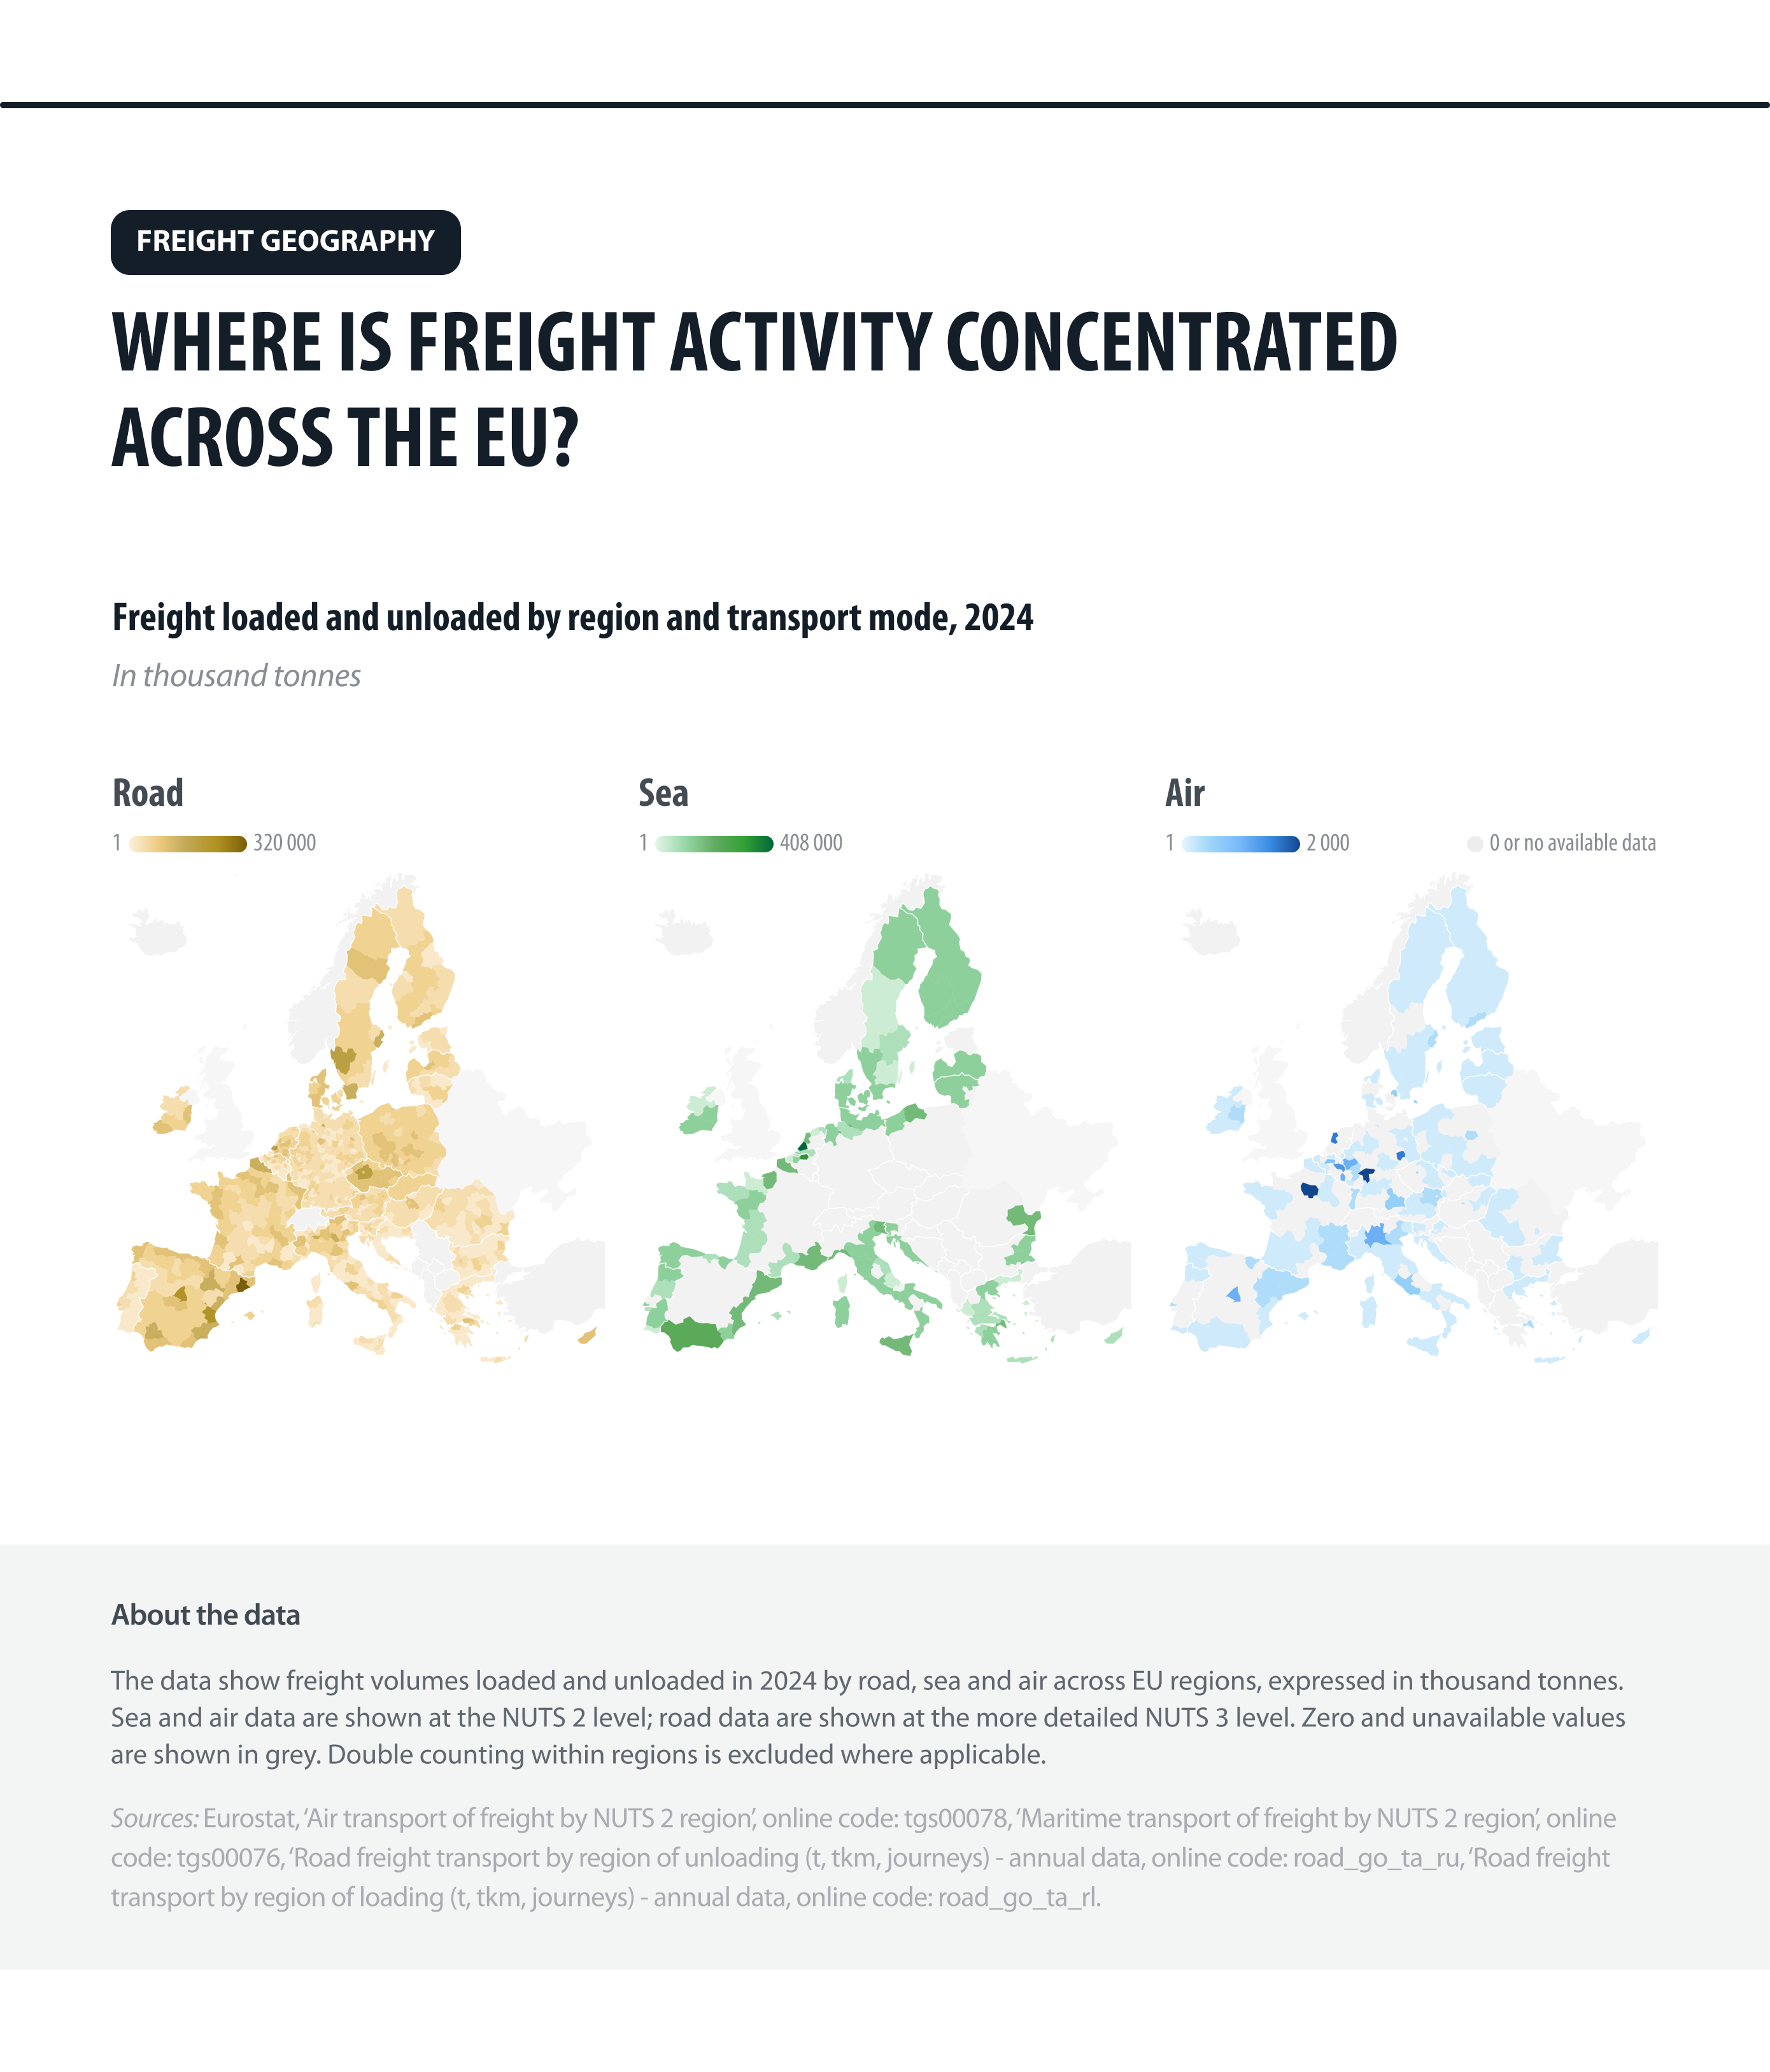
Figure 2: Freight volumes by region and mode of transport in 2024
Sources: Road transport: Eurostat / European Data Portal; air transport: Eurostat / European Data Portal; sea transport: Eurostat / European Data Portal.
Which goods dominate the EU’s trade (by weight)?
The transport networks described above are part of supply chains carrying everything from food and fuels to vehicles and computers. A different dataset gives us another perspective: what does the EU trade with the rest of the world, and in what physical quantities?
Figure 3 shows extra-EU imports and exports between 2017 and 2025, measured in million tonnes. Overall trade by weight declined over the period. Imports remained consistently higher than exports, reaching 1 502 million tonnes in 2025, compared with 649 million tonnes of exports.
The differences between product groups are striking. The broad category covering mining, quarrying, refinery products, fuels, chemicals, electricity, water and waste treatment dominates trade by weight: in 2025, it accounted for around 60 % of the EU’s total extra-EU trade tonnage and more than two thirds of import tonnage. Agriculture, food and related products form the second-largest group, followed by construction-related goods. Together, these three broad categories represented about 90 % of extra-EU trade by weight in 2025.
The balance between imports and exports also varies considerably by product group. Imports outweigh exports particularly strongly in the textile and mining/fuel-related categories. In contrast, exports are higher than imports by weight for the ICT, media and computer-related goods category and for the health and pharmaceuticals category in 2025.
The physical weight of the EU’s trade is therefore highly concentrated: a few broad product groups account for most of the tonnes moving between the EU and the rest of the world, while other categories make up much smaller physical flows.
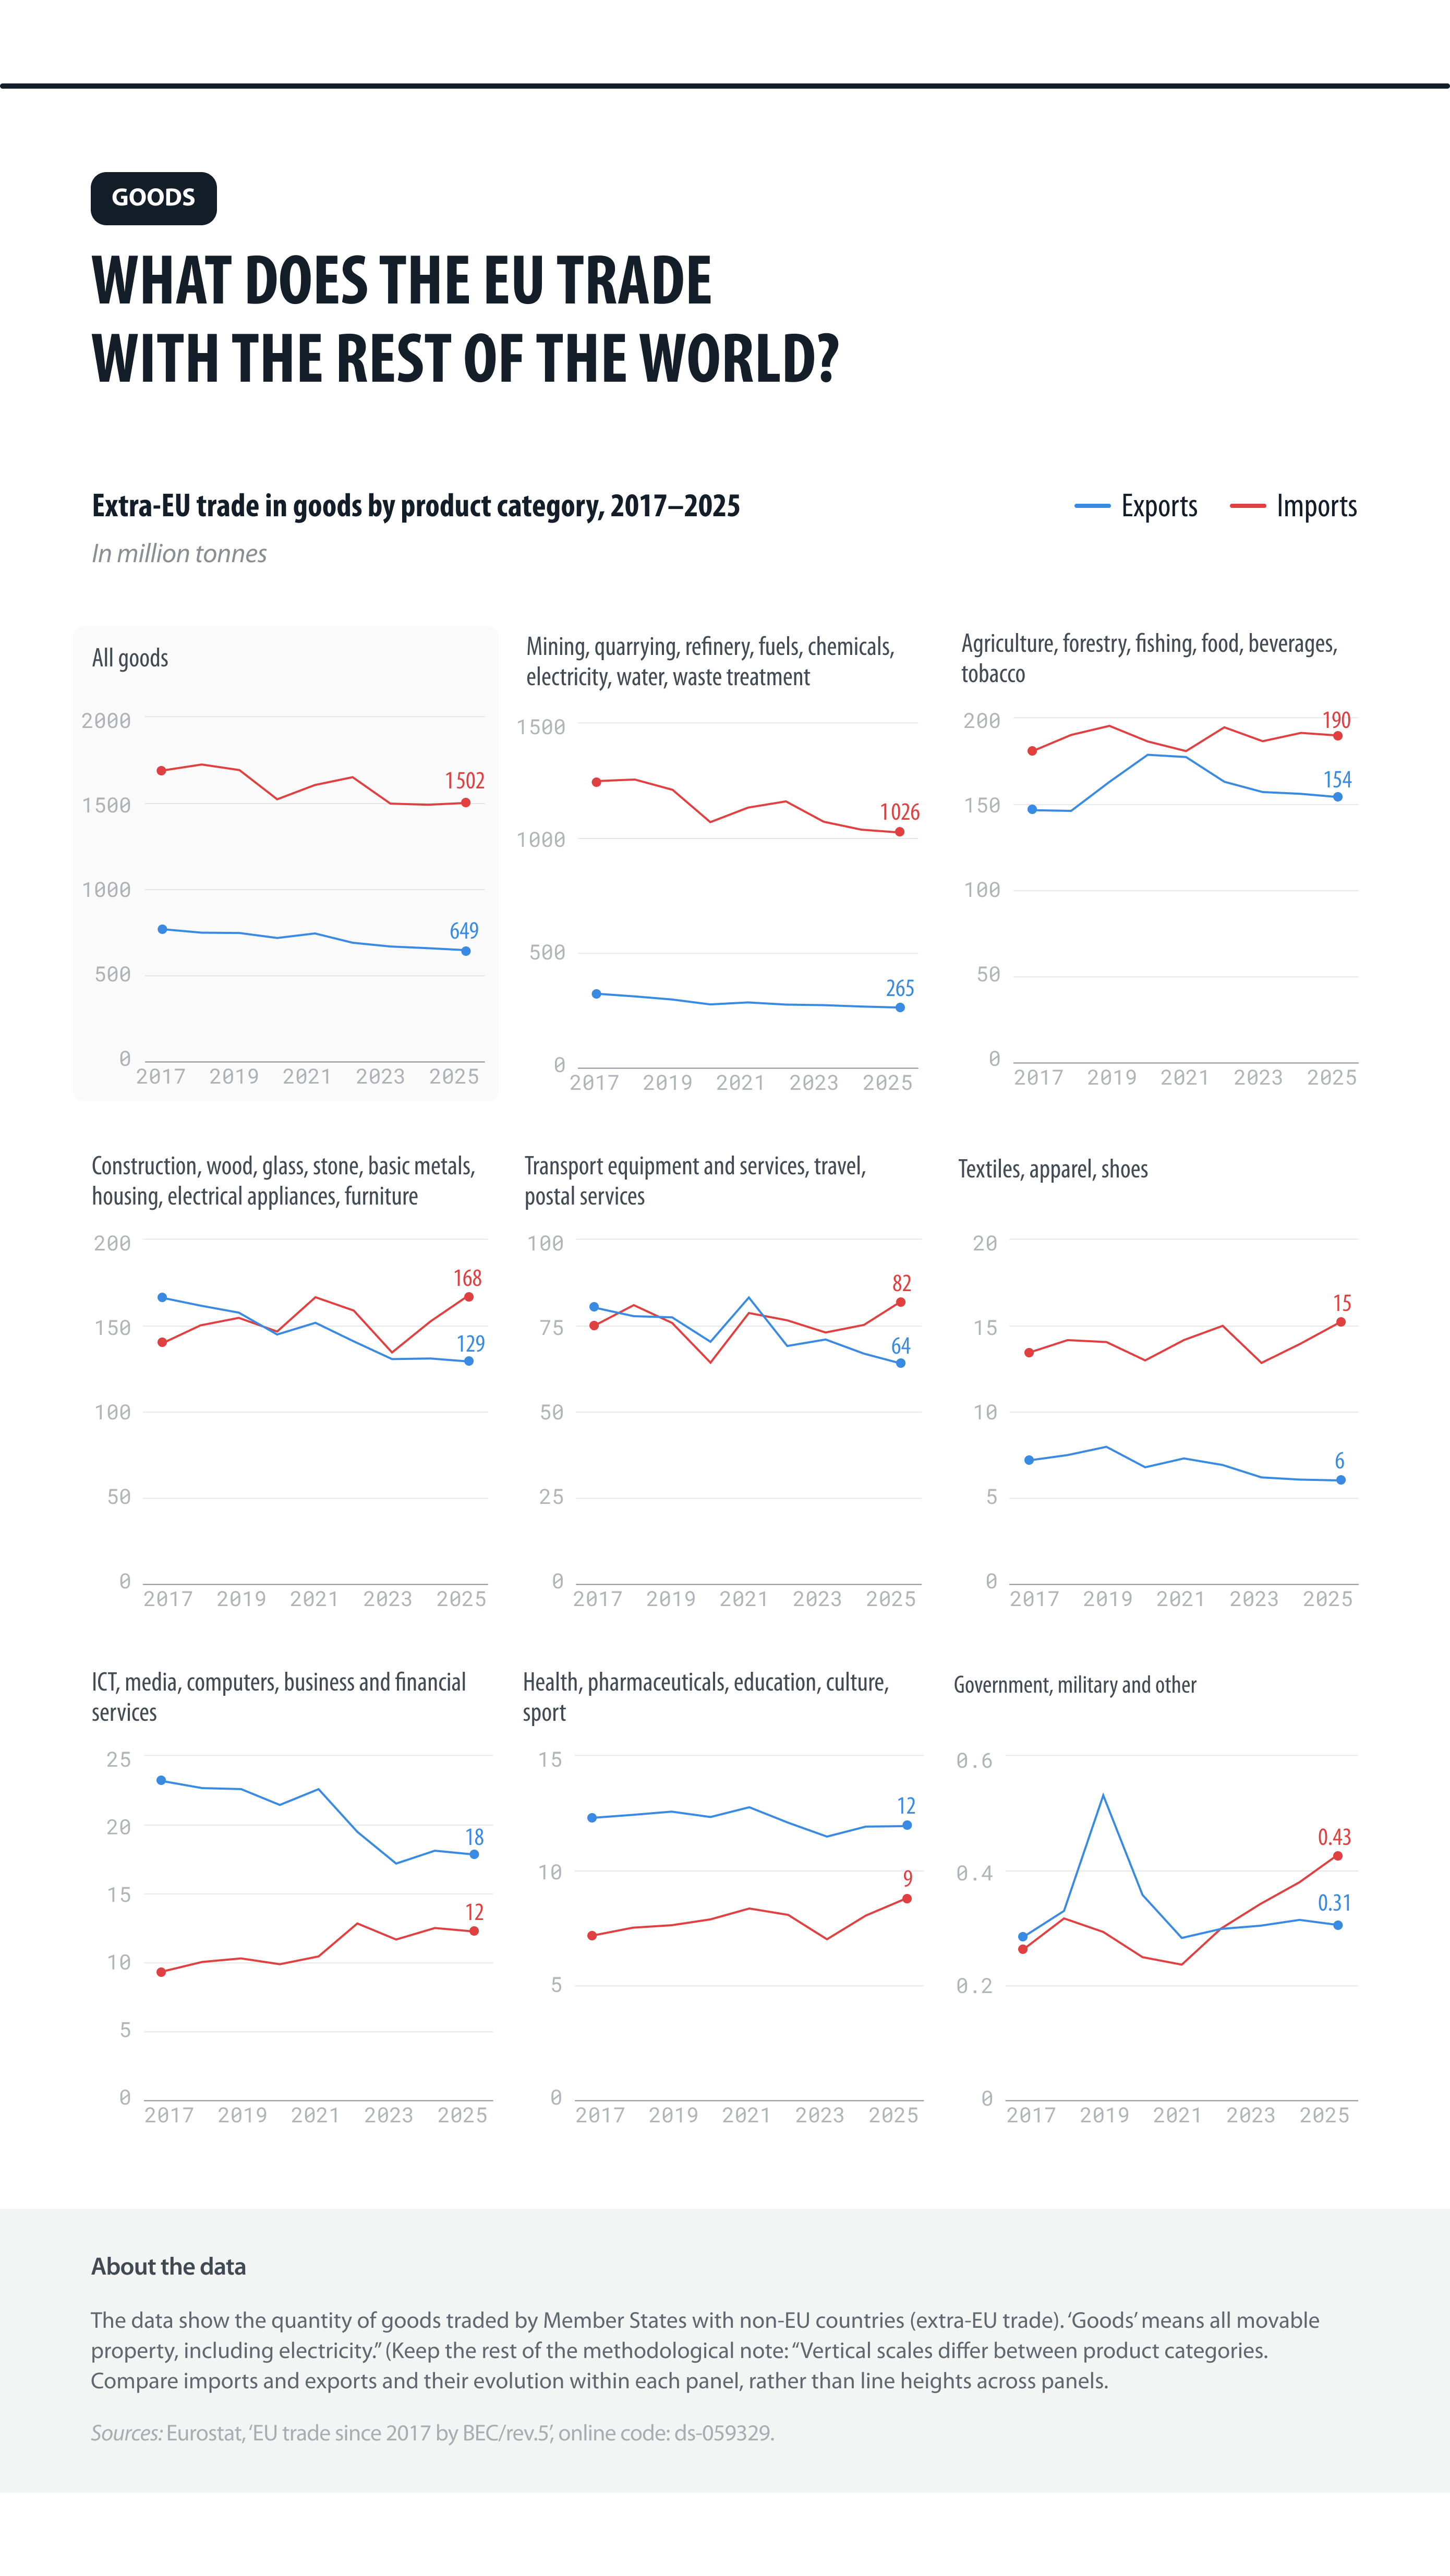
Figure 3: Extra-EU trade in goods by product category, 2017–2025
Source: Eurostat / European Data Portal.
Conclusion
The EU’s supply chains rely on goods moving through very different transport networks. At the EU level, sea and road transport account for most freight transport performance, but the mix varies greatly between Member States and each mode has a distinct geography: major airport regions stand out for air freight and coastal gateways for sea freight, while road activity is spread much more widely.
Physical trade with the rest of the world is also highly concentrated. A few broad product groups account for most extra-EU trade by weight, while import and export patterns vary considerably between categories.
Together, the data show that there is no single pattern behind the movement of goods across the EU: how freight moves, where it is concentrated and what is traded all depend strongly on the mode, place and type of goods involved.