Exploring regional similarities with EU Twinnings
EU Datathon 2020 finalist uses open data to calculate how similar European regions are
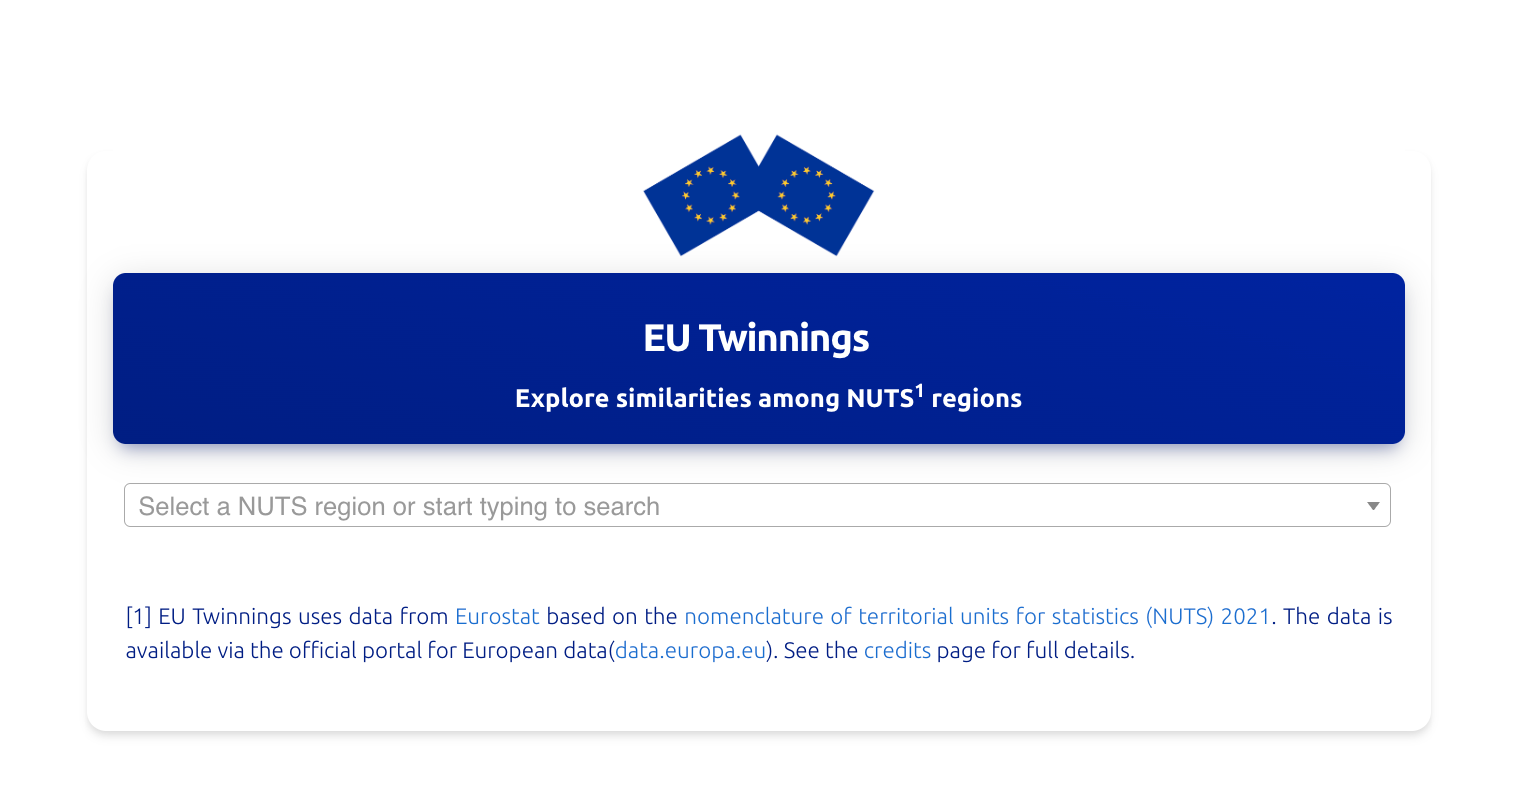
Have you ever wondered how similar different regions across Europe are? What a southern European urban region could have in common with a rural area in eastern Europe? EU Twinnings is a web application that allows the user to engage with European regions by exploring how similar they are. It’s a ‘virtual twinning’ platform that uses EU open data to calculate and visualise a similarity measure.
European migration experience
The origins of the app date back to the EU Datathon 2020, when its developer Giuseppe Sollazzo started to explore the concept of similarity by reflecting on his own life as a European migrant. ‘I was born in Barletta, a medium-sized town in the South of Italy with an economy based on a mixture of industry and agriculture,’ says Giuseppe. ‘Then I moved to Bologna in the North of Italy for my university studies, and finally settled in London, in the United Kingdom, in 2008. Interestingly, the first move was a bigger culture shock than the second, but that got me wondering: could I somehow measure the differences and similarities between different geographical areas?’
How to measure similarity?
Measuring similarity between two regions is easier said than done, because there are multiple variables to consider. Similarity is an abstract concept, and what matters to people can vary as well: some may care more about the weather, the geographical shape or perhaps societal patterns.
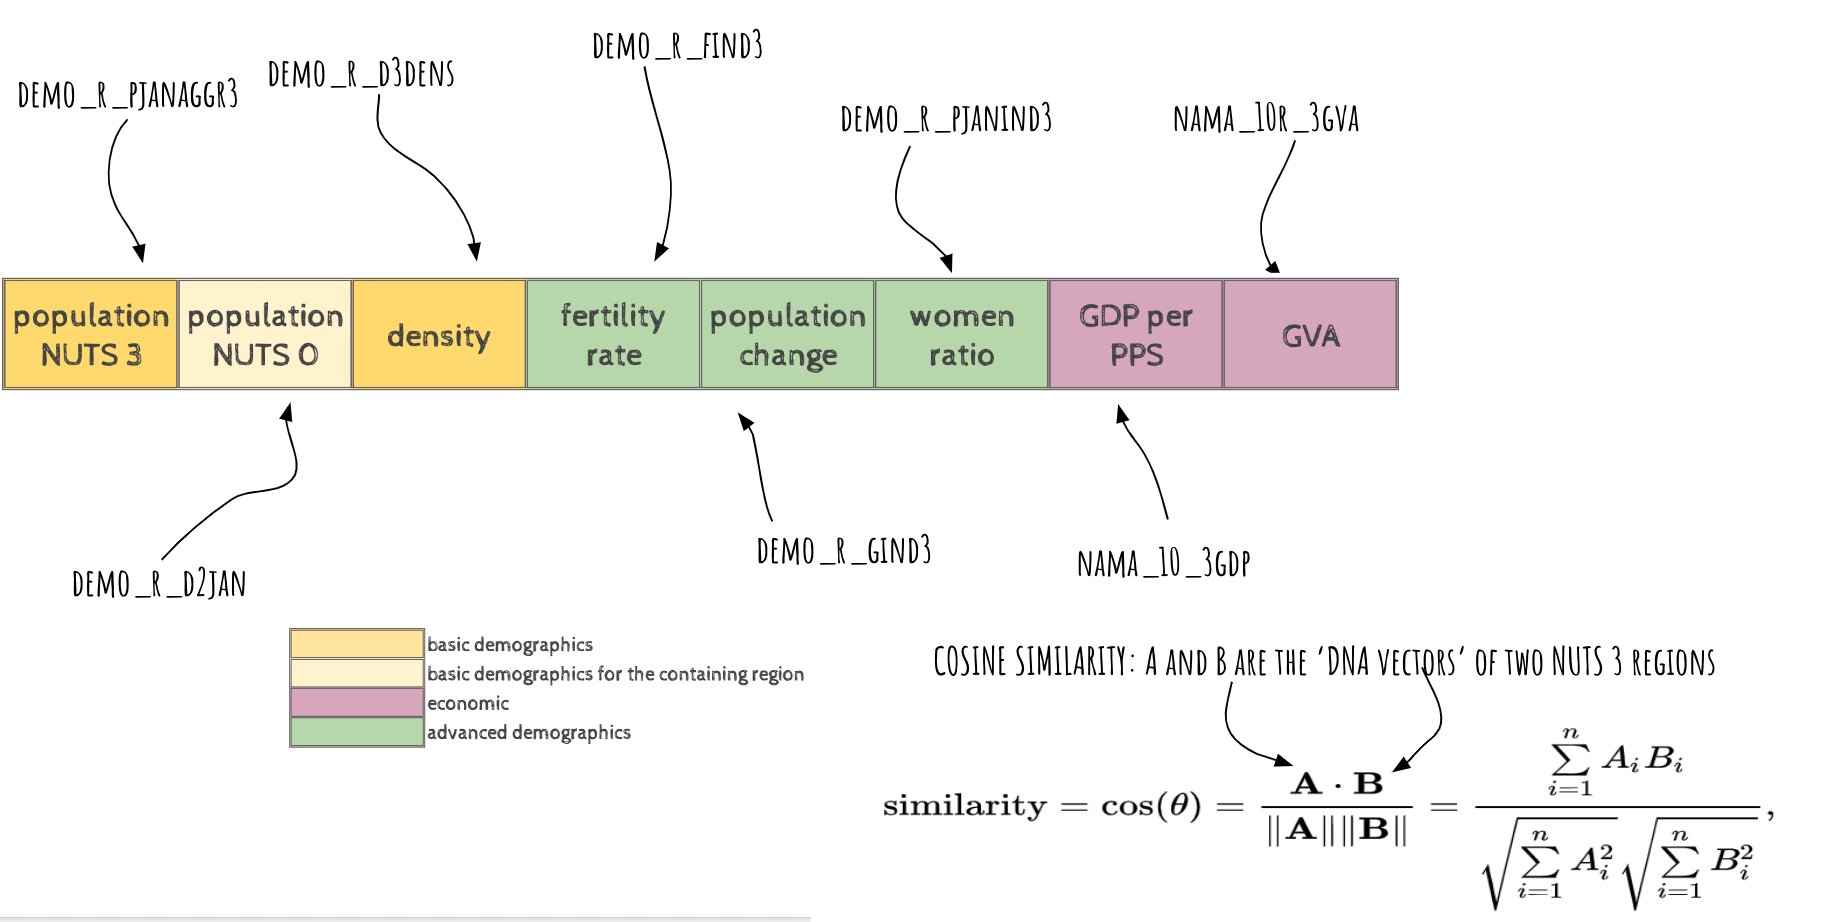
The idea was to get started with a proof of concept for a similarity metric that could be expanded with extra data. While researching the datasets available for the EU Datathon, Giuseppe came up with the idea of creating a flexible way to generate a similarity formula based on the idea of the ‘DNA of a region’. The DNA of a region is a set of standard features that all regions have, represented in EU open data. Specifically, the formula mostly uses data from Eurostat, as this is regularly available and updated through the years. It represents a good core on which it is possible to expand over time.
‘The Eurostat data is extraordinarily deep and complex, and it covers a great number of aspects of life in different regions,’ says Giuseppe. ‘Eurostat gives access to incredibly granular statistical data, which includes demographics, social conditions, economic aspects, transport, the environment and ways in which the region[s] spend their money. It is an invaluable resource to understand the make-up of a region from different points of view.’
Eurostat data is reported according to the NUTS (nomenclature of territorial units for statistics) classification. NUTS is a hierarchical system for dividing up the economic territory of the EU and the United Kingdom, for the purpose of collecting and harmonising regional statistics. There are four levels in the NUTS classification: NUTS 0 regions correspond to countries, NUTS 1 are subnational units that represent major socioeconomic regions, NUTS 2 are basic regions for the application of regional policies, while NUTS 3 is the smallest level, used for specific diagnoses. EU Twinnings originally covered NUTS 3 regions and has now expanded to NUTS 2.
Once the DNA data is assembled, the similarity is calculated simply by using a standard measure of similarity between two sequences of numbers, the cosine similarity, as illustrated below. The formula is fully extensible.
Giuseppe praised the ease of data harvesting: ‘Eurostat provides several ways to explore and understand the data, and a number of alternatives to download it. My choice was to use the JSON API, which is incredibly simple to use and process.’
The data is then fed into an SQLite database, and the calculations use standard Python packages. The website itself runs on popular web technologies like PHP and HTML/JavaScript/jQuery in order to make it easy to run and deploy. The website is still under development and the source code can be found at https://github.com/puntofisso/data.europa.eu-eutwinnings
The most and least similar areas overall
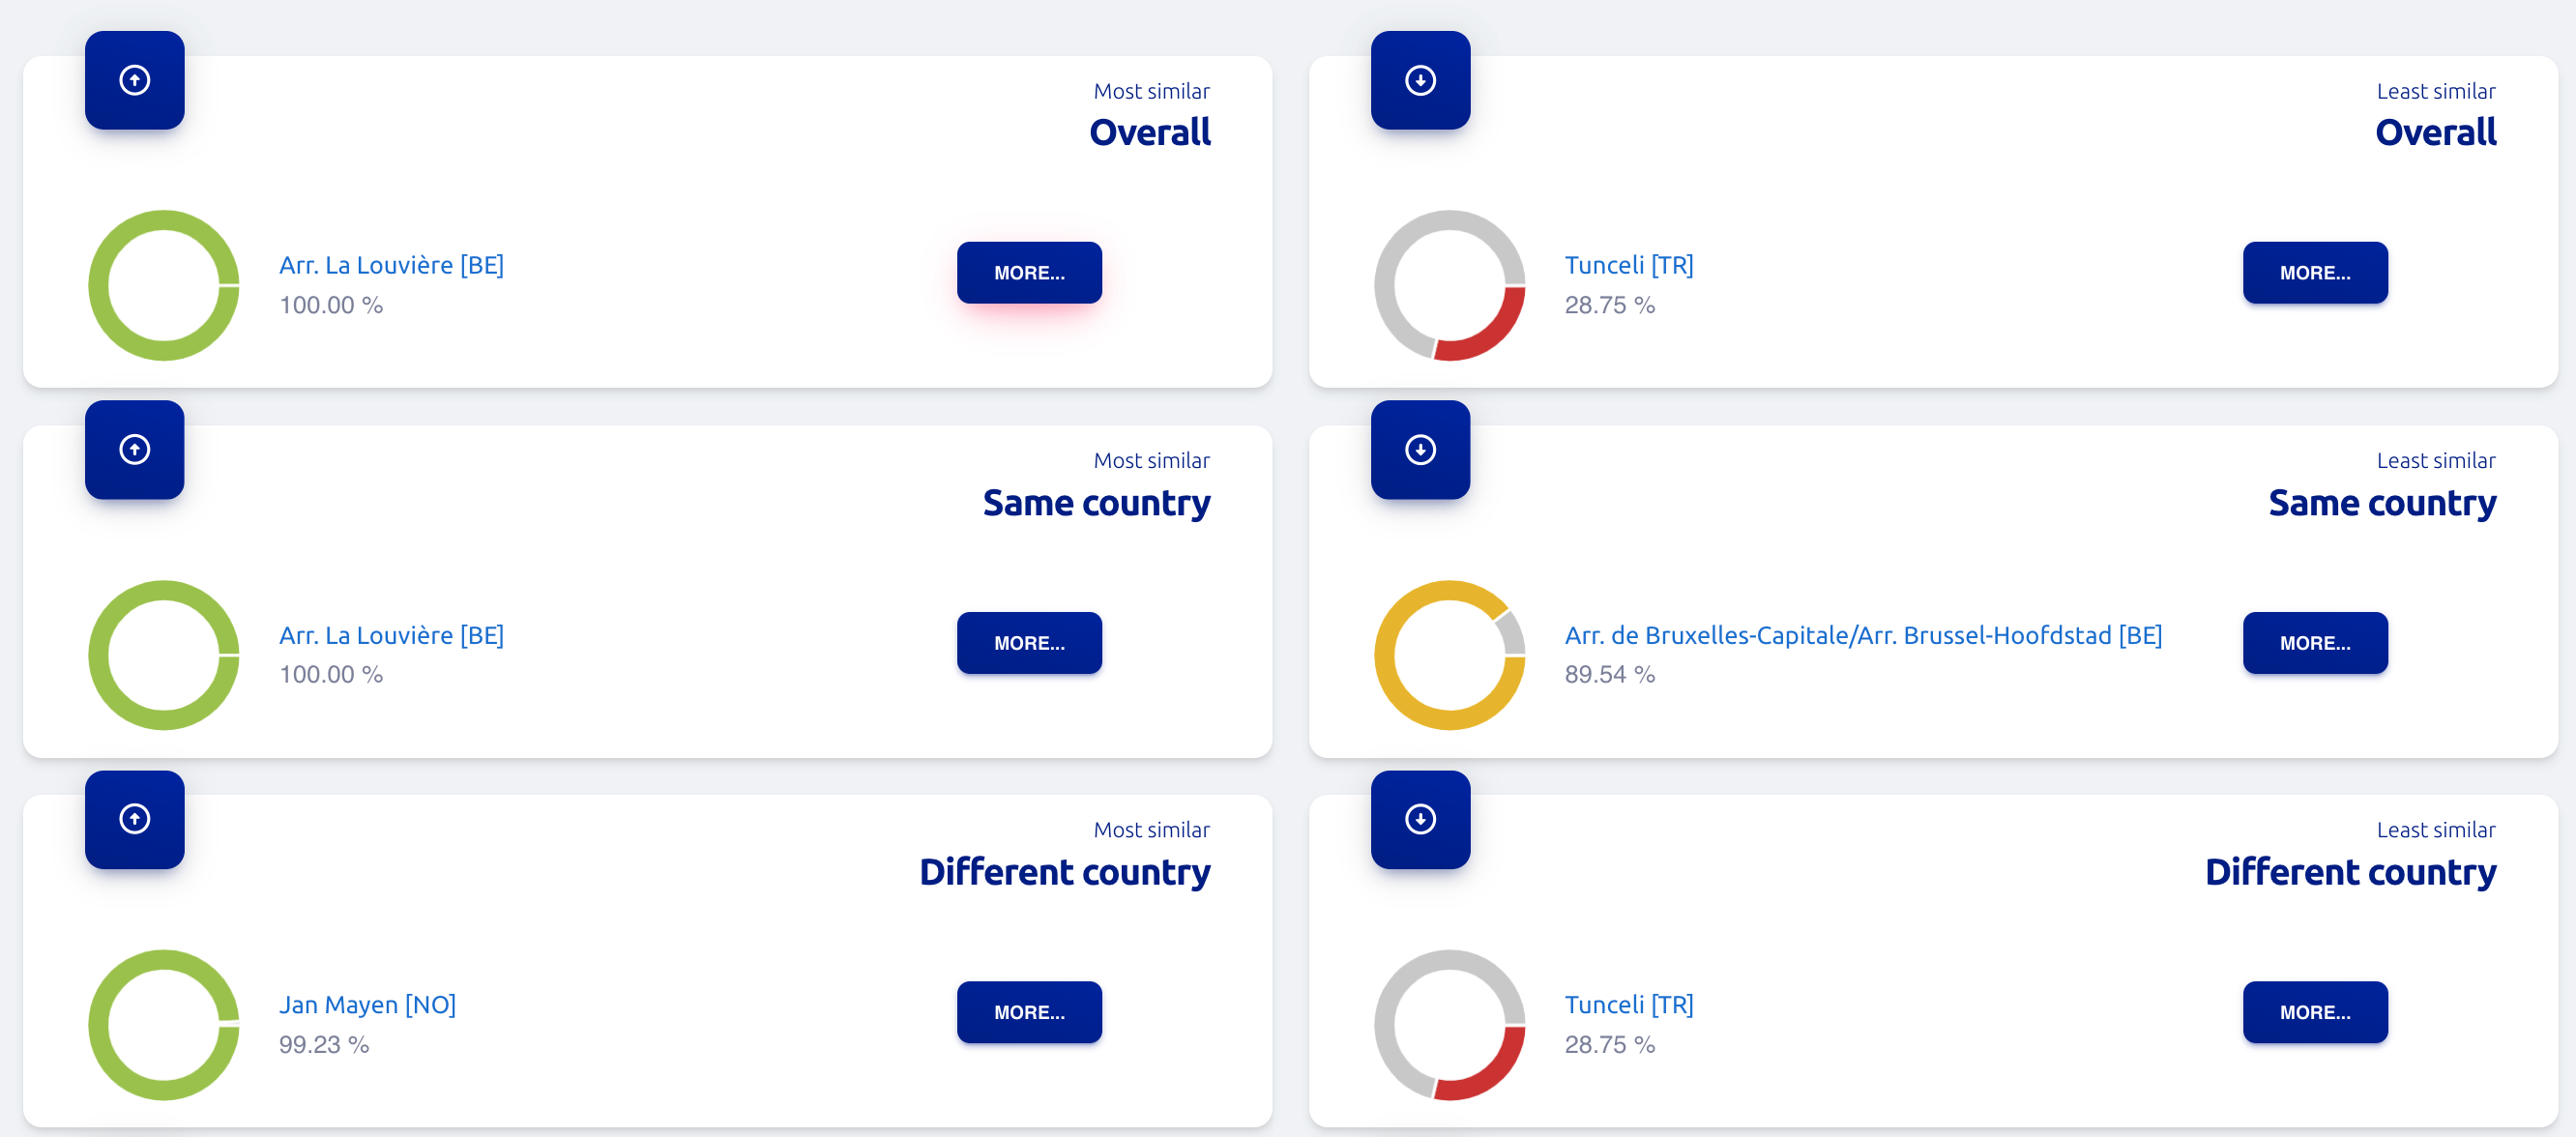
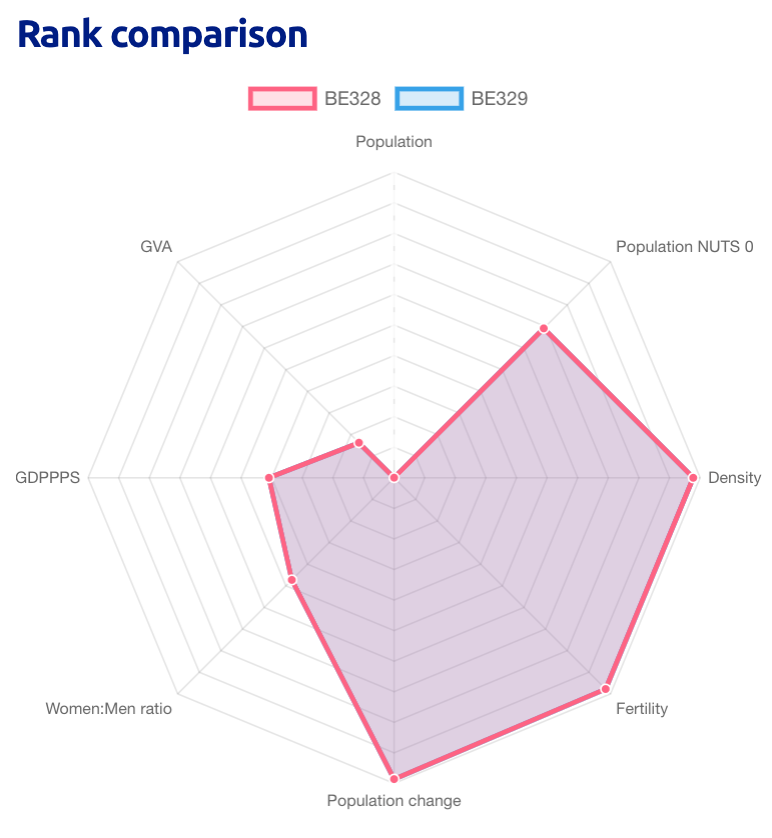
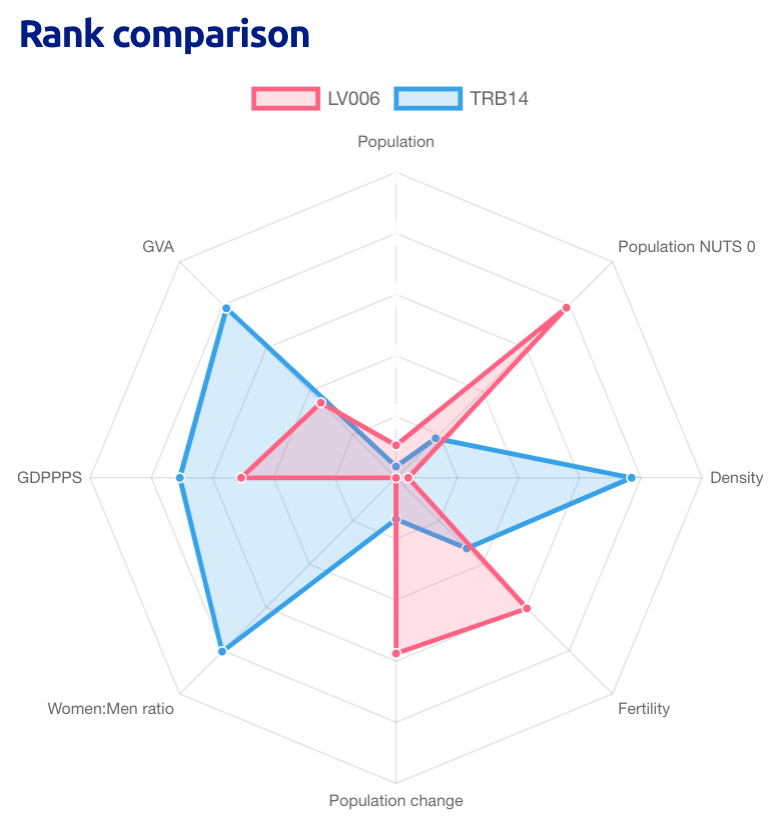
Are you curious to know which areas are the most and least similar overall? The two most similar NUTS 3 regions are Arr. Tournai-Mouscron and Arr. La Louvière (both in Belgium), which are 100 % similar – unsurprisingly, if you look at the top 10 most similar pairs, they tend to be between NUTS 3 regions in the same country. In order to understand why they’re so similar, all we have to do is look at their relative ranking. This is visualised on a spider chart. The ranking is basically a simple measure of where each region stands when we create a ‘league’ of regions from the highest to the lowest value of each feature. The rankings for Arr. Tournai-Mouscron and Arr. La Louvière are so very similar that they basically coincide, resulting in overlapping spider charts.
The same is true at NUTS 2 level with Freiburg and Rheinhessen-Pfalz, which have a 99.99 % similarity and are both located in Germany.
On the opposite end of the spectrum, the least similar NUTS 3 regions are Rīga in Latvia and Tunceli in Turkey, whose similarity is a mere 6.90 %. Their spider charts are so different that they can easily be told apart. The rankings of their constituent features couldn’t be more different. For example, the population density is massively different, with Tunceli ranking 1 924th as opposed to Rīga’s 99th.
At NUTS 2 level, the title of most different areas goes to Luxembourg and Ağrı, Kars, Iğdır, and Ardahan in Turkey, which are at 27.53 % similarity.
Future opportunities and challenges
The app is evolving, thanks to the collaboration with the Publications Office of the European Union. A number of data visualisations are offered through EU Twinnings, including the rank-similarity spider chart that shows, at a glance, how strong the similarity is between two regions over each feature.
‘There are some challenges in the data,’ says Giuseppe. ‘For example, I wanted to embed data from the national census, but its availability through Eurostat is not yet widespread, so I decided to just display it when available, without making it part of the region’s DNA. However, as data becomes more available, I will keep adjusting the formula.’
There has been some interest in using the app as a way to let students explore international Erasmus placements, although Giuseppe stresses that the motivation is not to build a business through it but to allow people to get to know their European neighbours better. ‘It’s great to play with such rich data!’, he adds.
Explore EU Twinnings to compare different regions and get to know your European neighbours better.