Executive summary
The use case observatory is a multi-year research project designed to assess the economic, governmental, social and environmental impact of open data across Europe from 2022 to 2025. Managed by the Publications Office of the European Union and conducted by researchers from the European Data Portal (data.europa.eu), the observatory monitors and analyses real-world use cases to generate insights that support the broader mission of the European Data Portal. Findings from the use case observatory have been published in three volumes.
Figure 1: Use case observatory Volumes I, II and III
Volume I, published in 2022, introduced the methodology and initial findings. Volume II, released in 2024, expanded on this foundation by closely tracking the development of 13 ongoing use cases. These cases were chosen from an initial pool of 30 open data applications, platforms and websites developed in Europe and were categorised according to their potential impact across four main impact dimensions: economic, governmental, social and environmental.
To evaluate these cases, the research team conducted an exploratory scan of ongoing activities, followed by semi-structured interviews with key contacts for each use case. The insights gathered from these interviews form the core of the report and provide a qualitative understanding of how open data is being used to generate tangible value.
Volume III, finalised in 2025, builds on this longitudinal perspective and highlights the following key learnings.
- Economic impact. Open data can stimulate growth and efficiency across sectors. It supports job creation both directly and indirectly, enables smarter recruitment processes and fosters innovation in industries such as urban planning and digital services. Use cases like Naar Jobs illustrate how open data can serve as a driver for regional employment and business development.
- Governmental impact. Open data enhances transparency, accountability and civic engagement. Initiatives such as Waar is mijn stemlokaal? and Statsregnskapet.no demonstrate how accessible public sector data can empower citizens, inform the media and support evidence-based policymaking, ultimately strengthening democratic processes and trust in institutions.
- Social impact. Open data fosters inclusion, collaboration and improved welfare. Projects like UniversiDATA-Lab, VisImE-360, Tangible Data, EU Twinnings, Open Food Facts and Integreat show how data-driven tools can amplify the voices of vulnerable groups, improve health outcomes and create new educational opportunities. Even small-scale impacts, such as improving the life of a single individual, can be meaningful and lasting.
- Environmental impact. Open data is a powerful enabler of sustainability. Use cases such as Digital Forest Dryads, Air Quality in Cyprus, Planttes and Environ-Mate demonstrate how data reuse can raise awareness, support behavioural change and enable targeted interventions to protect ecosystems and promote climate resilience.
Beyond these dimensions, the use case observatory identifies broader lessons from long-term use case development. These include the need for sustainable funding, business and support models, the value of pluriform open datasets that combine institutional and citizen-generated data, and the importance of embedding end-user participation throughout the full open data life cycle. The observatory also calls for more comprehensive impact measurement frameworks that go beyond short-term quantitative metrics to capture economic, governmental, social and environmental outcomes in a more holistic way.
The use case observatory contributes significantly to the understanding of open data impact in Europe. It underscores the challenges faced by these initiatives in securing sustainable funding for scaling. The interviews with use case representatives reveal diverse and meaningful impacts, ranging from job assistance to climate change awareness. In summary, the three volumes of the use case observatory present a comprehensive, evidence-based overview of how open data is being reused across Europe. They emphasise the transformative potential of open data, while also identifying the foundational support required to fully utilise its benefits.
1. Introduction
The use case observatory (hereafter referred to as ‘the observatory’) is a research project exploring the impact of open data in all its diversity. It is initiated and performed by the European Data Portal (data.europa.eu), the official portal for open data in Europe, managed by the Publications Office of the European Union. The purpose of this research project is to contribute to the portal’s broader goal of measuring the impact of open data across Europe. Instead of collecting one-off use cases, this series analyses how open data use cases evolve over a time span of three years (2022–2025).
Volume I of the observatory was published in October 2022 and explored a wide range of open data initiatives in different European countries. In the inaugural edition, an initial selection of 30 use cases was categorised into four key impact dimensions: economic, governmental, social and environmental. The cases with economic impact highlighted the crucial role of open data in assisting businesses in identifying profitable public procurement tenders, applying for jobs and pursuing professional opportunities. Cases with governmental impact showcased how open data contributes to transparency in political processes, thereby fortifying democracy. Within the realm of social impact, reported cases illustrated the use of open data to improve public health and data literacy, and foster inclusivity. Finally, the environmental impact was evident in use cases focused on monitoring air quality and supporting initiatives for forest preservation.
Volume II of the observatory, published in April 2024, expanded on the findings reported in Volume I and highlighted changes in the development and impact of the same selection of use cases. However, not all 30 use cases were still active, were willing to participate or had seen newsworthy changes over time. This ultimately resulted in a selection of 13 use cases for Volume II.
This third volume of the observatory concludes the three-year analysis by reassessing the impact of the 13 use cases that are still active. It takes a deep dive into impact realisation and looks at how open data has contributed to generating economic, governmental, social and environmental impact over time.
The observatory targets two main stakeholder groups. On the one hand, it demonstrates to open data providers and portals the value of their open data. It encourages them to provide more and better-quality data on accessible platforms in order to make use possible. On the other hand, the observatory shows open data users multiple types of use cases that have continued to grow, helping them to rethink their approach and find new ways to make long-lasting impact.
The goal of the three observatory volumes has been to answer the following questions.
- What is the economic, governmental, social and environmental impact of open data for the specific use cases collected?
- How important is it to keep track of such use cases to understand and foster value creation through open data in Europe?
- What else can be learned from the analysed use cases to improve open data measurement and implementation across Europe?
The remainder of this report is structured as follows: Chapter 2 details the methodological approach taken for the three editions of the use case observatory. Chapter 3 presents all 13 use cases, describing what the initiatives are about, how they create impact and how they have developed over time. After indicating main lessons learned in Chapter 4, the report ends with final conclusions in Chapter 5.
2. Methodology
For Volume I of the observatory, 30 use cases were selected, intended to be followed over the course of three years. Only use cases of applications, platforms or websites developed in Europe were considered. The aim was to keep a fair balance of use cases from EU Member States, possibly including examples from the United Kingdom, European Free Trade Association countries and neighbouring countries. In addition, the focus was placed exclusively on use cases belonging to specific sectors in the inventory, with the aim of retaining a diverse set of use cases that have an economic, governmental, social and environmental impact – the four impact dimensions on which the open data maturity assessment is also based.
- The economic impact dimension was defined as including use cases in business creation, entrepreneurship and the (re)skilling of workers.
- The governmental impact dimension referred to use cases in e-government support, government transparency and accountability.
- The social impact dimension was agreed to encompass use cases in healthcare and well-being, along with integration and the fight against inequality in society.
- The environmental impact dimension was understood as referring to use cases in environmentally friendly services and energy efficiency.
The methodology of Volume II and Volume III focused on the 13 use cases of Volume I that were still active and willing to participate.
- Firstly, an exploratory scan was performed to find out which use cases were still ongoing. For this scan, desk research (Google searches, website analyses and social media checks) was performed to find recent activities of the use cases.
- Secondly, interviews were planned with the contact people of all active use cases (see AnnexI). The duration of these interviews was between 30 and 60 minutes per use case and followed the interview guide in a semi-structured format (see Annex II). This interview guide served as a checklist to ensure that the sought-after insights for the observatory were gathered, but there was room left to also zoom in on other topics relevant to each use case.
- Thirdly, the interviews were summarised and incorporated into the observatory reports. These summaries are the core of this report, bringing to light the challenges and opportunities of making impact with open data. Use case descriptions were also shared with the interviewees for validation.
After taking these methodological steps, the observatory volumes were drafted, proofread and published in the ‘Factsheets and Reports’ section of the European Data Portal.
3. Use case analyses
This chapter presents the 13 use cases clustered within the four impact dimensions. Figure 1 provides an overview of this clustering per impact dimension.
| Overview of use cases per impact dimension | |||
| Economic impact | Governmental impact | Social impact | Environmental impact |
| 1. Naar Jobs (Belgium) | 2. Waar is mijn stemlokaal? (Netherlands) 3. Statsregnskapet.no (Norway) | 4. UniversiDATA-Lab (Spain) 5. VisImE-360 (Italy) 6. Tangible Data (Spain) 7. EU Twinnings (United Kingdom) 8. Open Food Facts (France) 9. Integreat (Germany) | 10. Digital Forest Dryads (Romania) 11. Air Quality in Cyprus (Cyprus) 12. Planttes (Spain) 13. Environ-Mate (Germany) |
Table 1: Clustering of open data use cases per impact dimension
Economic impact (one use case)
- Naar Jobs (Belgium) helps people find jobs close to them and lets users select whether they will travel by bike, car or train. The application also provides information on the transport options provided by employers to new employees.
Governmental impact (two use cases)
- Waar is mijn stemlokaal? (Netherlands) helps eligible voters find a suitable polling station. Citizens can also find information about opening times and whether the polling stations are accessible for people with certain disabilities.
- no (Norway) is a website that visualises government spending and budgets. Their goal is to facilitate financial transparency and enable the public to easily find information about the spending of resources by government administrations.
Social impact (six use cases)
- UniversiDATA-Lab (Spain) is a repository of analytical applications based on the open data published by the six Spanish universities part of the UniversiDATA portal. Its aim is to transform the static analyses of open data portals into dynamic results.
- VisImE-360 (Italy) explains Eurostat’s data on people with visual impairment, helping to allocate resources for medical aid and to plan social support programmes. It represents interactive data with advanced accessibility features.
- Tangible Data (Spain) transforms data from its digital context into a physical one by creating data sculptures in a public space, which helps people who lack certain digital skills understand and experience the data.
- EU Twinnings (United Kingdom) is a website that uses open data from Eurostat to make statistics accessible to a wider audience and show similarities across EU regions.
- Open Food Facts (France) is a large database of food products that creates easy-to-understand information about the nutritional value and environmental impact of food.
- Integreat (Germany) is a digital platform that provides newly arrived migrants and refugees with all relevant information in several languages at the municipal level.
Environmental impact (four use cases)
- Digital Forest Dryads (Romania) aims to protect forests in Europe from illegal deforestation by combining aerial and multispectral satellite imagery.
- Air Quality in Cyprus (Cyprus) provides citizens with real-time information about several types of air pollution. Users can find the data online or choose to be proactively informed about certain substances via the application on their smartphone.
- Planttes (Spain) is a citizen-science application that informs users about which plants are in bloom and whether this may affect people with pollen allergies.
- Environ-Mate (Germany) is an interactive platform to empower children with knowledge about climate change based on scientific data.
3.1 Economic impact
Naar Jobs (previously known as Naar Jobs in West-Vlaanderen)
Naar Jobs in a nutshell
|
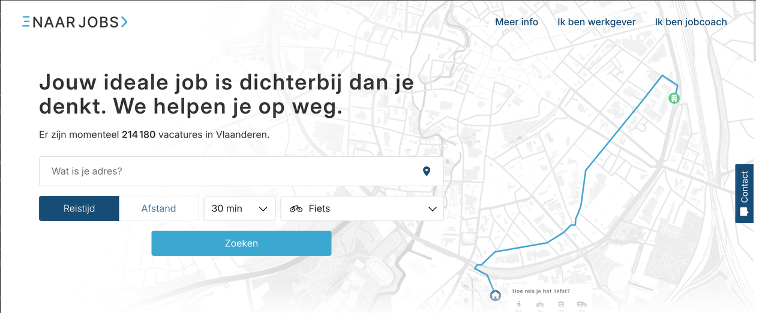
Figure 2: Snapshot of the Naar Jobs portal
Naar Jobs is a platform dedicated to helping Belgian citizens find employment based on their transportation preferences. The initiative began in West Flanders as a response to a persistent mismatch between job availability and accessibility. Developed by Belgian geographic information and communication technology company Nazka Mapps, the platform was designed to address mobility poverty, wherein individuals – particularly those without access to a car – are unable to reach employment opportunities due to inadequate or unaffordable transport options.
Initially funded by the Provincial Development Agency West Flanders and the regional department of the Flemish employment service, the platform enriched job vacancy data with precise employment site locations and transport accessibility information. This allowed job seekers and social workers to identify reachable jobs based on real-world commuting constraints.
How does Naar Jobs create impact?
The initiative has evolved into a comprehensive employment-matching tool that integrates real-time vacancy data, validated company addresses and mobility offerings such as bike allowances, public transport discounts and parking availability. The platform’s multimodal routing engine enables users to search for jobs based on actual travel time (not just distance) by bike, public transport or car.
The platform serves three main user groups: 1) job seekers, who can search for jobs within a defined travel radius and filter by mobility benefits; 2) job coaches, who use a professional version of the tool to assist clients that have limited digital literacy or that face language barriers; and 3) employers, who can update their mobility offerings through a dedicated content management system interface.
By 2024, the platform was actively used by over 50 job coaches, each assisting 5 to 10 unemployed individuals daily. The tool has since expanded to cover all of Flanders, supported by a federal government project, and is now also exploring expansion into Brussels and Wallonia.
How has Naar Jobs developed over the past three years?
Volume III marks a significant transformation of the initiative from a regional pilot into a nationally scaled, data-driven platform. While early versions focused on West Flanders and relied on manual data matching, the current platform features automated daily updates of vacancy and mobility data via application programming interfaces (APIs), advanced geolocation correction algorithms to resolve address mismatches and multimodal travel-time polygons that visualise reachable job zones. Users can filter jobs not only by qualifications and job type but also by mobility-related benefits such as bike allowances and public transport discounts. Job coaches have access to additional filters, including language skills and driving licence requirements, while employers can manage multiple locations using their company registration number. The platform’s interface has been tailored to the needs of each user group, with a professional version for job coaches, a simplified version for job seekers and a data management portal for employers. These developments reflect a maturing platform with increasingly sophisticated technical capabilities and a broader strategic reach.
What challenges has Naar Jobs encountered, and what lessons have been learned from its implementation so far?
One of the key challenges has been the technical complexity of working with open data. Although the data is publicly available, it is often inconsistent, incomplete or not immediately usable. The team had to invest heavily in building custom engines to clean, merge and enrich datasets, particularly to correct inaccurate job site addresses and integrate multimodal mobility data including public transport routes, bike and car travel times and employer incentives. Another challenge is policy misalignment. While the platform promotes sustainable commuting, many companies still offer fiscally incentivised company cars, undermining efforts to encourage greener transport options. Companies that choose not to offer cars often lack equivalent fiscal benefits to support alternative mobility options, creating a disincentive for more sustainable practices. Additionally, marketing and visibility remain limited. Despite its robust functionality and positive feedback from job coaches, the initiative has struggled to gain widespread recognition among employers and the general public. The team notes that the platform’s technical and social innovation is difficult to communicate without targeted outreach and visual storytelling.
Nonetheless, the collaborative model (i.e. working with job coaches, government agencies and mobility experts) has proven effective. The tool is now operationally used and praised by job coaches for its ability to match people with jobs they can realistically attain.
What are the future goals of Naar Jobs?
Looking ahead, Naar Jobs aims to expand geographically to Brussels and Wallonia, and potentially to other Member States. Plans are under way to introduce user notifications for new job matches based on saved preferences, to implement impact tracking to measure job placement outcomes and to advocate for better alignment between mobility and employment policies. The team also envisions a marketplace or observatory where enriched open data use cases like Naar Jobs can be showcased, reused and supported. These future goals reflect a commitment to continuous improvement and a belief in the transformative potential of open data when applied with purpose and precision.
3.2 Governmental impact
Waar is mijn stemlokaal?: making voting easy and inclusive for everyone
Waar is mijn stemlokaal? in a nutshell
|
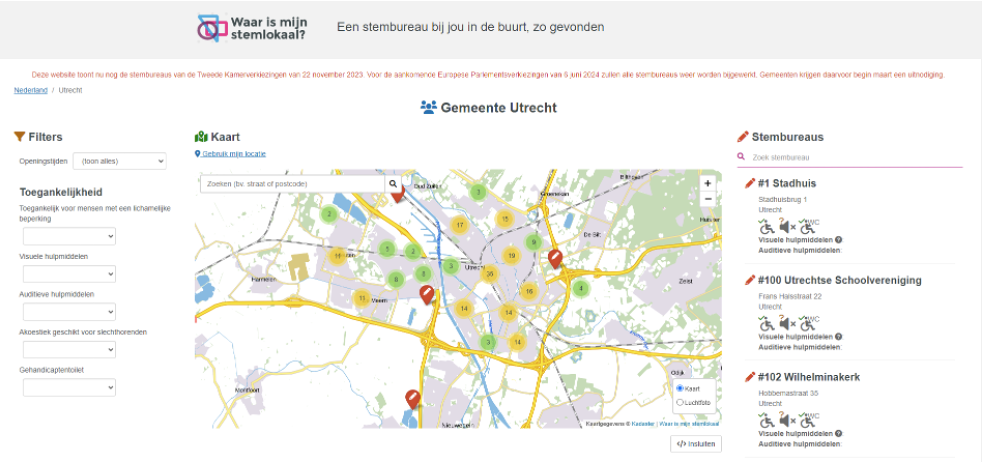
Figure 3: Snapshot of the Waar is mijn Stemlokaal? portal
The platform Waar is mijn stemlokaal? (‘Where is my polling station?’) created by the Open State Foundation, offers citizens in the Netherlands a user-friendly way to locate their nearest voting booth. The website allows users to filter based on accessibility criteria, including distance, opening times and special accommodations for people with disabilities. With a focus on open data, the platform collects standardised information from municipalities, achieving a 100 % coverage of all polling stations, which also includes those in the Caribbean municipalities. Bonaire, St. Eustatius and Saba are special municipalities of the Netherlands, each governed by both a local island authority and the Dutch central government. While they function similarly to municipalities in mainland Netherlands, they are not part of any Dutch province. Residents of these Caribbean public bodies have voting rights in both Dutch parliamentary and European parliamentary elections.
How does Waar is mijn stemlokaal? create impact?
At its core, Waar is mijn stemlokaal? empowers voters by offering clear, reliable and inclusive information about where and how to vote. The platform allows users to search for polling stations based on proximity, opening hours and a growing list of accessibility features. These include wheelchair access, visual and auditory accommodations, and more recently criteria for neurodivergent-friendly environments such as low-stimulation settings.
The platform’s reach extends well beyond individual voters. Its data is reused by journalists, civic organisations and government agencies, often forming the basis for election-day visualisations and accessibility audits. During the 2024 European Parliament elections, the website attracted over 235 000 users, more than doubling its traffic from the previous cycle. Its integration into official voting portals and municipal websites further underscores its role as a trusted public resource.
Importantly, the platform also serves as a feedback loop for improving electoral accessibility. By collecting and standardising data from municipalities, it not only informs the public but also helps local governments identify gaps in their own infrastructure and services.
How has Waar is mijn stemlokaal? developed over the past three years?
Volume III marks a period of significant growth and institutional maturity for Waar is mijn stemlokaal?, reflecting its evolution from a civic technology prototype into a nationally recognised public service. Building on the foundations laid out in Volumes I and II, this phase captures the platform’s increasing technical sophistication, broader municipal adoption, and deeper integration into the Dutch electoral landscape.
Initially launched as a volunteer-driven initiative, the platform has grown into a structured operation supported by a small core team and a network of collaborators. While Volume I documented its early reliance on manual data collection and limited municipal engagement, and Volume II highlighted the introduction of a harmonised data standard, Volume III shows the platform now receives structured data from over 90 % of Dutch municipalities. This shift has significantly improved data quality, timeliness and national coverage.
Technological capabilities have also advanced. The platform has undergone two major relaunches, improving performance, accessibility and user experience. New features include expanded accessibility filters, such as low-stimulation environments for neurodivergent users and improved search functionality. These updates are informed by continuous user feedback and targeted research with underrepresented voter groups.
Institutionally, Waar is mijn stemlokaal? has secured funding from the Ministry of the Interior and Kingdom Relations, enabling the development of a long-term roadmap and strengthening its position as a trusted public utility. The platform is also frequently referenced in parliamentary debates on electoral accessibility. This latest phase demonstrates that civic technology can scale not only through technical innovation, but also through strategic partnerships, open standards and a clear public mission.
What challenges has Waar is mijn stemlokaal? encountered, and what lessons have been learned from its implementation so far?
Despite its progress, Waar is mijn stemlokaal? continues to navigate several structural and operational challenges. One persistent issue is the lack of legal clarity around accessibility standards. While only two features – wheelchair access and magnifying glasses – are legally mandated, the platform has voluntarily expanded its criteria in response to user demand and stakeholder input. This has required ongoing negotiation with municipalities, many of which interpret accessibility differently or lack the resources to meet higher accessibility standards.
Another challenge lies in balancing standardisation with local flexibility. While a unified data model is essential for national coverage, municipalities often want to include unique local features or contextual notes. The platform addresses this through structured free-text fields and a modular design, but tensions between uniformity and customisation remain.
Privacy is another area where the platform has taken a principled stance. In contrast to many digital services, Waar is mijn stemlokaal? collects only minimal metadata (i.e. device type and referral source), refraining from invasive tracking in favour of user trust. This approach has not limited its reach; rather, it has reinforced its credibility among users and partners.
Perhaps the most important lesson here is that civic technology doesn’t need to scale through size alone. With a core team of just three staff members and a network of volunteers, the initiative has demonstrated that strategic partnerships, open standards and a clear public mission can achieve national impact.
What are the future goals of Waar is mijn stemlokaal?
Looking ahead, the Open State Foundation aims to transition the platform into full public ownership, ideally under the stewardship of the Dutch Election Board. Funding is secured through 2026, and additional support is expected for upcoming elections. In the meantime, the team continues to refine the platform’s technical capabilities, expand its accessibility features and advocate for stronger open data policies at the national level.
The long-term vision is not just to maintain the platform, but to embed it within the broader digital infrastructure of Dutch democracy. This includes deeper integration with municipal systems, more robust analytics for accessibility planning and continued collaboration with civil-society groups.
Ultimately, Waar is mijn stemlokaal? offers a compelling model for how civic technology can evolve from a volunteer-driven prototype into a trusted public utility. Its success lies not only in its technical design, but in its commitment to openness, inclusion and democratic participation.
Statsregnskapet.no: a journey towards transparent financial clarity and accountability in Norwegian governance
Statsregnskapet.no in a nutshell
|
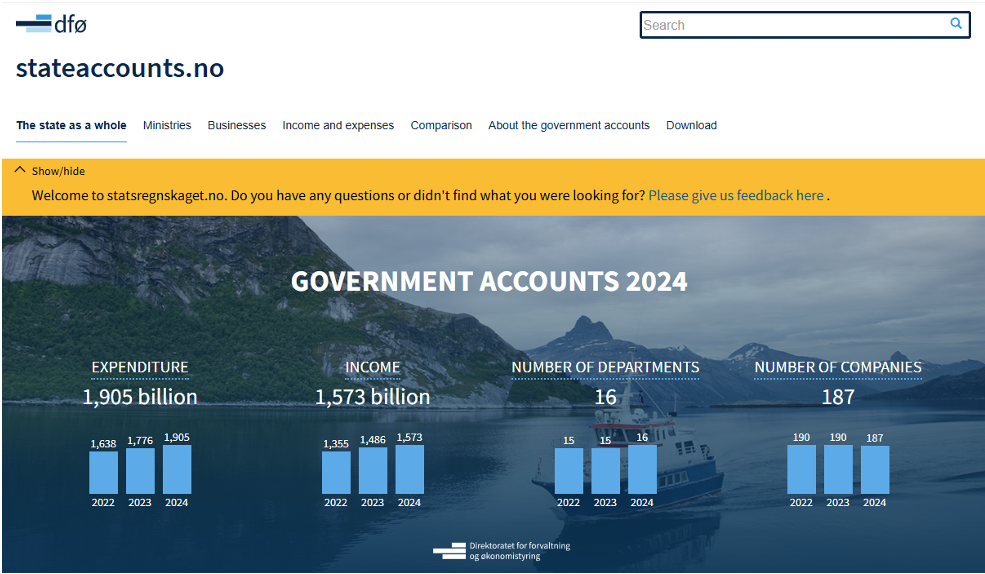
Figure 4: Snapshot of the Statsregnskapet.no portal
Statsregnskapet.no is a public-facing digital platform developed by DFØ to promote transparency and accountability in public finance. The platform provides a clear and accessible dashboard that visualises the Norwegian central government’s income and expenditure, allowing users to explore financial data across ministries and agencies. It presents both cash and accrual accounting data, appropriations and FTE staffing figures. Users can compare financial indicators across time periods, programme categories and agencies, gaining insight into how public funds are allocated and used. The platform is maintained by a small team within DFØ, with two FTE employees supported by part-time contributors.
How does Statsregnskapet.no create impact?
Statsregnskapet.no serves a broad and diverse audience, including government employees, journalists, researchers, students, politicians and interested citizens. By making government financial data publicly available and easy to interpret, the platform empowers users to engage with public administration in a more informed and meaningful way. It supports democratic oversight by enabling stakeholders to scrutinise income and expenditure patterns, assess efficiency and identify trends. The platform is frequently cited in media reporting, which is seen as a strong indicator of its public value. DFØ monitors usage through web analytics and annual user surveys, which inform outreach strategies and platform improvements. In 2024, user satisfaction reached 85 %, up from 65 % in 2023 and 52 % in 2022, reflecting growing appreciation for the platform’s clarity and usefulness.
How has Statsregnskapet.no developed over the past three years?
While the core mission of Statsregnskapet.no has remained consistent, the platform has seen steady, incremental improvements in technical performance, data presentation, and user interface design. A major transformation under way is the integration of accrual accounting data from all government agencies, mandated for completion by 2027. Full data availability is expected by spring 2028. This shift requires significant back-end development and coordination with accounting system vendors, and the team is currently in the planning and testing phase. The platform has also introduced a feedback tool and expanded its outreach through LinkedIn, newsletters and its participation in Norway’s largest journalism convention. Flash courses are held twice a year, and training is now offered through a new academy for ministry staff. These efforts aim to increase awareness and ensure that users can make the most of the platform’s capabilities.
What challenges has Statsregnskapet.no encountered, and what lessons have been learned from its implementation so far?
One of the main challenges has been managing the complexity and volume of financial data from multiple sources. While most of the data is open and publicly accessible, it requires careful validation and structuring before it can be presented on the platform. DFØ uses Structured Query Language tools to process the data but does not alter the underlying figures. Instead, it combines data from various sources to generate key indicators, such as salary per FTE, which enhance the platform’s analytical value. Another challenge is the dual reporting requirement during the transition to accrual accounting, which demands coordination across agencies and robust data infrastructure. The open-access nature of the platform also limits the ability to identify individual users, making it difficult to follow up with and tailor content to specific user groups. Users often expect more detailed or customised data than the platform can provide, and managing these expectations is an ongoing task. Nonetheless, feedback has directly influenced new features such as expandable graphs and contextual explanations, and the team continues to prioritise clarity and accessibility through plain language, case examples and interactive visualisations.
What are the future goals of Statsregnskapet.no?
Looking ahead, Statsregnskapet.no aims to fully incorporate accrual accounting data from all government agencies, aligning with the national mandate set for 2027. This will involve expanding the platform’s technical capabilities and refining its data presentation tools to accommodate more complex financial information. DFØ also plans to continue its active marketing and awareness initiatives, ensuring that the platform remains a valuable resource for a wide range of users. The team is exploring opportunities to collect and present additional information of public interest, and to further enhance the platform’s usability and relevance. Ultimately, Statsregnskapet.no seeks to deepen public engagement with government finance, enhance transparency and support informed democratic participation in Norway’s public administration.
3.3 Social impact
UniversiDATA-Lab: making university data publicly available
UniversiDATA-Lab in a nutshell
|
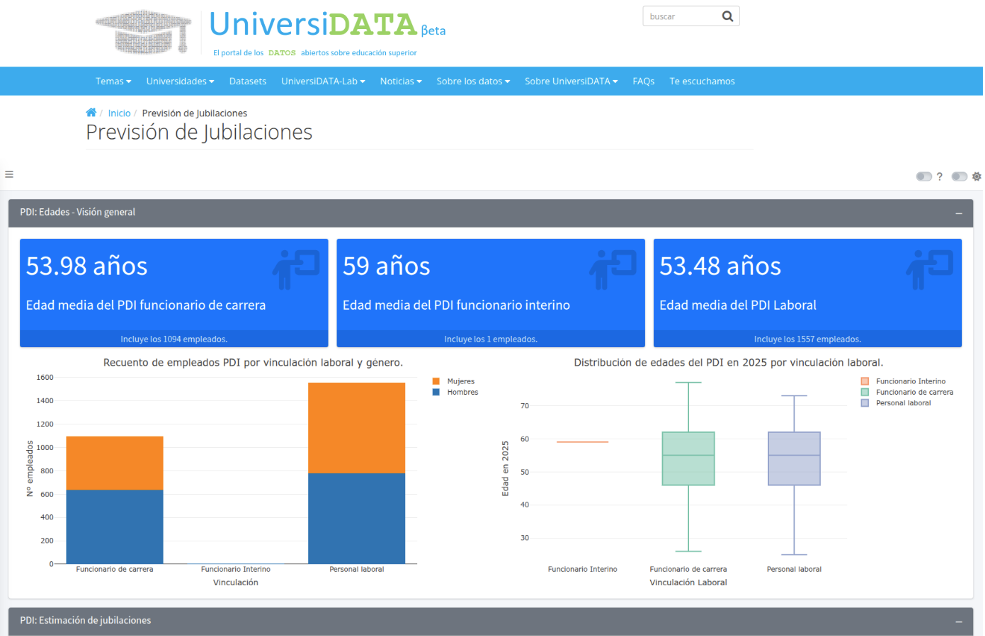
Figure 5: Snapshot of the UniversiDATA portal
UniversiDATA-Lab is a dynamic repository of analytical applications built on open data published by Spanish universities through the UniversiDATA portal. It was launched as an extension of UniversiDATA’s ‘Laboratory’ section, with the goal of transforming static data analyses into interactive tools that demonstrate the practical value of open data in higher education.
The initiative began in 2020 as a public–private collaboration between three public universities and the technology company DIMETRICAL and has since grown to include six universities. These institutions share a unified data infrastructure, using the same formats, semantics and publishing schedules, which ensures comparability and scalability across the platform. UniversiDATA-Lab is designed to serve a wide range of users, including students, educators, researchers, journalists, businesses and policymakers, and it streamlines the work of reusers by enabling them to process data from multiple universities through a single, unified data pipeline, minimising the required effort.
How does UniversiDATA-Lab create impact?
The impact of UniversiDATA-Lab is multifaceted and growing. By centralising the technical infrastructure and standardising data formats, the initiative significantly lowers the barriers for universities to publish and maintain open data. This has enabled a wide range of stakeholders to access and reuse university data for diverse purposes. The lab’s datasets have been used in academic theses, research publications and classroom assignments. For example, one datathon-winning project led to a peer-reviewed paper on the effects of COVID-19 on international student mobility. Companies, particularly in the student housing sector, have used the data to forecast demand and plan services. Citizens have used the platform to make informed decisions about university enrolment and commuting, especially in rural areas. The lab also plays an educational role, offering detailed documentation and visual tools that make complex datasets, such as university budgets, accessible to non-experts. Its inclusion in national innovation directories and press coverage further underscore its growing relevance and public value.
How has UniversiDATA-Lab developed over the past three years?
Since its inception, UniversiDATA-Lab has undergone a significant transformation from a conceptual extension of UniversiDATA into a fully operational and widely used platform. Over the past three years, UniversiDATA-Lab has evolved from a proof-of-concept into a tangible reality within the UniversiDATA portal, offering four practical case studies, two active interactive analytical applications (the budget viewer and the retirement forecast) and a third analytical application (the procurement viewer), which is currently in beta testing and will be made available to the public in September/October 2025.
In its early phase, the lab was envisioned as a separate portal, but the team ultimately decided to integrate it into the main UniversiDATA-Lab website to provide a more seamless user experience. This decision has proven effective in maintaining coherence and accessibility. Over the past year, the lab has expanded its catalogue of applications, including the launch of a new contracting viewer that analyses public tenders and procurement data, expected to be made publicly around October 2025. This dataset, sourced from Spain’s national open data portal, represents a major milestone in the project’s evolution, offering insights into university spending patterns and supplier relationships. The lab also continues to host its annual datathon, which has become a key driver of innovation and engagement. The second edition, held in 2024–2025, attracted a wide range of participants and produced socially impactful projects on topics such as gender inequality, rural access to education and environmental sustainability. These developments reflect a shift from experimentation to maturity, with the lab now serving as a model for open data reuse in higher education.
What challenges has UniversiDATA-Lab encountered, and what lessons have been learned from its implementation so far?
One of the most persistent obstacles for UniversiDATA-Lab has been internal resistance within universities, particularly regarding concerns about data quality and public scrutiny. Some stakeholders have been hesitant to publish data they perceive as incomplete or imperfect.
The team has addressed this by emphasising that no dataset is flawless and that public feedback often leads to improved data quality. Another major challenge has been ensuring the proper anonymisation of highly granular datasets, such as student-level performance data.
This requires complex technical processes and legal risk assessments, which the team has tackled by developing robust anonymisation protocols and a custom data-sharing licence. The team has also faced the ongoing challenge of maintaining user engagement and support. Publishing open data is not a one-time task but a continuous service that involves responding to user queries, updating datasets and developing new applications. The team has learned that success depends not only on technical excellence but also on building trust, fostering collaboration and demonstrating the tangible benefits of transparency.
What are the future goals of UniversiDATA-Lab?
Looking ahead, UniversiDATA-Lab aims to continue expanding both its data catalogue and its user base. A seventh university is expected to join the initiative soon, and regular meetings among the participating institutions ensure that new datasets are continually proposed, developed and released. The team plans to launch additional analytical applications that address emerging societal and academic questions, such as student dropout rates, faculty diversity and environmental impact. There is also a strong focus on outreach and education, with plans to enhance documentation, offer more training resources and promote the platform through events and the media. The datathon, with its third edition expected in 2026, will remain a central feature, serving as a showcase for innovative reuse and a catalyst for community building. Ultimately, UniversiDATA-Lab aspires to become a reference point for open data in higher education, not only in Spain but across the European Union, by demonstrating how structured collaboration, technical rigour and a commitment to public value can transform how universities engage with data.
VisImE-360: using open data to support and improve healthcare planning for visually impaired people
VisImE-360 in a nutshell
|
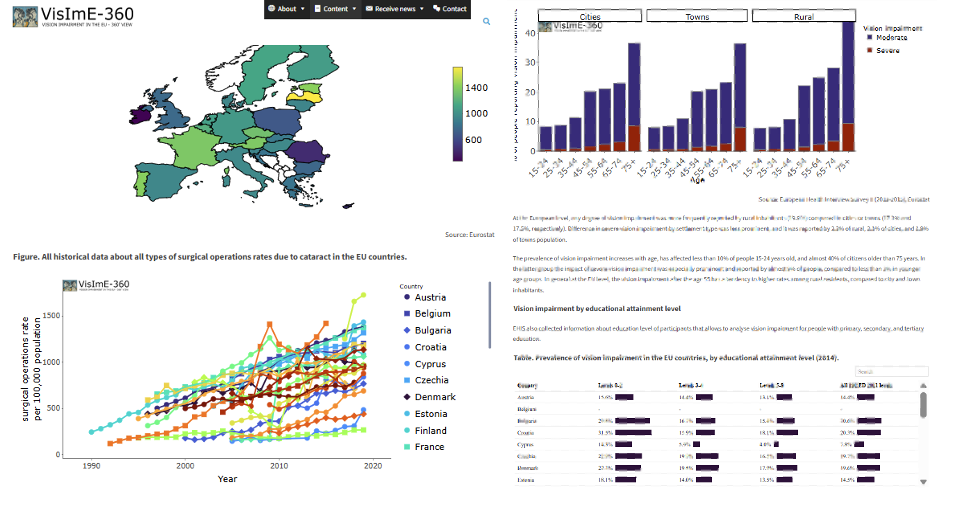
Figure 6: Snapshots of the VisImE-360 portal
VisImE-360 (Vision Impairment in the EU – 360ᵒ view) was created by epidemiologist and data scientist Boris Bikbov. The initiative is driven by the idea to collect, in a single information space, all major health data on a highly relevant condition that affects millions of people in the EU: namely, visual impairment. Raw open data from large-scale Eurostat surveys and databases were used to produce easy-to-perceive text descriptions, visualisations and tables. VisImE-360 captures statistics on prevalence, public health resources, social inclusion and more. The 2021 EU Datathon competition provided the right opportunity to develop a web application that summarises and presents the data to a broader audience. Importantly, the application ultimately supports decision-makers in allocating resources to help people with visual impairment and facilitate the provision of the most appropriate medical aid.
How does VisImE-360 create impact?
VisImE-360 aims to create impact by addressing visual impairment, a widespread health condition. The application has a twofold goal: raising awareness about visual impairment and providing support to various stakeholders, including policymakers, patient organisations, the media and social service workers. The website contains two main sections to achieve these goals. The first section presents data on the prevalence of visual impairment across Member States, considering factors like urbanisation and education levels. The second section focuses on healthcare resources and utilisation, offering insights into the availability of ophthalmic surgeons, statistics on cataract treatment and hospital interventions. The application ensures technical accessibility for all users, including people with visual impairment, by providing customisable colour schemes and font features. The initiative advocates for statistical solutions that embrace accessibility by design. The number of website users and usage trends since 2021 remain unknown. Aside from specific recognition from fellow open data scholars, relatively little feedback has been received from end users. The purpose of the initiative is to provide a single-entry point for all stakeholders and raise awareness. Therefore, in a way, each visitor’s engagement makes a meaningful difference.
How has VisImE-360 developed over the past three years?
The initiative started as a participant in the 2021 EU Datathon. The website and its content have not been updated in the meantime. A lack of financial resources is the main reason why further development has not taken place. Although suitable open data grants have not been made available through public authorities or academic institutions, the author continues to seek funding to implement the planned work packages, which focus on integrating Eurostat data, scientific research studies and other open data sources.
What challenges has VisImE-360 encountered, and what lessons have been learned from its implementation so far?
The experiences from VisImE-360 show the importance of reusing already available data. By building on existing datasets, academic literature and prior analyses it becomes clear what knowledge gaps exist and how new insights arise. Creating open data impact does require adequate levels of data and technical skills, for instance to obtain, screen and analyse large volumes of data in an automated way, set up most relevant data queries and searches, interpret medical data standards and ontologies, and ensure metadata quality. However, more recently, free open-source tools and the democratisation of data enable a broader group of people to make impact using open data. On a positive note, starting to work with open data has become easier than it was three to five years ago.
What are the future goals of VisImE-360?
VisImE-360 would like to broaden the number of data sources, whenever new financial resources would become available. This includes adding more scientific literature data and comparing different studies. A key guiding principle remains the publication of ‘inclusive open data’, as introduced four years ago. To take advantage of data, people need support in two key ways: technical access that adapts information to individual physical capabilities, and health literacy or cognitive support that helps them understand what the data means and how to interpret it.
Therefore, it is important to consider the different preferences of end users. Some will prefer text with numerical data and figures, while others may better comprehend the same content when it is presented in an audio or video format.
Such initiatives are also considered relevant in light of the Web Accessibility Directive, along with the more recent European Accessibility Act, which took effect on 28 June 2025. Both VisImE-360 and these policy measures recognise that everyone should be able to take part in society and the economy, regardless of how they see, hear, speak, think or move.
Tangible Data: transforming data into tangible sculptures to educate society
Tangible Data in a nutshell
|
Figure 7: Snapshot of the Tangible Data portal
Tangible Data continues to evolve as a creative and educational initiative that bridges the gap between open data and society. Initially featured in Volume I of the observatory as a prototype-driven project that uses 3D-printed sculptures to visualise sustainability data, Tangible Data has matured into a multifaceted platform for education, inclusion and civic engagement. Volume III captures its expansion into schools and museums, and its digital interactivity, reflecting a growing commitment to accessibility and impact.
How does Tangible Data create impact?
Tangible Data transforms open datasets into physical sculptures that visualise complex global challenges such as climate change, poverty and the lack of trust in institutions. These sculptures are designed to be tactile, inclusive and informative, often embedded with QR or near-field communication codes linking to contextual data and calls to action.
In 2024–2025, the initiative launched a structured educational programme for 15-year-old students. The curriculum includes sessions on data literacy, visualisation using Google Sheets and creative interpretation through sculpture and music. Initially tested with university students, the programme was adapted for younger audiences due to increased digital access in schools post-COVID-19. In its first year, it reached 40 students, with plans to scale to 150 across multiple schools.
Museums have become key partners, hosting exhibitions and workshops that engage families, educators and older generations. A new plug-in, developed by the Tangible Data team using ChatGPT and powered by artificial intelligence (AI), allows users to interact with data in a gamified way; for example, exploring temperature changes across decades. These interactive features enhance engagement and storytelling, especially in museum settings.
How has Tangible Data developed over the past three years?
Over the past three years, Tangible Data has undergone a notable transformation. In 2022, the project was introduced as a prototype-based initiative focused on raising awareness through physical data sculptures. At that stage, the emphasis was on bridging the digital divide by making data more tangible and understandable for the general public. The sculptures were small-scale, often created using 3D printing and laser cutting, and placed in public spaces to spark curiosity and conversation.
By 2023, the initiative had moved beyond the prototype phase. Tangible Data began delivering complete projects and standardised its design, production and delivery processes. This allowed the team to respond more quickly to requests and scale the initiative internationally. Volume II highlighted the delivery of three major projects addressing topics such as the COVID-19 pandemic, primary education progress in Central America and climate change. The initiative also began exploring commercial and educational opportunities, including exhibits and workshops.
Volume III marks a new phase in Tangible Data’s development. The initiative has expanded into formal education, launched a school-based curriculum and introduced new technical capabilities such as AI-powered interactivity. It has also strengthened its outreach strategy, launching a blog and establishing a social media presence, supported by Spanish government funding. Tangible Data’s work was recognised at the 2025 EU Open Data Days, where it presented a sculpture titled ‘European Open Data: Unlocking tangible futures’, celebrating the EU’s commitment to transparency and open data.
What challenges has Tangible Data encountered, and what lessons have been learned from its implementation so far?
Despite its growth, Tangible Data continues to face challenges, particularly in scaling its educational programme. Many schools lack the funding and scheduling flexibility needed to implement the curriculum fully.
The initiative also requires additional educators to meet the growing demand and relies on foundation support to subsidise programme costs. These constraints highlight the need for more robust funding mechanisms to support open data education.
The project remains a lean operation, and with limited resources, the team has adopted a do-it-yourself approach. They have self-taught a wide range of technical skills, including web development, analytics, AI integration and 3D printing. Sculptures are produced using rotational extrusion and laser cutting techniques, and each piece includes embedded QR or near-field communication codes that link to contextual data and calls to action.
A persistent barrier to impact is the limited reuse of open data. The team has called for more funding schemes that support start-ups focused on data reuse for education, accessibility and social awareness. They also advocate for a more active role for museums in curating and preserving open datasets, proposing the concept of ‘data museums’, or museums that serve as public repositories and engagement platforms for open data.
What are the future goals of Tangible Data?
Looking ahead, Tangible Data aims to exhibit large-scale sculptures in public spaces, beginning in cities like Madrid. In 2025, Tangible Data entered a new phase of visibility and impact with the inauguration of its flagship installation, the ‘Tangible climate’ sculpture. Measuring 3 cubic metres and situated in the gardens of the National Natural Science Museum in Madrid, the sculpture will remain on public display for two years, serving as a landmark for open data and environmental awareness. This milestone anchors a wider strategy to deepen public engagement, including the roll-out of new educational formats. Among them are co-creation labs for secondary-school students, focused on interpreting datasets through physical design – a programme already piloted in schools and set for broader expansion. In parallel, the team is deploying interactive experiences powered by AI, where users explore datasets through gamified learning. To further animate the website, Tangible Data is forging collaborations with artists and cultural spaces to host live performances and creative marathons that activate the sculpture and amplify its message. These initiatives reinforce the project’s commitment to blending data, art and education in ways that are both inclusive and enduring.

Figure 8: The ‘Tangible climate’ sculpture by Tangible Data
Further development of interactive and accessible features is also on the horizon, including tactile elements designed specifically for visually impaired users. Tangible Data remains committed to its founding mission: making data tangible, inclusive and actionable. By combining art, education and technology, the initiative continues to transform open data into a shared public resource – one that informs, inspires and empowers communities across generations.
EU Twinnings: exploring similar regions across Europe with open data
EU Twinnings in a nutshell
|
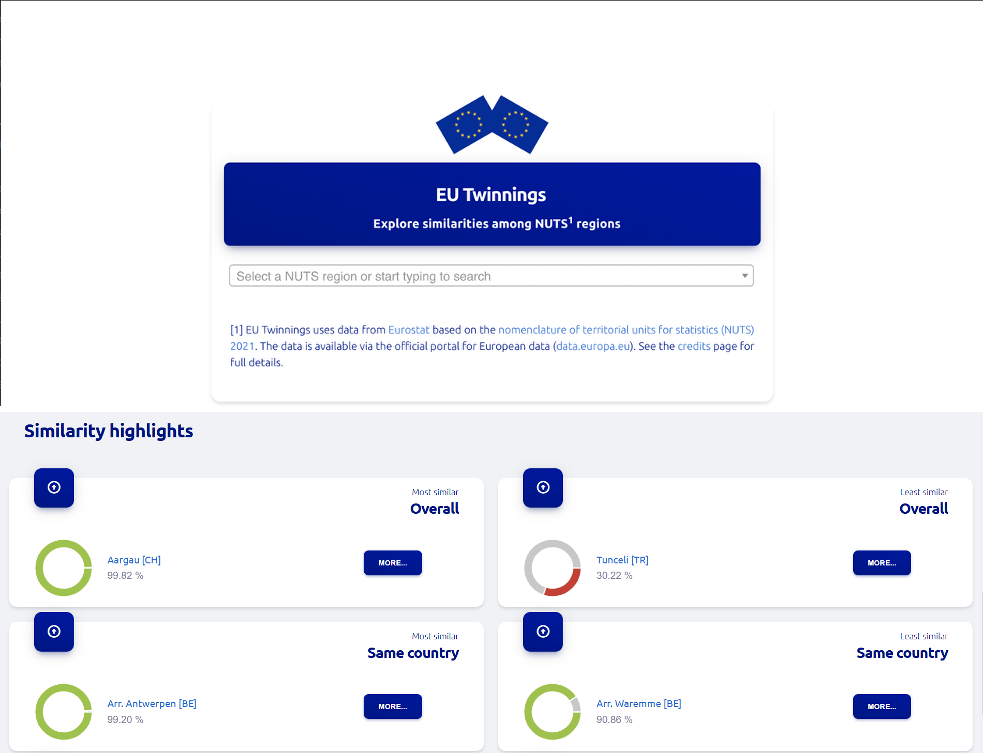
Figure 9: Snapshot of the EU Twinnings web application
The EU Twinnings web application is an exploratory project aiming to make statistics and open data more accessible and understandable. The concept was inspired by an academic paper that measured similarities between works of literature. This idea was then translated into EU Twinnings, allowing users to explore and visualise Eurostat’s statistics on European regions and municipalities, comparing their similarities with others.
The application relies solely on open data from Eurostat, with datasets categorised at both the NUTS 2 (nomenclature of territorial units for statistics) and NUTS 3 levels. EU Twinnings prepares lists of demographic and socioeconomic parameters using the Eurostat JSON API for data retrieval, followed by cleaning and unit testing. This comprehensive instrument offers a wealth of information for exploring regional similarities and differences. Whether comparing economic indicators, demographic trends or cultural characteristics, EU Twinnings provides nuanced and surprising insights into the diverse regions of Europe. From vibrant urban centres to picturesque rural communities, EU Twinnings offers a panoramic view of Europe’s rich variety of cultures and traditions.
How does EU Twinnings create impact?
The application provides an interactive interface where users can select a specific region or municipality in Europe and visualise its similarity to other regions. The similarity is calculated using Eurostat’s open data, covering parameters like population density, fertility, gender, gross domestic product and more. The formula, updated annually, determines the percentage of similarity between two regions based on the chosen parameters. EU Twinnings also offers a rank comparison through spider charts, providing users with detailed insights into specific similarity highlights and across parameters.
EU Twinnings has demonstrated qualitative impact, which suits its non-commercial focus and privacy considerations. Foremost, the application creates new narratives for citizens and policymakers interested in regions and cities. EU Twinnings serves as a valuable resource for policymakers, researchers and citizens alike, facilitating informed decision-making and promoting cross-border collaboration. By exploring regional similarities and harnessing the power of data-driven insights, individuals can contribute to the advancement of regional cooperation and solidarity within the European Union. As Europe continues to evolve and to embrace its cultural diversity, instruments like EU Twinnings play a vital role in promoting mutual understanding and fostering a sense of unity among European nations. Furthermore, during the 2020 EU Datathon, suggestions were made for potential applications of EU Twinnings within Erasmus+, the EU’s programme offering mobility and cooperation opportunities in education, training, youth and sport. In addition, the application’s creator has been sharing information about its coding, showing its value to technical audiences. Given the absence of web analytics, the number of website visitors and online users is unknown. Moreover, it is unclear to what extent the comparisons made by EU Twinnings have led to new twin or sister city partnerships.
How has EU Twinnings developed over the past three years?
From a technical and data point of view the application has been relatively stable. The core features have remained the same ever since its creation in 2020. However, the initiative changed owner during its 2022 and 2025 evolvement. In 2024, the application was officially integrated as an application of the European Data Portal (data.europa.eu). This required partial redevelopment compared to the EU Datathon minimal viable version: documenting main procedures (e.g. on GitHub), updating the data, rewriting scripts and matching formulas (e.g. due to changing table names), and making the application portable to the European Data Portal environment. After these technical preparations, the application, including hosting and intellectual property rights, could be fully transferred to the Publications Office of the European Union.
This use case shows how an individual could develop an idea or initiative to become an integral part of one of the largest data portals in the world.
What challenges has EU Twinnings encountered, and what lessons have been learned from its implementation so far?
Transferring an open data initiative from one party to another can be both fulfilling and challenging. The European Data Portal onboarding process was reasonable, even though it took EU Twinnings some time to formalise the transfer (e.g. contractually). A key factor in the success of the use case was finding the right partners and allies. For example, collaboration with the Eurostat support team was instrumental in turning all levels and layers of the Eurostat data into a coherent data story. The same applies to finding the right datasets, with the proper data licences for reuse. Creating a valuable open data initiative starts with knowing what data is out there and how to tell a story with it. This requires balancing all technical and storytelling capabilities. Some features may be more stable technically, but also less useful or appealing to end users. This trade-off can make or break open data applications. In retrospect, EU Twinnings would have benefited from involving users earlier in the concept development.
What are the future goals of EU Twinnings?
At the moment, no specific updates are planned. However, should resources be allocated to further improving the application, the number of underlying datasets could potentially be expanded. Both Eurostat and other statistical service providers have data on a wide variety of potentially relevant twinning variables. This includes additional data on the economy, live animals and other environmental developments, along with data on weather and climate conditions. Incorporating data from multiple sources, with different time series and across multiple geographical levels, while maintaining statistical reliability and uniformity, would further increase the value of the application. If EU Twinnings can achieve this, it could generate even more powerful comparisons in the future.
Open Food Facts: transforming food choices for health and the environment
Open Food Facts in a nutshell
|
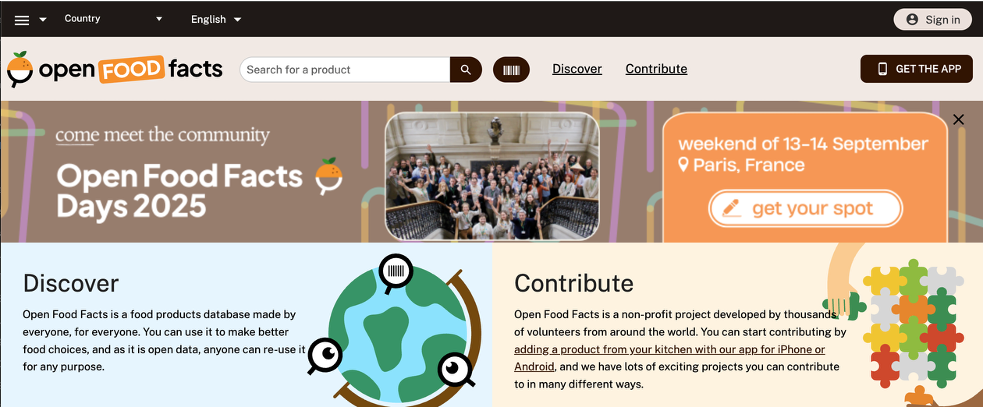
Figure 10: Snapshot of the Open Food Facts website
Open Food Facts has grown from a grassroots initiative into one of the world’s largest open food databases. First featured in Volume I of the observatory, the platform was already a pioneer in food transparency, offering simplified nutritional and environmental scores for millions of products. Volume II captured its expansion into new product categories and its growing scientific and public influence. Volume III now reflects a maturing infrastructure, a more global and diverse community and a sharpened focus on sustainability, data quality and long-term resilience.
How does Open Food Facts create impact?
Open Food Facts empowers consumers, researchers and food producers by making food data open, understandable and actionable. The platform provides simplified indicators such as the Nutri-Score (for nutritional value), the Nova classification (for food processing) and the newly rebranded Green Score (formerly ‘Eco-score’), which evaluates environmental impact.
These scores are based on a combination of user-contributed data, producer uploads and public datasets such as Agribalyse and the United States Department of Agriculture food database.
The platform’s impact is visible across multiple domains. Consumers use it to make healthier and more sustainable choices. Food producers consult it to improve their product profiles. Researchers rely on it for large-scale studies; over 600 scientific papers have referenced Open Food Facts to date. The data is also reused by more than 250 applications, including tools for people with allergies, dietary restrictions or specific health needs.
How has Open Food Facts changed over the past three years?
Over the past three years, Open Food Facts has undergone a remarkable transformation. In 2022, the platform was already a well-established open database with 2.5 million products and a strong presence in France. It had begun to influence food labelling practices through the widespread adoption of the Nutri-Score and was preparing to roll out the Eco-score.
By 2023, the database had grown to over 3 million products, and the team had expanded to eight members. The project broadened its scope beyond food, launching Open Beauty Facts for cosmetics and Open Products Facts for general consumer goods. Data quality became a central focus, with the implementation of over 180 checkpoints to ensure accuracy and reliability. Monthly traffic reached 3 million unique users, and the platform became a reference point for both consumers and the scientific community.
Volume III marks a new phase of globalisation, infrastructure scaling and community empowerment. The volunteer network has expanded to include contributors from India, Morocco and the United States. The platform now hosts over 10 000 reusable product entries, with 25 % of its data still based in France and the rest increasingly sourced from international public databases. The infrastructure has been tested by the rise of AI-powered nutrition apps, prompting a renewed focus on performance and sustainability.
The Green Score has now been applied to over 1 million products. A dedicated platform for food manufacturers provides tailored recommendations on how to improve their environmental impact through better sourcing, manufacturing and labelling practices. Meanwhile, the second version of the Nutri-Score has encouraged producers to reformulate products, and the platform continues to support this shift through improved documentation and onboarding tools.
What challenges has Open Food Facts encountered, and what lessons have been learned from its implementation so far?
One of the most pressing issues facing Open Food Facts is infrastructure stress, particularly due to increased traffic from third-party applications and AI tools. This has highlighted the need for more robust technical support and long-term funding to reduce technical debt.
Another key lesson has been the importance and difficulty of maintaining high-quality documentation and onboarding processes. While the platform’s wiki is collaborative, it can be hard to maintain, and contributors often prefer to focus on niche topics rather than general upkeep. Nonetheless, the community remains active and creative, managing 225 quality checkpoints and keeping error rates below 4 %.
Community engagement has also evolved. Webinars have replaced the less effective roundtables, with 4–5 sessions held annually. In 2025, two scientific webinars attracted 50 global participants, reinforcing the platform’s role as a bridge between open data and academic research. Community animation is now funded, recognising the time and coordination it requires.
Support from the Accélérateur d’Initiatives Citoyennes, a French public innovation accelerator for civic technology and open data, has enabled Open Food Facts to build partnerships with state networks and secure key sponsorships. However, the team continues to seek more flexible funding models. Project-based grants, while helpful, limit long-term planning. The goal is to secure at least 25 % of the annual budget from foundations to ensure sustainability.
What are the future goals of Open Food Facts?
Looking ahead, Open Food Facts aims to deepen its role as a global infrastructure for food transparency. The team plans to enhance the platform’s search engine, allowing users to filter results more intuitively, similar to major e-commerce platforms. There is also a growing focus on sustainability, with plans to provide guidance on extending product life and reducing waste.
The platform will continue to foster win-win partnerships, encouraging data reusers to give back to the ecosystem. It also aims to further automate producer onboarding and improve multilingual support to better serve its growing international community.
At its core, Open Food Facts remains committed to its founding mission: making food data open, reliable and useful for everyone. Whether it is helping a consumer choose a healthier snack, guiding a producer towards more sustainable practices or supporting a researcher with clean, structured data, the platform continues to demonstrate the transformative power of open data in everyday life.
Integreat: empowering municipalities with the integration of migrants and refugees
Integreat in a nutshell
|
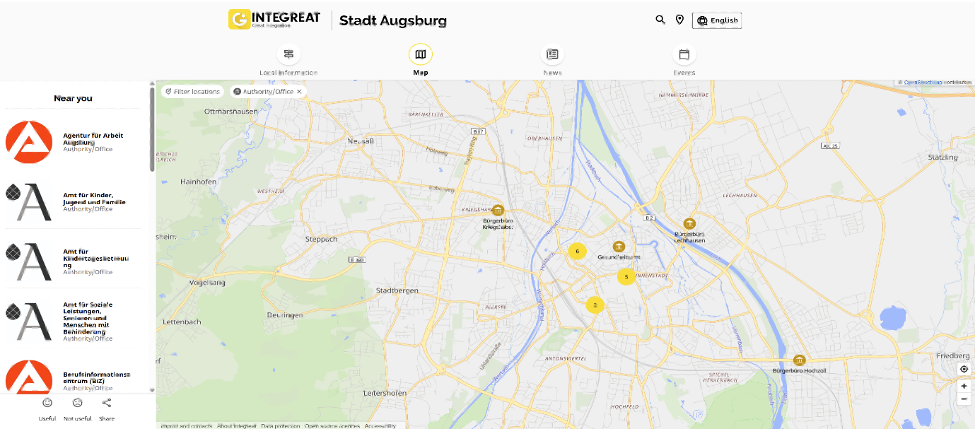
Figure 11: Snapshot of the Integreat portal
The Integreat initiative, launched in Augsburg, Germany, in 2015 under the name ‘Refguide+’, aims to address the challenges faced by migrants and refugees when arriving in a new country, particularly the information and language gaps. It has evolved into a comprehensive integration process tool, helping more than 130 municipalities in Germany. The initiative serves as both a tool for integration and an incentive for municipalities to gather key data.
How does Integreat create impact?
Integreat continues to play a crucial role in supporting the integration of migrants and refugees in Germany by providing them with timely, multilingual and locally relevant information. The platform offers multilingual content on administrative processes, job opportunities, education, social services and relevant updates on topics like COVID-19 and the invasion of Ukraine. Accessible through the application, website or offline brochures, Integreat collaborates closely with municipalities and experts to maintain accurate and up-to-date data.
The initiative supports the integration process, making information available in various languages and facilitating collaboration between municipalities, which curate and maintain the content to ensure that it remains accurate and tailored to local needs. This decentralised model not only enhances the quality of information but also fosters inter-municipal collaboration and standardisation.
The impact of Integreat is assessed through a combination of user metrics, municipal feedback and academic evaluation. With over 100 000 application downloads and millions of web hits, 60 % of which are not in German, the platform has demonstrated growing relevance among its target audience. A randomised control trial partially funded by J-PAL Europe, an organisation specialising in impact evaluations to guide social and development policy, was conducted to assess Integreat’s impact on integration outcomes such as user satisfaction, access to services and participation in the job market. While early findings have been shared internally, the full results have not yet been made publicly available. A larger-scale validation study began in autumn 2023, aiming to provide municipalities with actionable insights to further improve their integration and information services.
How has Integreat developed over the past three years?
Volume III marks a significant milestone in the initiative’s development, reflecting its transition from a promising digital integration tool to a robust, scalable and increasingly data-driven platform. Building on the foundations detailed in Volumes I and II, this latest volume captures its evolving technological sophistication and its strategic positioning within Germany’s digital public service landscape.
Initially launched in 2015 as a volunteer-driven initiative, Integreat has grown into a structured non-governmental organisation with a team of 37 professionals, half of which are developers, supported by a service team assisting municipalities and a social team engaging with users. Volume I documented its early expansion and reliance on public funding with 90 partner municipalities, and Volume II captured its transition to a self-sustaining model with 108 municipalities. Volume III shows the platform is now active in 137 municipalities across Germany. Each municipality signs an individual contract, often including a paid social media campaign to boost local engagement and impact.
Integreat’s technological capabilities have significantly evolved. While earlier volumes emphasised multilingual access and ease of use, Volume III introduces a suite of accessibility features, such as text-to-speech and use of automatic translations, push notifications tailored by each municipality, and a readability scoring system to ensure content clarity. A notable innovation is the development of a chat-based search assistant, currently being piloted in Munich, to help users navigate the platform more intuitively.
Integreat’s commitment to open data remains central. All content continues to be published under the Creative Commons (CC BY 4.0) licence, and the platform’s source code is openly available under the Massachusetts Institute of Technology licence. However, Volume III reveals a deeper cultural shift wherein municipalities not only input the data but also reuse it. While municipalities retain full responsibility for the accuracy and relevance of their content, Integreat supports this process by offering feedback mechanisms and tools to help ensure clarity, consistency and accessibility across the platform.
Earlier volumes highlighted the difficulty of measuring user impact, particularly due to offline access and limited analytics. However, Volume III presents more concrete evidence of Integreat’s effectiveness. For example, newcomers now report that they know essential information such as which emergency number to call – an indicator of improved access to critical services. Early findings from the randomised control trial, despite some methodological limitations, suggest that Integreat contributes to greater satisfaction with life in Germany, more positive integration experiences and improved access to the job market. The platform has recorded 4.5 million annual hits in 2024, with approximately 60 % of traffic not in German, reflecting its growing relevance among migrant and refugee communities. In terms of user reach, the Android application alone has been downloaded over 100 000 times. Due to Integreat’s commitment to data minimisation and privacy, comprehensive usage statistics are limited, though tools like the Google Search Console provide insights into key search behaviours and content engagement.
What challenges has Integreat encountered, and what lessons have been learned from its implementation so far?
Despite Integreat’s successes, some challenges remain as many municipalities struggle with limited human resources to update the content in a timely manner. Additionally, in launching a politically sensitive initiative, political dynamics at the local level can delay the publication of sensitive or critical content, affecting the consistency and responsiveness of the platform across regions.
Further, the pilot implementation in Greece clearly demonstrated the critical role of local context in launching civil-society initiatives. Success depended not only on the technology itself but on the presence of an in-country project team with deep expertise in the national information technology infrastructure, migration ecosystem and institutional landscape. This local knowledge was essential for tailoring the initiative to the specific environment and ensuring its relevance and effectiveness. These experiences also reinforce that the true value of open data lies not merely in transparency, but in its ability to enhance the practical utility of the platform and support meaningful, context-sensitive implementation.
Nonetheless, Integreat’s key success is rooted in its collaborative approach. As a neutral and trusted platform, it fosters cooperation among municipalities and stakeholders, enabling shared learning and collective improvement of the integration services.
What are the future goals of Integreat?
Looking ahead, Integreat plans to continue investing in technological innovation, including its development of a chat-based search assistant, further improvements in accessibility and deeper integration with other local platforms. Through workshops, feedback loops and impact reporting, Integreat aims to continue sharing knowledge and best practices, positioning itself as a lighthouse initiative for digital public service delivery and migrant integration.
3.4 Environmental impact
Digital Forest Dryads: using open satellite imagery to protect forests from illegal deforestation
Digital Forest Dryads in a nutshell
|
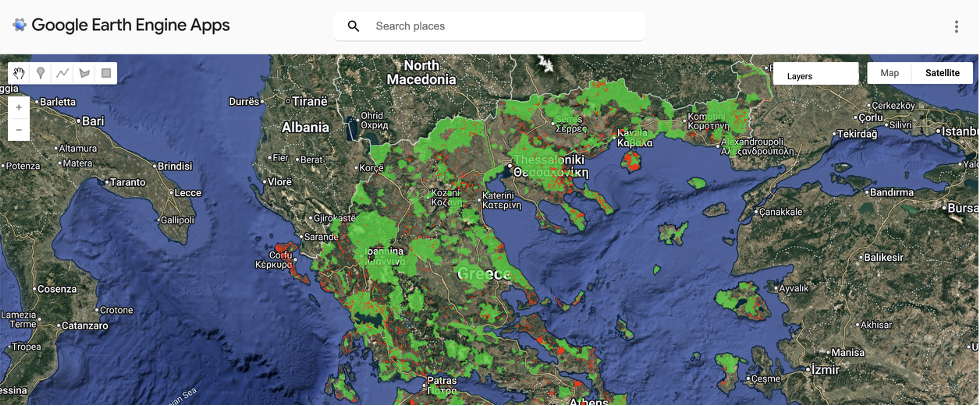
Figure 12: Snapshot of the Digital Forest Dryads portal
Digital Forest Dryads, developed by a Romanian team during the 2020 EU Datathon, remains a pioneering initiative in the use of open satellite imagery to combat illegal deforestation. First featured in Volume I of the observatory, the platform introduced an interactive map that visualises forest loss across Europe, distinguishing between legal and illegal deforestation using multispectral satellite data. Volume II captured the project’s growing recognition, including its influence on Romanian government policy and the development of spin-off tools. Volume III reflects a year of stability, with the platform remaining active and relevant, even in the absence of major new developments.
How does Digital Forest Dryads create impact?
Digital Forest Dryads empowers environmental authorities, policymakers and the public by providing a clear, data-driven view of deforestation patterns across Europe. The platform combines open geospatial data from sources such as Copernicus, Eurostat and Google Earth with custom-built algorithms to detect forest loss. Users can explore an interactive map that highlights areas of concern areas of deforestation (red), protected forests (green), legal deforestation (yellow dots) and illegal action (red dots) on the interactive map:
The application has been instrumental in raising awareness about illegal logging, particularly in Romania, where it has helped visualise the scale and distribution of forest degradation. The platform’s data is updated every five to six days, and although it is based on historical data from 2017 to 2019, it continues to serve as a valuable reference for environmental monitoring and advocacy.
How has Digital Forest Dryads developed over the past three years?
Over the past three years, Digital Forest Dryads has evolved from a proof-of-concept into a recognised tool for forest protection. In 2022, the platform was already gaining traction among environmental authorities and non-governmental organisations, with monthly usage ranging between 800 and 1 000 users. The Romanian government expressed interest in reusing the concept, and the team received support through the EU Recovery and Resilience Facility.
By 2023, the initiative had expanded its geographic coverage to include countries such as Albania, Belgium, Bulgaria, Croatia, France, Germany, Greece, Hungary, Italy and Spain. The team also launched two related projects: Wood Watcher, an application that estimates wood volume from photos, and a second tool that received recognition from the International Criminal Police Organization for its contribution to combating illegal timber trafficking.
Volume III marks a year of continuity. While no major updates were introduced, the platform remains active and accessible. The team confirmed that the application continues to serve its intended purpose, and interest from users and collaborators persists. This period of stability reflects the enduring value of the platform, even in the absence of new features or funding.
What challenges has Digital Forest Dryads encountered, and what lessons have been learned from its implementation so far?
The primary challenge for Digital Forest Dryads remains financial sustainability. Despite its proven utility, the platform has not secured the substantial funding required to process newer satellite data or expand its technical capabilities. The team has estimated that updating the system with current data would require only a fraction of the cost of traditional forest monitoring methods, yet this investment has not materialised.
Another challenge is the reliance on a small team and the limited infrastructure. While the platform’s core functionality remains intact, scaling it to meet growing demand or integrating real-time data would require additional resources and institutional support.
Nonetheless, the project has demonstrated the power of open data and civic innovation. By combining technical expertise with environmental commitment, the team has created a tool that continues to inform, inspire and support efforts to protect Europe’s forests.
What are the future goals of Digital Forest Dryads?
Although no new developments were reported this year, the team remains open to collaboration and future growth. Their long-term vision includes updating the platform with more recent satellite data, expanding its geographic scope and integrating predictive analytics to anticipate deforestation risks.
The team also hopes to secure more stable funding, ideally through partnerships with environmental agencies, EU programmes or philanthropic foundations. In the meantime, Digital Forest Dryads continues to serve as a model for how open data and geospatial technology can be harnessed to address one of Europe’s most pressing environmental challenges.
Air Quality in Cyprus: informing citizens about air pollution across the island
Air Quality in Cyprus in a nutshell
|
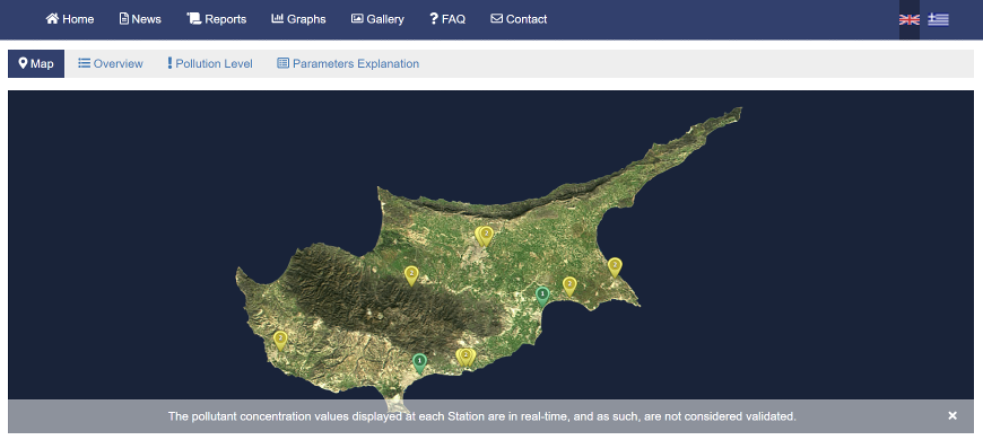
Figure 13: Snapshot of the Air Quality in Cyprus website
Air Quality in Cyprus, managed by the Department of Labour Inspection under the Ministry of Labour and Social Insurance, has evolved into a trusted national platform for real-time air pollution monitoring. First introduced in Volume I of the observatory, the initiative was already providing critical health information through its website and mobile applications. Volume II captured its growing user base, improved accessibility and early ambitions to develop forecasting tools. Volume III now reflects a maturing system, with enhanced infrastructure, expanded outreach and a renewed focus on data integration and public engagement.
How does Air Quality in Cyprus create impact?
Air Quality in Cyprus provides residents with real-time data on air pollution levels across the island, helping them make informed decisions to protect their health. The platform draws on data from nine national air quality monitoring stations, measuring pollutants such as ozone, nitrogen oxides, sulfur dioxide, carbon monoxide, benzene and particulate matter (particles with a diameter of 10 micrometers or less and particles with a diameter of 2.5 micrometers or less).
This data is updated every two minutes in the back-end system and displayed on the website and mobile applications with colour-coded indicators and health risk explanations.
The platform plays a vital role in public health communication. When pollution levels exceed safety thresholds, alerts are issued to relevant ministries, schools, the media and the public. During dust storms, for example, the Department of Labour Inspection provides targeted advice to vulnerable groups, including children, older people and individuals with respiratory conditions. The platform also offers educational content on pollution sources, health effects and relevant legislation, reinforcing its role as both a monitoring tool and a public awareness resource.
How has Air Quality in Cyprus changed over the past three years?
Over the past three years, Air Quality in Cyprus has steadily evolved from a static monitoring platform into a more dynamic and responsive system. In 2022, the platform was already well established, attracting over 800 000 annual website visitors and around 10 000 users per mobile application. It had recently enhanced accessibility for visually impaired users and was exploring the development of a forecasting tool.
By 2023, the team had begun refining the forecasting system, acknowledging the challenge of balancing accuracy with the risk of causing unnecessary alarm. Internal improvements were under way, though not yet visible to the public. The focus was on maintaining high-quality real-time data while preparing for more predictive capabilities.
Volume III marks a turning point. The platform has made significant progress in developing its forecasting functionality, with a dedicated section now in the works. This effort involves integrating open data from meteorological institutes to account for variables such as wind, temperature and humidity. The team has also improved the back-end infrastructure to handle increased data loads and ensure system stability.
Community engagement has expanded as well. The team now runs regular webinars to replace the less effective roundtables, including two scientific sessions in 2025 that attracted 50 participants from across the globe. These sessions have helped build trust and foster collaboration with researchers, environmental professionals and educators.
What challenges has Air Quality in Cyprus encountered, and what lessons have been learned from its implementation so far?
One of the key challenges has been the development of accurate forecasting tools without triggering public anxiety. Forecasting air pollution involves complex variables and requires careful communication to avoid misinterpretation. The team has taken a cautious, iterative approach, prioritising reliability and clarity over speed.
Another challenge has been managing the platform’s infrastructure. As user demand grows and new features are added, the system must remain stable and responsive. This has required ongoing investment in back-end improvements and data integration capabilities.
A major lesson learned is the importance of collaboration. The forecasting tool, for example, depends on partnerships with meteorological agencies and other data providers. Internally, the team has also recognised the value of cross-departmental coordination to ensure timely alerts and consistent messaging.
What are the future goals of Air Quality in Cyprus?
Looking ahead, Air Quality in Cyprus aims to fully launch its forecasting section, offering users predictive insights alongside real-time data. The goal is to provide accurate, actionable forecasts that help residents plan their activities and reduce exposure to harmful pollutants. This will require continued collaboration with external data providers and further refinement of the platform’s algorithms.
The team also plans to enhance user experience by improving the mobile application interface and expanding educational content. There is interest in developing more targeted alerts for specific user groups, such as schools or healthcare providers, and in exploring the use of AI to personalise recommendations.
At its core, the initiative remains committed to protecting public health through transparent, accessible and science-based information. By combining real-time monitoring with predictive tools and community engagement, Air Quality in Cyprus continues to set a strong example of how open data can serve the public good.
Planttes: improving lives through pollen awareness
Planttes in a nutshell
|
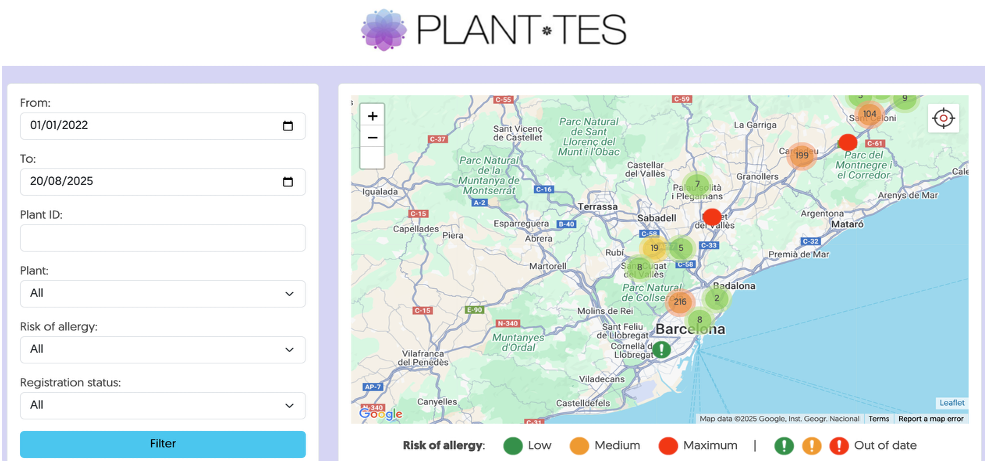
Figure 14: Snapshot of the Planttes portal
Planttes, a citizen-science initiative launched in Spain, continues to empower individuals with pollen allergies by providing real-time, community-sourced information on allergenic plants in bloom. First featured in Volume I of the observatory, the application introduced a participatory model where users contributed photos and phenological data to build a personalised allergenic risk map. Volume II captured the project’s growing reach and its role in bridging environmental data with public health awareness. Volume III reflects a year of continuity and digital refinement, with the platform remaining active and gaining visibility through academic and citizen-science networks.
How does Planttes create impact?
Planttes helps users understand which allergenic plants are blooming in their surroundings and whether this may trigger their allergies. Through its web platform, users can contribute to a shared map by uploading photos and tagging the phenological state of plants, indicating whether they have closed flowers, open flowers or fruit.
This crowdsourced data is validated by researchers and used to classify allergenic risk into three categories: low risk (no flowers or fruit), increasing risk (closed flowers) and maximum risk (open flowers).
The platform integrates open data from the Point of Information on Aerobiology, which uses pollen samplers and weather variables to generate daily allergy scores. These scores help users plan their activities and reduce exposure to allergens. With over 1ᵒ000 application downloads in its earlier phases and around 65ᵒ000 annual website visitors, Planttes continues to serve as a valuable tool for people with allergies, along with educators and researchers.
How has Planttes developed over the past three years?
Over the past three years, Planttes has maintained its core functionality while refining its digital presence. In 2022, the application was gaining traction among people with allergies and educators, with a growing database of plant observations and validated entries. By 2023, the initiative had solidified its role as a citizen-science platform, engaging students and researchers in mapping allergenic plants and raising awareness about the impact of climate change on pollen patterns.
Volume III marks a year of sustained activity. The platform remains active and is now primarily accessed via its web interface, which continues to display new user contributions and validated entries. The project is still supported by Thigis, a civic technology and environmental data design studio that co-developed the Planttes platform to track allergenic plant phenology. Planttes also continues to be promoted through academic institutions such as the Institute of Environmental Science and Technology at the Autonomous University of Barcelona, and the University of Granada. A spring 2024 LinkedIn post from Thigis encouraged public participation during the blooming season, confirming the platform’s ongoing relevance and outreach efforts.
While the mobile application is no longer prominently featured or promoted, there is no official statement confirming its discontinuation. The current focus appears to be on the web-based platform, which offers broader accessibility and easier maintenance.
What challenges has Planttes encountered, and what lessons have been learned from its implementation so far?
One of the main challenges remains expanding geographic coverage beyond Catalonia and Granada (in Andalucía), where most of the current data is concentrated. Another challenge is maintaining user engagement and data validation, which relies on a small team of researchers and contributors.
Despite these challenges, Planttes has demonstrated the power of citizen science in addressing environmental and health challenges. The initiative has successfully engaged users in scientific data collection, fostered environmental education and provided practical support for allergy management. It also contributes to long-term climate monitoring by tracking changes in plant phenology over time.
What are the future goals of Planntes?
Looking ahead, Planttes aims to expand its geographic reach and deepen its educational outreach. The team plans to continue working with schools and community groups to encourage participation in plant mapping and phenological observation. There is also interest in integrating more real-time pollen data and enhancing the platform’s predictive capabilities.
Planttes remains a model for how community-driven science can improve public health and environmental awareness. In a year of digital continuity, its impact remains strong and its potential for growth endures.
Environ-Mate: empowering kids with knowledge about climate change
Environ-Mate in a nutshell
|
Figure 15: Snapshot of the Environ-Mate portal
Launched in 2019 as a response to the EU Datathon challenge ‘Tackling climate change’, Environ-Mate is a web-based educational platform designed to teach children aged 10 to 14 about climate change using open data. Developed by a small team at the German data collective FELD M, the platform combines scientific rigor with intuitive design to make complex environmental data accessible to young audiences. It guides users through key climate topics such as greenhouse gas emissions, regional comparisons, extreme weather events and individual action to mitigate climate change.
How does Environ-Mate create impact?
Environ-Mate continues to serve as a unique educational tool by translating complex climate data into engaging, age-appropriate content.
The platform offers a modular experience, where each data visualisation, such as carbon dioxide emissions per country or sea level rise projections, functions as a standalone story. These stories are presented through a user-friendly interface, supported by assistant characters and are accessible without requiring user accounts or tracking.
Due to its commitment to privacy and data minimisation, Environ-Mate does not track user behaviour. However, feedback from educators, children and early users has been positive. Children report better understanding of climate issues, and teachers have expressed interest in using the tool in classrooms. The platform’s open-source nature and Creative Commons licencing further extend its reach, allowing others to reuse and adapt its content.
How has Environ-Mate developed over the past three years?
Volume III marks a period of reflection and strategic repositioning for Environ-Mate. While the platform remains live and functional, its development has slowed due to limited resources and shifting priorities. Compared to Volume I, which captured the platform’s launch and early enthusiasm, and Volume II, which documented its continued presence and modest updates, Volume III highlights a more mature understanding of the challenges and opportunities in sustaining open data initiatives.
A major back-end overhaul is under way to address outdated packages and changes in third-party APIs, such as the city lookup service, which is now paid. The platform’s modular architecture remains a key strength, allowing for the easy addition of new stories. While no major new features have been introduced recently, the team has maintained the platform’s core functionality and relevance.
What challenges has Environ-Mate encountered, and what lessons have been learned from its implementation so far?
Despite its innovative approach, Environ-Mate has faced several challenges. Maintaining regular updates and school partnerships has proven difficult without dedicated funding or institutional support. The team observed that limited follow-up opportunities after the EU Datathon made it challenging to explore scaling options or secure long-term funding. The absence of user tracking, while ethically sound, has made it harder to quantify impact or demonstrate effectiveness to potential partners.
Nonetheless, the team’s commitment to open data and ethical design has remained strong. The platform’s modularity, privacy-first approach and open-source foundation continue to serve as a model for responsible digital education tools.
What are the future goals of Environ-Mate?
Looking ahead, the Environ-Mate team remains committed to its mission of educating young people about climate change. Future goals include adding more localised data, such as city- or region-specific climate impacts, and enabling user-generated content through AI-assisted storytelling tools. The team is also exploring new educational content focused on biodiversity, which they see as an underrepresented yet critical topic.
Beyond the platform itself, the team continues to work on related projects, including wildlife tracking and infrastructure for managing environmental data. These efforts reflect a shift towards long-term sustainability and impact, rooted in the same principles that inspired Environ-Mate in the first place.
4. Key learnings
4.1 Learnings from the four impact dimensions
Economic impact: catalysing growth and efficiency
The use case Naar Jobs illustrates how the reuse of open data can drive regional employment by matching job seekers with nearby opportunities. Open data services and products may be at the heart of some businesses and professions, such as open data portal vendors and open data scholars. For other professionals, such as policymakers and urban planners, open data is one of many drivers for jobs and economic growth. In both cases, open data can help organisations become more efficient, especially when initiatives can be scaled. Naar Jobs exemplifies that beyond direct and indirect open data jobs, open data can also fulfil an intermediary role, by enabling recruitment and hiring procedures. It can foster innovation in the labour market and can contribute to the growth of specific companies and industries.
Governmental impact: enhancing accountable decision-making
The open data use cases Waar is mijn stemlokaal? and Statsregnskapet.no demonstrate how open data can strengthen democratic participation and transparency. By reusing open data, initiatives can empower citizens and improve decision-making procedures. Open data on polling stations, government spending and other public sector domains also benefit media stakeholders, along with internal policymakers. The facts and insights derived from open data serve as key input for meaningful social dialogue, resulting in higher levels of trust and greater accountability. Individuals benefit from well-supported civic engagement opportunities, while governments can respond more effectively to public needs and rapidly changing societal developments.
Social impact: fostering collaboration, inclusion and welfare
The impact of initiatives such as UniversiDATA-Lab, VisImE-360, Tangible Data, EU Twinnings, Open Food Facts and Integreat underlines the potential of open data to enhance inclusion, improve health conditions, foster collaboration and create new educational opportunities. Society-driven open data tools, platforms and communities can help amplify the voices of vulnerable and unheard groups, advocate for higher quality standards and embrace cohesion. These use cases highlight how open data can bridge societal gaps and promote equity on multiple levels. Even though some open data use cases have impacted the lives of thousands of people, social initiatives also exemplify that even improving the life of a single individual is worth reusing open data for and can make a lasting difference.
Environmental impact: realising green and clean societies
Open data is a powerful ally in environmental protection, as shown by initiatives addressing deforestation, air quality, pollen allergies and climate education. Digital Forest Dryads, Air Quality in Cyprus, Planttes and Environ-Mate prove that reusing different types of open data can bring practical solutions and instruments to improve environmental conditions. In some cases, open data helps raise awareness in an evidence-based way, while in other cases the reuse of open data enables actual interventions from both individuals and organisations in the public and private sectors.
While some environmental impact driven by open data may be direct and visible, other effects from sustainable behaviour and future-proof policies are to be seen in the longer term.
4.2 Learnings from long-term use case development
Over the past three years, the 13 use cases have demonstrated that long-term success in open data initiatives is shaped not only by innovative ideas and societal relevance, but also by the ability to manage practical considerations such as funding, data quality and collaboration. While challenges like securing sustainable resources or ensuring data consistency do arise, they also present opportunities to explore creative solutions, from hybrid funding models to participatory data ecosystems. These experiences show that with the right support structures, ethical practices and user engagement, open data initiatives can adapt and grow to deliver meaningful impact over time.
Finding funding, business and support models
Sustainable funding and viable business models are essential for scaling open data initiatives. Several use cases, such as VisImE-360 and Tangible Data, experienced limited progress due to limited financial resources, despite their societal value. Conversely, Integreat demonstrates how a diversified model with municipal contracts can ensure long-term viability. Individuals and organisations seeking impact with open data may explore specific funding and business models or set up hybrid models, combining public or research grants, service contracts, private sector investments and incubators, along with community support. Government support plays a pivotal role in enabling open data innovation. Initiatives like Waar is mijn stemlokaal? and Tangible Data have benefited from public funding and policy support, while other projects have not managed to secure institutional backing. Beyond financial resources, open data use cases also require broader collaboration and support models in order to be successful over time and adapt to emerging needs and conditions. Innovation challenges and datathons, technical assistance, supporting networks and knowledge-sharing platforms can all help kick-start open data use cases or support initiatives in scaling to the next level.
Broadening open data supply concepts
The observatory highlights the growing importance of integrating traditional open data with crowdsourced and non-institutional data. Projects like Planttes and Open Food Facts show that expanding citizen science and exploring creative data reuse can push the boundaries of open data. New open data supply approaches can enrich existing open datasets, promote more participatory types of data provision and address gaps in official government statistics. Further exploration of hybrid data ecosystems that combine institutional, scientific and citizen-generated open data may be worthwhile, despite the challenges of ensuring quality, consistency and interoperability. Equally, open data reuse is not limited to the EU: in addition to the EU-27 Member States, open data is widely available in other European countries and beyond. Use cases from Norway (Statsregnskapet.no) and the United Kingdom (EU Twinnings) show that non-EU data can be valuable, while reusers outside the EU also benefit from EU open data sources. These cases highlight the importance of cross-border collaboration and shared standards, licences and reuse practices. As this broader view of open data continues to evolve, it holds promise for driving new opportunities for innovation and impact. However, realising this potential also requires careful attention to ethical considerations and the use of trustworthy, high-quality data.
Involving end users throughout the full open data life cycle
The 13 use cases followed over the last three years have shown that end-user involvement is critical for ensuring relevance, usability and impact. Higher impact and more meaningful results are often achieved whenever open data reuse incorporates a degree of co-creation with users. This can occur through feedback loops, stakeholder consultations, accessibility features or multilingual content, all of which may enhance adoption and trust. Moreover, successful open data initiatives require more than a one-off interaction with end users.
Incorporating user participation from design to evaluation – including usability testing, iterative development and the continuous improvement of tailored services and products – ensures that open data services meet real-world needs and stay relevant over time.
Crucially, data literacy plays a foundational role throughout this life cycle, empowering users to interpret, apply and contribute to open data effectively and responsibly.
Rethinking open data value and impact measurement
The observatory shows that open data impact is not static. It can take different forms and can evolve over time. Measuring impact helps open data initiatives monitor their progress, accelerate, steer their course and celebrate success. It has become clear that impact can be made on different levels, too. Sometimes the reuse of open data directly affects individuals, while in other cases it impacts organisations or even macro-societal developments. Therefore, open data impact should be assessed beyond short-term quantitative gains. Policymakers, academics and organisations analysing open data impact may need to rethink the longitudinal and multidimensional sides of open data impact measurement frameworks. Different use cases may require different quantitative and qualitative indicators to track user engagement over time, assess policy influence or reveal the indirect benefits for the economy, government, society and the environment. Ultimately, a broader impact lens ensures that open data’s full value is recognised, supported and strengthened.
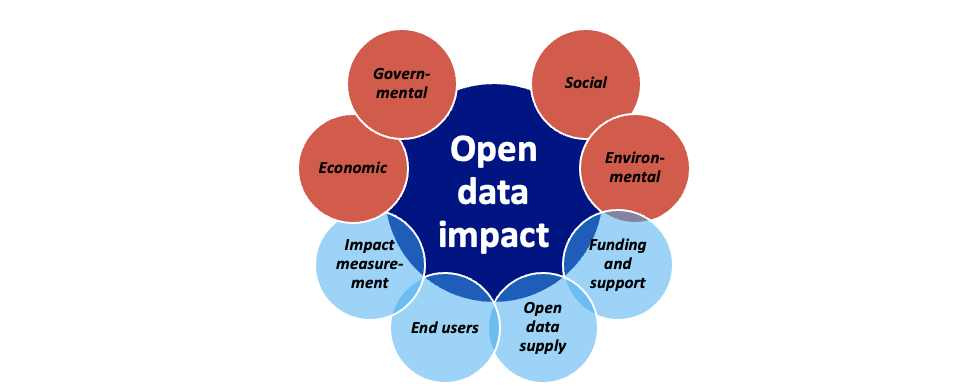
Figure 16: Open data impact domains and factors
5. Conclusions
The use case observatory was initiated to support the European Data Portal’s broader mission of measuring the impact of open data across Europe from 2022 to 2025. Volume III reaffirms the transformative potential of open data, building on the foundations laid in the previous volumes and continuing to monitor and analyse the real-world impact of open data through 13 diverse use cases.
These cases span economic, governmental, social and environmental domains, offering a nuanced understanding of how open data contributes to innovation, transparency, inclusion and sustainability. The findings demonstrate that open data is not a one-size-fits-all solution, but a flexible enabler of value creation. Economically, open data supports job matching and regional development, as illustrated by Naar Jobs. Governmental use cases such as Waar is mijn stemlokaal? and Statsregnskapet.no show how open data enhances democratic participation and public accountability. Socially, initiatives like Integreat and Open Food Facts highlight how open data empowers vulnerable communities and promotes healthier, more informed choices. Environmentally, projects such as Digital Forest Dryads and Air Quality in Cyprus demonstrate how open data can drive citizen engagement and policy action in response to ecological challenges.
Beyond these impact dimensions, the observatory identifies several cross-cutting lessons. Sustainable funding and robust business models are critical for long-term viability. End-user involvement throughout the data life cycle enhances relevance and trust. Expanding the definition of open data to include citizen-generated and hybrid sources can unlock new forms of value. Measuring impact requires a broader, longitudinal perspective that captures social and environmental outcomes alongside economic metrics.
The observatory also underscores the importance of European collaboration. While Member States benefit from shared frameworks, cases from Norway and the United Kingdom show that innovation thrives across borders. Strengthening interoperability, multilingual access and cross-national data flows will be key to scaling impact.
In sum, Volume III reinforces the importance of continued investment in open data ecosystems. By supporting diverse use cases, fostering collaboration and embedding open data into public services and civic life, Europe can utilise its full potential to address complex societal challenges and drive inclusive, data-driven transformation.
Annex I – List of interviewees
Are you about to start a new initiative powered by open data or are you seeking ways to scale up your existing open data initiative? The following initiatives can be reached in case you would like to receive more information about their specific use case and lessons learned.
| No | Use case | Interviewee | Contact information |
| 1 | Naar Jobs | Han Tambuyzer | han@nazka.be |
| 2 | Waar is mijn stemlokaal? | Tim Vos-Goedhart | tim@openstate.eu |
| 3 | Statsregnskapet.no | John André Jakobsen | john.andre.jakobsen@dfo.no |
| 4 | UniversiDATA-Lab | Juan Jesús Alcolea Picazo | jjalcolea@dimetrical.es |
| José Arbues Bedia | jarbues@ucm.es | ||
| 5 | VisImE-360 | Boris Bikbov | boris.bikbov@scientific-tools.org via website https://Scientific-Tools.Org |
| 6 | Tangible Data | Antonio Moneo | antoniomoneo@gmail.com |
| 7 | EU Twinnings | Giuseppe Sollazzo | puntofisso@gmail.com |
| 8 | Open Food Facts | Stéphane Gigandet | stephane@openfoodfacts.org |
| 9 | Integreat | Clara Barcklo | clara.bracklo@tuerantuer.org |
| 10 | Digital Forest Dryads | n/a | n/a ([1]) |
| 11 | Air Quality in Cyprus | Chrysanthos Savvides | csavvides@dli.mlsi.gov.cy |
| 12 | Planttes | Jordina Belmonte Soler | jordina.belmonte@uab.cat |
| 13 | Environ-Mate | Matthias Bock | matthias.boeck@feld-m.de |
Annex II – Indicative interview questions
Can you briefly describe the changes in the idea behind your use case is last year?
- What is its purpose? What is its target audience? What size is the team?
Can you briefly describe the changes/additions in the data that was used for creating x?
- Is your initiative only based on publicly accessible data (open data)?
- If not, which other data sources were consulted?
- Where did you find the (open) data?
- What is its licence?
- How do you process open data? Any cleansing, structuring, manipulations
,or modelling techniques? - Would it have been possible to develop your initiative without open data? If not, why?
Can you briefly describe the impact that x is having on its audience, with respect to its purpose?
- Do you still monitor the performance of your website? For example, do you know the number of daily/monthly active users?
- Do you regularly collect feedback from users? Is this feedback proving a general satisfaction of users with the website?
- How has x been developing since your win/participation in the EU Datathon?
- How do you plan to further develop from now to the next two years? Is there any ambition or business projection that you would like to share with us?
What are the biggest achievements in terms of impact since the previous interview?
- Bigger reach? Publicity? Promotion?
- What are the biggest challenges while working with open data?
([1]) Initiative owner reported no updates, thereby no interview was scheduled.