
Executive summary
This report presents a common EU methodology for assessing the impact of open data. While open data is a recognised driver of economic activity, innovation and transparency, the absence of a unified measurement framework has historically resulted in fragmented and incomparable findings. Increasingly, open data is also part of discussions about digital sovereignty and strategic autonomy (particularly as it relates to AI development). This study addresses this gap by establishing a robust methodology to quantify value across four dimensions: economic, social, environmental and strategic.
The methodology is built upon the open data value chain and a results-chain logic that distinguishes between direct outputs (ecosystem health), intermediate outcomes (behavioural shifts) and long-term impacts (societal benefits). The framework is organised into two interconnected parts.
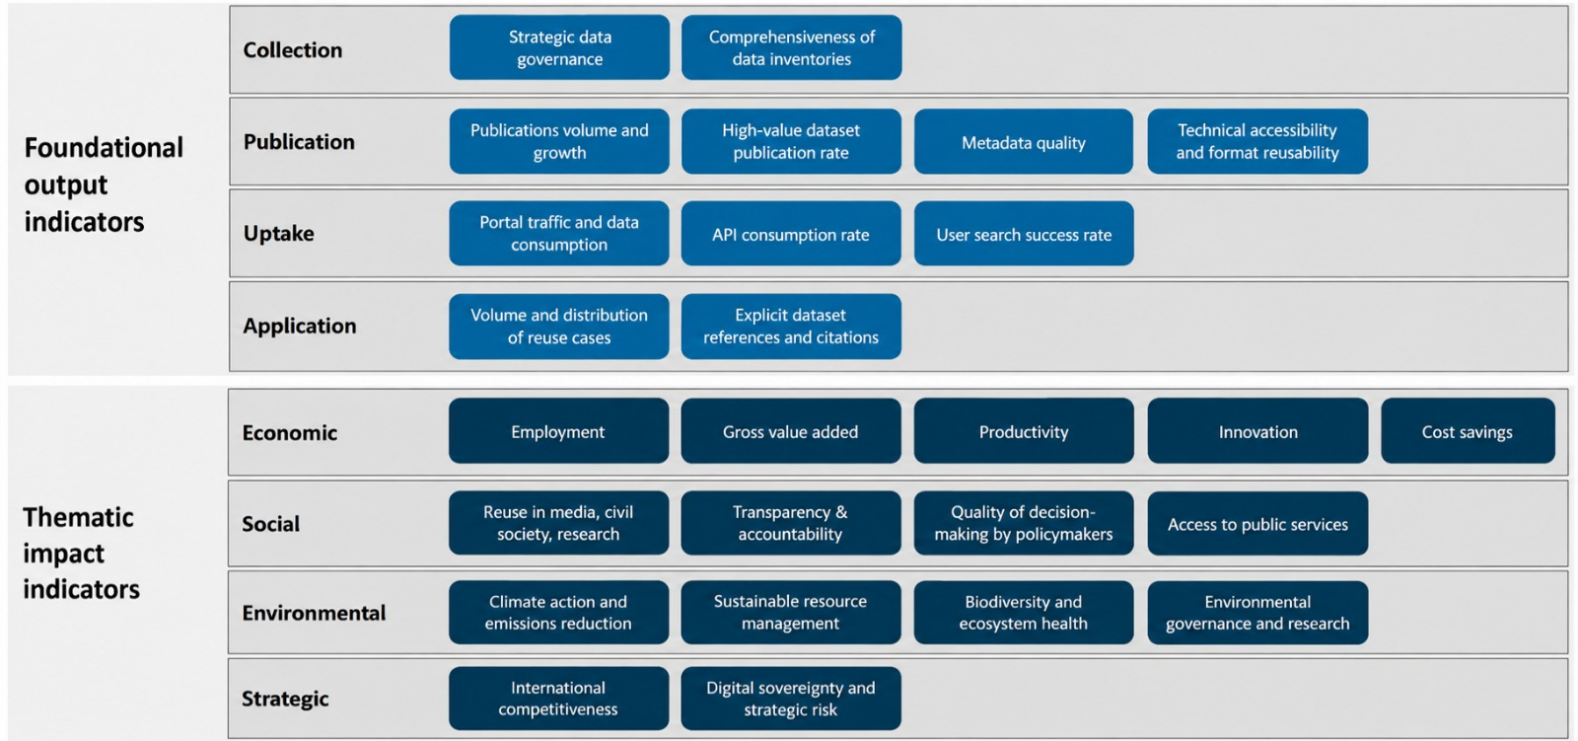
- Foundational output indicators. These assess the essential preconditions for impact, covering the four stages of the value chain: collection, publication, uptake and application. They provide real-time diagnostic intelligence for portal operators and policy coordinators.
- Thematic impact indicators. These measure real-world effects, such as job creation, gross value added (GVA), environmental reporting quality and digital sovereignty.
To ensure feasibility, the framework provides a phased measurement pathway. Practical protocols utilise currently available administrative data and model-based estimates to establish an immediate baseline. Comprehensive protocols set a long-term roadmap for more precise, automated measurement as national capabilities mature.
Targeted consultations with the Public Sector Information Expert Group, through surveys, interviews and workshops, provided critical insights into the framework’s viability. While initial survey results indicated low perceived relevance for a new reporting exercise (average rating of 1.36 out of 5), qualitative interviews clarified that this was a response to the potential administrative burden rather than the methodology itself.
EU Member States expressed a clear mandate for a methodology that moves beyond qualitative maturity benchmarks toward evidence-led performance monitoring. There is a strong consensus that the open data maturity assessment should evolve to incorporate these more rigorous metrics [1]. This would allow administrations to justify the significant financial investment in data portals by demonstrating tangible socioeconomic returns.
The framework was piloted in Estonia, Italy, the Netherlands and Poland. The pilot confirmed that the technical foundations for impact are largely in place, with high publication volumes and strong performance in metadata quality. Additional analysis was done at the EU level. Key empirical findings include the following.
- Economic impact. The study estimates that open data supports between 123 000 and 165 000 full-time-equivalent jobs across the EU-27 (Indicator Econ1). The direct GVA attributable to open data reuse is estimated at approximately EUR 58.6 billion, representing roughly 10 % of the broader European data economy (Indicator Econ2).
- Social and environmental impact. The pilot demonstrated that environmental reporting obligations (Indicator Env4) and transparency and data provision (Indicator Soc2) are effective proxies for impact. However, results varied significantly based on data timeliness.
- Identification of bottlenecks. The pilot revealed that a lack of a granular understanding of reuse (Indicator 4.1) is the primary constraint for the entire framework. Current reuse case repositories are non-representative and often out of date. Furthermore, the measurement of digital sovereignty (Indicator Strat2) remains restricted by privacy considerations regarding IP address data.
To support a successful roll-out, the report provides a Member State Toolkit for Measuring Open Data Impact containing detailed measurement guidance (structured like a menu of ‘recipes’). Part of that guidance, for example, will include central research to establish and communicate the harmonised coefficients for employment (Indicator Econ1) and GVA (Indicator Econ2). These can be used in GVA and employment-level calculations by Member States on a voluntary basis. This may require periodic, pan-European micro-surveys of data reusers to ensure consistency across the EU. Member States are encouraged to prioritise the development of systematic reuse case repositories and adopt persistent identifiers such as digital object identifiers for high-value datasets. This is a technical prerequisite for automated citation tracking (Indicator 4.2). National coordinators should foster closer alignment with national statistical offices to embed open data dependency questions into existing annual business surveys, facilitating the transition to more comprehensive measurement protocols.
The Commission will explore the potential to merge this measurement framework with the existing open data maturity assessment. The objective of doing so would be to provide a single performance benchmark while minimising the reporting burden on national administrations. By adopting this harmonised approach, the EU can move beyond supply-side compliance and steer data policy toward the specific assets and quality dimensions that deliver the highest strategic value.
1. Introduction
1.1. Context
Open data offers significant value to society, enabling real-life use cases to improve transparency, increase innovation and support sustainability. This has been driven by strong policies (most notably the Open Data Directive [2] and the High-Value Dataset (HVD) Implementing Regulation [3]) that have increased the availability of open data across Europe (European Commission et al., 2025). While these initiatives have increased open data outputs and improved certain aspects of society, the extent of the impact of these use cases is still not always entirely clear.
Other studies have attempted to measure the impact of open data, but their findings vary considerably and the methodologies applied differ substantially. While some rely on quantitative methods, others use case studies or mixed methods, leading to incomparable findings (see, for example, European Commission, 2000; Dekkers et al., 2006; Vickery, 2011; McKinsey Global Institute, 2013; Lateral Economics et al., 2014; DemosEuropa et al., 2014; Carrara et al., 2015; Huyer et al., 2020; Deloitte, 2021; Verhulst et al., 2017). Another debate within the literature concerns the definition of impact, with some studies focusing exclusively on economic effects, whereas others look at the outputs of open data. Research addressing the social and environmental dimensions of open data impact remains particularly limited. In this context, the European Data Market Study 2024–2026 provides comprehensive definitions and insights into the impacts of data in general but does not isolate the specific effects of open data (IDC et al., 2025; Cattaneo et al., 2020). This suggests that EU open data research could use the broader data market framework and explore ways of distinguishing the impact of open data more clearly.
To address the gap of a consistent EU-wide methodology that can fully capture the impact of open data, a workstream of four research studies has been established within the European Data Portal (data.europa.eu). The first report in this workstream, Rethinking the Impact of Open Data, focused on a literature review about the impact of public data resources (European Commission et al., 2023). It found that the lack of a robust, conceptual definition of impact made it more difficult to demonstrate the value of open data in previous research. Many scholars studying open data impact refer to the annual Open Data Maturity Report (‘ODM report’) and Open Data Barometer as dominant reference points (European Commission et al., 2024a; World Wide Web Foundation, 2017), alongside similar benchmarking initiatives such as the Organisation for Economic Co-operation and Development’s (OECD) OURdata Index (OECD, 2020). However, these frameworks do not fully reflect the Commission’s own views of measuring impact, which encompasses economic, social and environmental impact, as described in the better regulation guidelines. Another key finding from this study is that existing indicators used by open data portals and intermediaries often rely on proxies, such as user statistics and use case repositories that, while necessary, are insufficient to assess open data impact.
The second study, Indicators for an Open Data Impact Assessment, builds on this foundation by introducing key conceptual elements for a measurement framework and identifying potential indicators (European Commission et al., 2024b). It first introduces the open data value chain as a model for understanding the processes applied to data to convert it from a raw form to a valuable use. To assess the effects of open data along this chain, the study introduces a clear distinction between outputs (direct results of data availability), outcomes (short- to medium-term effects) and impacts (long-term or broad effects). Furthermore, it identifies a range of potential indicators for each of these categories, linked to the economic, social and environmental dimensions of impact and outcomes. These indicators are intended to be selected and applied in a comprehensive framework that (with further work) can fully capture the impact of open data.
1.2. Objective of the research
Despite growing interest in the reuse of open data, there is currently no unified methodology to assess the impact of open data across the EU or beyond. Existing studies have different definitions, indicators and datasets, resulting in context-specific/fragmented approaches and limited comparability (in particular across countries).
In response, this report represents the third study in the series commissioned to establish a robust EU-wide framework for assessing open data impact. It proposes a comprehensive methodology to assess the impact of open data across four dimensions: economic, social, environmental and strategic. It includes a pilot to test a selection of these indicators with EU Member States; provides a step-by-step plan to support Member States in conducting their own assessments in the future; and gathers feedback on the proposed approach through targeted consultations with Member States.
Building on the foundational concepts of the first report, Rethinking the Impact of Open Data (European Commission et al., 2023), this study also draws from the second report, Indicators for an Open Data Impact Assessment (European Commission et al., 2024b), by using the open data value chain to understand how impact is generated, applying the output–outcome–impact distinction to categorise different types of effects and incorporating the identified indicators into the methodology. A possible extension to this study could be the development of an interactive monitoring tool to support consistent EU-wide impact assessments. Figure 1 outlines the full sequence.
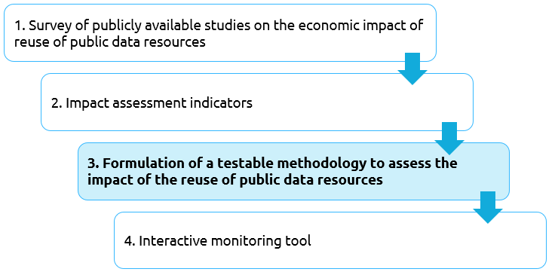
Figure 1. Measuring the impact of open data
1.3. Outline
The report is structured as follows.
- Chapter 2 introduces a complete framework to measure open data impact. It starts with the conceptual foundation, including the open data value chain and the distinction between output, outcome and impact. Through the application of these core concepts, the chapter delineates a comprehensive set of output and impact indicators that together capture the real-world effects of open data across four dimensions.
- Chapter 3 presents the first practical iteration for measuring open data impact. It explains how the most feasible and valuable indicators are prioritised from the complete framework, ensuring a balanced set across all stages of the value chain and impact dimensions. This is supported by a Member State Toolkit to aid in applying the framework in the national contexts of Member States.
- Chapter 4 details the engagement strategy designed to validate and refine the framework. It explains how surveys and in-depth interviews with Member States were conducted to gather feedback on the framework’s feasibility, relevance and data availability.
- Chapter 5 provides the results of the pilot of the framework. The indicators selected in Chapter 3 were calculated in a selected sample of Member States to test the applicability of the framework and generate the initial results of open data impact.
- Chapter 6 draws the conclusions from the report, reflecting the strengths and limitations of the framework and results from the engagement strategy.
- Chapter 7 closes this report with recommendations for policymakers and future research. This includes the next steps for developing the fourth and final study of this series and suggestions on how Member States and the Commission can further improve the implementation of the framework.
2. A complete framework for open data impact
This chapter introduces the framework developed in this study for measuring the impact of open data. It begins by introducing the open data value chain (Section 2.1), which describes the processes through which raw data is transformed into valuable reuse. Next, it explains the conceptual distinction (Section 2.2) between outputs, outcomes and impacts, which underpins the structure of the framework. The chapter then outlines the overall structure of the framework (Section 2.3), including a comprehensive set of indicators used to measure open data impact across economic, social, environmental and strategic dimensions.
2.1. The open data value chain
The open data value chain serves as a foundational concept behind the framework, as it provides a structured way to understand how open data generates value throughout its life cycle. It was introduced in the second study of this series, Indicators for an Open Data Impact Assessment, to address the lack of conceptual clarity in previous measurement approaches (European Commission et al., 2024b). In this third study, the value chain serves as the backbone of the measurement framework, identifying indicators across each stage of the open data value chain. This ensures that both technical maturity and societal impact are captured in a structured manner within the framework.
A value chain disaggregates a process into its strategically relevant activities, showing how a low-value input is transformed into a higher-value output through a sequence of connected steps (Porter, 1985). This concept can also be applied to open data. In this context, the value chain refers to the processes through which raw data is collected, prepared and transformed into a form that enables meaningful use. Several scholars outline big data value chains (Faroukhi et al., 2020; Curry, 2016). They say that data generally follows a life cycle in which it is first produced and made available, discovered by others, processed and analysed prior to creating value. However, data can generate different types of value throughout its life cycle, depending on how it is processed and interpreted and by whom it is reused.
Based on Open Data Watch’s (2018) data value chain, Figure 2 illustrates the open data value chain used in this framework to measure open data impact. This model has four different stages. The process begins with collection, where existing data is identified and prepared for opening. Next is publication, making data publicly available, discoverable and disseminated. The uptake stage focuses on enhancing usability and creating incentives for reuse. Finally, in application, data is consumed directly or combined into new products and services, leading to broader adoption. Each stage progressively increases the value of the data, supported by feedback loops that allow enriched data to be republished.
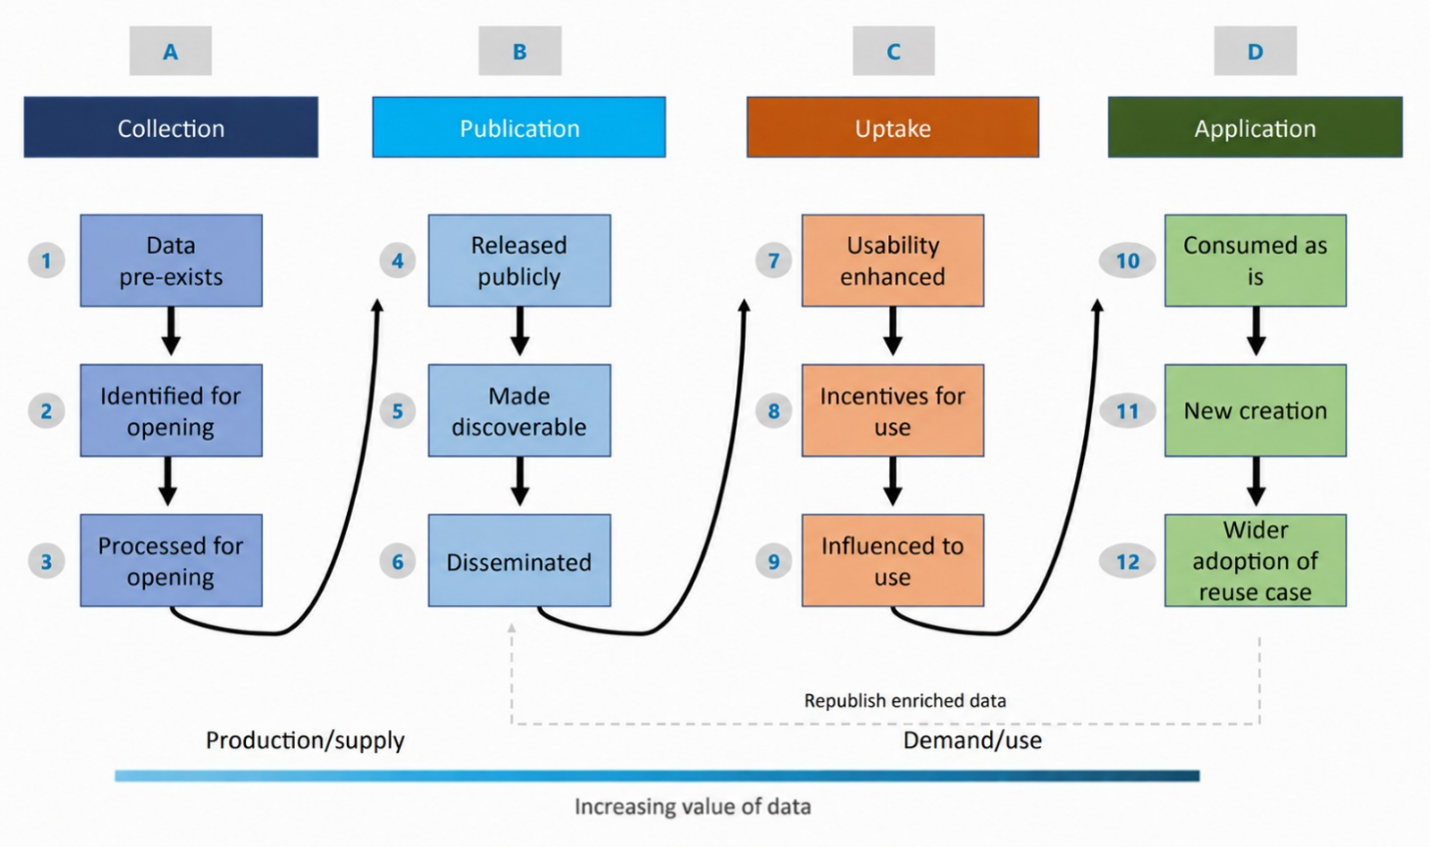
Figure 2. Open data value chain
Open data collection
The value chain begins with datasets that public organisations hold, commission, create or collect for their operational purposes. These datasets may either already exist within the organisation or be newly created or collected as part of administrative processes.
For newly created or collected datasets, openness can be considered at the point of collection or creation, for example by applying reusable formats and standards. Where datasets already (1) pre-exist, the first step is to (2) identify which datasets should be opened. Once selected, they require (3) pre-processing to prepare them for publication, such as aggregation, removal of sensitive information and, where necessary, conversion or adaptation into reusable formats. Through this preparation, the operational dataset becomes an open data product suitable for release.
Open data publication
Publication involves making the prepared datasets accessible to reusers. Initially, data must be (4) released publicly in appropriate formats, under an appropriate open license and with the necessary documentation. To ensure that potential reusers can find it, the dataset must then be (5) made discoverable, supported by adequate metadata. Finally, the data is (6) disseminated through suitable channels – such as portals, search engines or targeted communications – to raise awareness and enable access.
Open data uptake
Uptake occurs when reusers begin engaging with the published datasets. This can be facilitated by making the data more (7) usable, for example though preview features or enriched versions of datasets. Uptake can also be encouraged through (8) incentives, such as reducing barriers to reuse and by (9) influencing potential users to recognise the relevance and value of open data. This is generally done through training, guidance or showcasing reuse cases. As uptake increases, feedback loops emerge in which reusers’ expectations regarding data quality encourage publishers to improve both data and metadata.
Open data application
In the final stage, data is put to use in a concrete context. It may be (10) consumed as is, for example to inform a decision directly, or it may undergo further processing, leading to the (11) creation of new insights, tools or services. These outputs can then be (12) adopted more widely by additional users or republished as enriched data, feeding back into earlier stages of the chain. Through these reuse cases, the potential societal impact of open data begins to materialise.
2.2. The concepts of output, outcome and impact
The OECD (2022; Intrac, 2024) outlines a results-chain framework that is widely adopted in assessment frameworks that monitor policy interventions. Within this framework, an intervention is understood as an activity or activities leading to change, such as improving decision-making by making government-held data more widely available. These activities are made possible by inputs, which can be financial, human, material or political. The subsequent interventions produce the following changes, categorised as follows.
- Outputs are the direct results of open data availability (e.g. a dashboard that integrates data on the built environment at the municipal level into one overview).
- Outcomes are the short- and medium-term effects (e.g. improved information for monitoring and maintenance).
- Impact is a long-term or broad effect (e.g. higher return on public money and increased inhabitant satisfaction).
This results-chain logic provides the foundation for structuring the framework on measuring open data impact. By distinguishing between outputs, outcomes and impacts, the framework can trace how open data interventions lead to societal changes over time. Output reflects immediate data-related products, while outcomes capture behavioural or operational shifts and impacts represent broader societal or economic effects. This structure ensures that indicators are positioned within a coherent logic model that strengthens the ability to isolate and capture the specific effects of open data over time. Figure 3 illustrates the results-chain logic used in the framework.
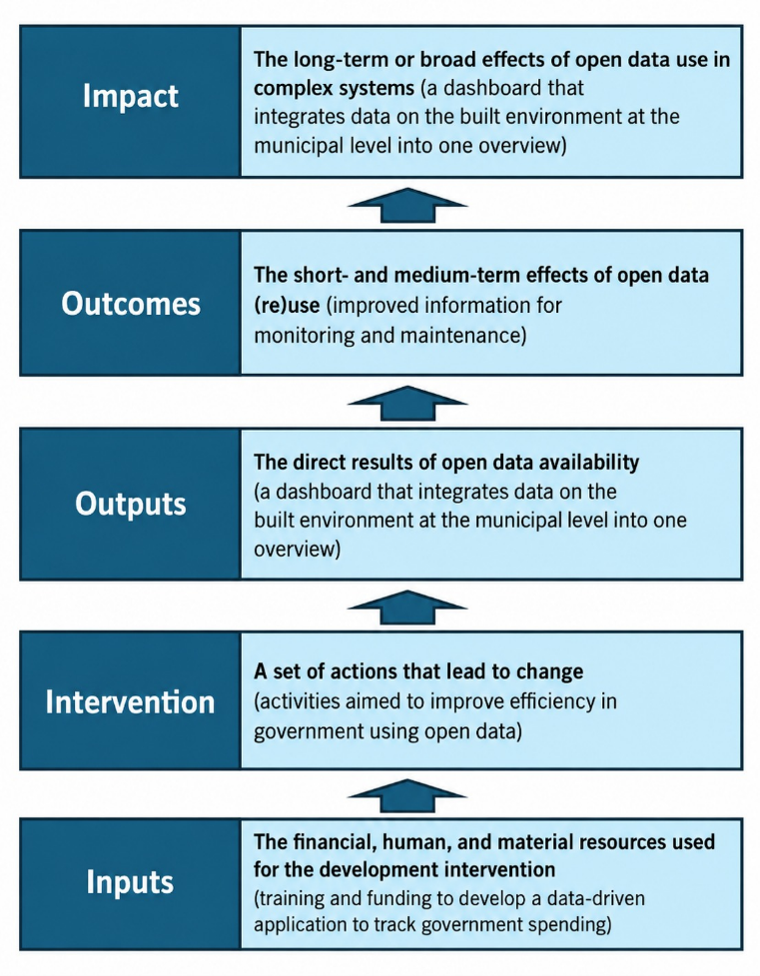
Figure 3. Results-chain logic
2.3. Structure of the framework
The framework presented in this study is structured into two parts. Section 2.3.1 sets out the foundational output indicators and the thematic impact indicators, which together describe how the open data ecosystem operates and how its effects are assessed across four key impact dimensions. Section 2.3.2 then introduces the intervention logics, explaining how these components are connected to generate measurable outcomes.
2.3.1. Foundational and application indicators
The overall framework is organised into two interconnected parts that together capture both the functioning of the open data ecosystem and the broader impacts that arise from it. The first part consists of the foundational ‘building blocks’, and the second part consists of the ‘thematic impacts’ that assess the effects of open data within key dimensions. Structuring the framework in this way creates a clear link between the technical performance of the open data ecosystem and the domain-specific outcomes and impacts. Figure 4 illustrates the full framework with all its indicators.
Figure 4. Framework on measuring open data impact
2.3.1.1. Foundational output indicators
The first part of the framework consists of a comprehensive set of output indicators, which form the analytical foundation for all subsequent impact measurements. These indicators do not yet measure economic, social or environmental outcomes, but rather assess the essential preconditions that must be in place for those impacts to occur. They provide direct, operational metrics on the health, maturity and activity of the open data ecosystem, covering all four stages of the open data value chain (collection, publication, uptake, application).
These indicators assess the strategic governance of data assets, the volume and quality of published data and the extent to which data is being discovered and consumed by potential reusers. They function as leading indicators for the entire system. For example, weaknesses at this stage – such as low metadata quality or insufficient application programming interface (API) usage – directly limit the ecosystem’s capacity to generate downstream value. As such, they constitute the primary diagnostic tools for national portal operators and policy coordinators, providing actionable, real-time intelligence to manage and improve the national open data infrastructure.
Where relevant, the foundational output indicators are intended to build on and complement information already collected through the ODM report. Mapping these indicators to existing ODM questions can help identify overlaps and gaps, support coherence between measurement instruments and reduce the unnecessary duplication of data collection. At the same time, the framework does not seek to replace or remove existing ODM questions that continue to capture relevant outputs or impacts. Instead, it provides a structured way to translate selected maturityrelated inputs into the foundational output indicators.
Table 1 presents the complete set of foundational output indicators and groups them by the relevant value chain stage to which they correspond. For each indicator, the table provides a short description explaining its intent and rationale.
Table 1. Foundational output indicators
| Indicators | Description of indicator |
|---|---|
| Collection | |
| Strategic data governance and prioritisation | This indicator measures the extent to which a clear, publicly documented national strategy exists for governing, managing and prioritising the release of open data. A formal strategy is a foundational enabling factor, as research shows that effective ‘resource governance’ is essential for generating economic and social value. By defining institutional roles, legal mandates and a stable policy environment, such a strategy signals long-term political commitment and reduces uncertainty for potential reusers. This metric therefore serves as a primary qualitative measure of a Member State’s strategic maturity, which macro-level studies identify as an important determinant of downstream innovation and economic activity. |
| Comprehensiveness of data asset inventories | This indicator measures the extent to which public sector bodies maintain and publish structured, machine-readable inventories of their data holdings. Such inventories are a core element of effective resource governance, since an administration cannot prioritise or manage data it does not know it possesses. For reusers, they provide important signals that reduce uncertainty and lower search costs, addressing one of the main barriers to reuse identified by Welle Donker et al. (2017) By making the existence of data assets visible, even when the data itself is not yet open, inventories enable potential reusers to see what is available and to request access to the datasets that are most valuable to them. |
| Publication | |
| Publication volume and growth | This indicator measures the total number of datasets published on the national open data portal and the annual growth of the catalogue. It is a foundational supply-side metric that signals the level of governmental activity and long-term commitment to open data. A consistently expanding catalogue reflects a healthy ecosystem in which new resources are regularly added, supporting innovation and the creation of economic value. Although the number of datasets is not an impact measure on its own, it is a necessary precondition since limited supply restricts the potential for reuse. A dynamic catalogue also provides a positive signal to reusers by reducing uncertainty about the stability and future availability of data, encouraging investment in data-driven services. |
| High-value dataset publication rate | This indicator measures the percentage of datasets mandated by the HVD Implementing Regulation that a Member State has published as open data in compliance with the HVD requirements. It is a primary metric of legal compliance and alignment with a central element of the European data strategy. Unlike general catalogue size, it focuses on a curated set of datasets identified by the European Commission as having the greatest potential for socioeconomic benefit. Publishing HVDs sends a clear signal to the market that the government is prioritising high-impact assets, reducing uncertainty for reusers and encouraging investment in new data-driven services. |
| Metadata quality | This indicator measures the descriptive quality, completeness and standards compliance of metadata across the national open data catalogue. High-quality metadata is a core element of a functional open data ecosystem, since it serves as the primary signal through which reusers assess the suitability and reliability of a dataset, as highlighted in Washington’s (2014) work on data signals. Good metadata reduces information gaps between data publishers and reusers and lowers the search and evaluation costs faced by reusers, while poor or non-standard metadata creates uncertainty and hinders discovery. The purpose of this indicator is therefore to assess how effectively the portal provides clear and consistent signals that support the findability, accessibility, interoperability and reusability of its data assets, in line with the FAIR (findable, accessible, interoperable, reusable) principles. |
| Technical accessibility and reusability | This indicator measures the extent to which datasets are provided in formats and through channels that support efficient, automated reuse. It assesses the technical fitness of the data supply, with a focus on machine readability and the availability of APIs. This reflects the technical connectivity enabling factor identified by Jetzek et al. (2013) as essential for generating economic value. Data made available only in non-machine readable formats or as one off downloads has limited potential for scalable reuse. By contrast, open, structured formats and well-documented APIs act as clear data signals, showing reusers that the data is intended for practical integration and reducing the cost and risk of building services on top of it. |
| Uptake | |
| Portal traffic and data consumption | This indicator measures user interaction with the national portal, distinguishing between passive viewing and active consumption through downloads. It is the most direct quantitative measure of demand-side activity, since downloads signal a user’s decision to invest time and resources in a dataset and therefore provide a stronger proxy for reuse than simple page views. Monitoring this activity offers valuable feedback to publishers on which datasets are most relevant to user communities and helps justify continued investment in the open data programme. |
| API consumption rate | This indicator measures the volume of data accessed programmatically through APIs. It provides a direct measure of machine-to-machine reuse, which represents a deeper level of integration than manual downloads. High API consumption indicates that open data is being incorporated into digital services, applications or analytical workflows, supporting automated and real-time use cases. This aligns with the technical connectivity factor identified by Jetzek et al. (2013) as a driver of efficiency and innovation. A strong API consumption rate signals a mature data ecosystem in which reusers have the confidence and capability to build services that depend on government data assets. |
| User search success rate | This indicator measures how effectively the portal’s search function helps users find relevant datasets, calculated as the share of search queries that lead to user engagement with a result. Since a key role of an open data portal is to support discovery, this metric provides a direct measure of how well it performs that function. As noted by Welle Donker et al. (2017), finding suitable data involves real search costs for reusers, and a high success rate indicates that these costs are being minimised. In line with Washington’s (2014) work on information asymmetry, the search results page provides the first set of signals a user receives. Successful searches show that metadata, titles and indexing are working effectively to reduce uncertainty, while unsuccessful searches indicate friction that may discourage further exploration. |
| Application | |
| Volume and thematic distribution of reuse cases | This indicator measures the number and thematic spread of documented applications, services, visualisations and research built on open data. It is a core quantitative measure of innovation outcomes, showing that data is not only accessed but actively transformed into new products and knowledge. This operationalises the innovation value-generating mechanism identified by Jetzek et al. (2013), which links open data to the creation of new services and businesses. A growing and varied set of reuse cases signals a healthy ecosystem in which reusers are overcoming technical and investment barriers. A publicly maintained catalogue of these cases also acts as an important set of signals, as described by Washington (2014), demonstrating the viability and value of open data and encouraging further reuse. |
| Explicit dataset references and citations | This indicator measures the number of formal citations of open datasets in scientific literature, policy reports and open-source software. Citations provide a strong, verifiable signal that a dataset has been actively used to generate new knowledge or technical outputs, representing a higher level of value than simple downloads. Tracking citations helps assess how open data is integrated into the wider research and innovation ecosystem and offers a credible, externally validated proxy for impact. As shown in the work of Alderete (2020), linking open data reuse to innovation outcomes is essential for understanding its economic contribution and citations provide direct micro-level evidence for this relationship. |
2.3.1.2 Thematic impact indicators
The second part of the framework builds on the foundational outputs to measure the real-world effects of open data within specific dimensions. Consistent with the Commission’s (2021) better regulation guidelines, this framework distinguishes between economic, social, environmental and strategic impacts. Each dimension is measured through a dedicated set of indicators designed to translate open data activity into evidence of societal benefit.
Together, these four dimensions provide a comprehensive view of how the reuse of open data generates value across society. To operationalise these dimensions, Table 2 presents the full set of thematic impact indicators. For each indicator, the table provides a short description explaining its intent and rationale.
A. Economic dimension
The economic impact indicators estimate the contribution of open data to key national economic objectives, including employment, gross value added (GVA), productivity, innovation and cost savings. These indicators address the central question of how open data translates into economic growth and competitiveness. Acknowledging the significant challenge of direct attribution, the framework employs a robust, model-based estimation methodology.
B. Social dimension
The social impact indicators examine the contribution of open data to societal well-being, democratic health and the quality of public services. Instead of attempting to quantify abstract social concepts directly, the framework focuses on practical, evidence-based proxies for social value. Together, these indicators demonstrate that open data functions not only as an economic asset but as a critical component of effective and democratic governance.
C. Environmental dimension
The environmental indicators measure the contribution of open data to the goals of the European Green Deal and national environmental protection policies. They demonstrate the role of open data in enabling more effective monitoring, informed decision-making and data-driven tools that can support climate action, sustainable resource management and the protection of biodiversity.
D. Strategic dimension
The strategic impact indicators provide a high-level, geopolitical perspective on a Member State’s open data ecosystem. This includes the contribution of open data to the EU’s overarching strategic objectives of international competitiveness, digital sovereignty and leadership in key technologies like artificial intelligence. They provide a crucial link between the detailed, ground-level performance of the open data program and the high-level strategic priorities of the EU.
Table 2. Thematic impact indicators
| Indicators | Description of indicator |
|---|---|
| Economic dimension | |
| Employment | This indicator estimates the number of full-time-equivalent (FTE) jobs in a Member State that are directly supported by the reuse of open data. Job creation is a central and tangible measure of economic impact and a key objective of policies that promote a data driven economy. While the European Data Market Study 2024–2026 captures the broader data professionals workforce, this indicator isolates the specific contribution of open data within that labour market. Academic work, including the econometric model by Alderete (2020), shows a positive link between open data, innovation and business creation. This indicator operationalises that evidence by measuring one of its most direct outcomes: the employment of skilled individuals whose work depends on public data assets. |
| Gross value added (GVA) | This indicator estimates the share of national GVA within the data economy that can be attributed to the use of public open data. GVA is the key measure of economic production, and this indicator provides the most direct way to quantify open data’s contribution to economic growth. It is designed to identify the open data component of the broader data economy value measured by the European Data Market Study 2024–2026, ensuring methodological alignment with existing EU monitoring. Academic research shows that open data supports innovation and new business models and this indicator captures the monetised value of that contribution. |
| Productivity | This indicator estimates the contribution of open data to productivity growth in the national economy. Productivity, defined as output generated per unit of input, is a fundamental driver of long-term economic growth and higher living standards. Open data is expected to improve productivity through the efficiency mechanism described by Jetzek et al. (2013), by reducing information search costs, enabling automation and improving resource allocation. Unlike GVA, which measures the size of the open data economy, this indicator focuses on its effect on the efficiency of the wider economy, highlighting open data as a strategic lever for national competitiveness. |
| Innovation | This indicator estimates the contribution of open data to national innovation activity, with a focus on high potential entrepreneurship and new product development. Innovation is a key driver of economic competitiveness and long term growth. This metric operationalises the Innovation mechanism described by Jetzek et al. (2013), which links open data to the creation of new knowledge, processes and businesses. While GVA reflects current economic output, this indicator serves as a leading measure of future growth by tracking the emergence of new open data driven ventures. |
| Cost savings | This indicator estimates the direct cost savings achieved by public and private organisations through the use of open data. These savings are a monetisable expression of the efficiency mechanism described by Jetzek et al. (2013) and represent one of the most tangible economic benefits of open data. For businesses, they typically arise when commercial data purchases are replaced with freely available open data. For public administrations, they result from reduced administrative burdens, for example fewer resources needed to process information requests. Measuring these savings is important because they form a direct and measurable component of the productivity gains captured in the productivity indicator and show where those gains originate. |
| Social dimension | |
| Quality of public discourse | This indicator measures the documented use of national open data by journalists, civil society organisations and academic researchers. These actors translate raw data into accessible narratives, analysis and tools for public understanding. Their outputs provide an evidence-based proxy for open data’s contribution to a more informed society and operationalise the transparency and participation mechanisms identified by Jetzek et al. (2013). News articles, non-governmental organisation (NGO) reports and academic publications offer tangible signals of successful reuse and its integration into public debate. |
| Transparency and accountability | This indicator measures how national open data is used by journalists, civil society organisations and researchers specifically in contexts that strengthen public oversight. Their work transforms data into investigations, monitoring tools and analyses that support scrutiny of public institutions. It therefore provides direct evidence of open data’s role in enhancing transparency and accountability, reflecting the social and political value-generating mechanisms described by Jetzek et al. (2013). |
| Quality of decision-making | This indicator assesses the link between a Member State’s open data maturity and the perceived effectiveness of its governance by using the World Bank’s government effectiveness indicator as an external proxy. The underlying hypothesis is that a more mature open data ecosystem improves analytical capacity, transparency and credibility within public administration, which should be reflected in higher governance scores. This approach enables a robust test of the relationship between open data and better decision-making using internationally comparable data. |
| Access to public services | This indicator measures citizen uptake of digital public services that rely on open data. Its purpose is to quantify how widely these data driven tools are used to make interactions with government easier and more efficient, reflecting a key social impact of open data. While earlier indicators capture the existence of such services, this one focuses on their user base, providing a concrete measure of their relevance and contribution to a more modern and user-centric public administration. |
| Public safety and emergency response | This indicator measures the contribution of open data to improving the speed and effectiveness of emergency response services. It captures some of the most significant social impacts of open data, such as faster medical assistance or better crisis management and reflects the efficiency mechanism described by Jetzek et al. (2013). Real-world examples, such as the use of open defibrillator location data in Belgium’s EVapp system, illustrate its potential. The indicator aims to quantify these outcomes systematically and demonstrate open data’s role in strengthening societal resilience. |
| Environmental dimension | |
| Climate action and emissions reduction | This indicator estimates the contribution of open data to national and EU climate objectives by measuring the adoption of data-driven tools that support pro-environmental behaviour. Open data enables businesses and citizens to make more sustainable choices, for example in transport or energy use. Tracking the uptake of these tools provides a practical proxy for their collective impact on reducing greenhouse gas emissions and offers tangible evidence of how the open data ecosystem supports one of the EU’s key policy priorities. |
| Sustainable resource management | This indicator estimates the role of open data in improving the sustainable use of resources such as energy, water and materials. It measures how data-driven tools enable efficiency gains and behavioural changes that reduce consumption and waste, supporting wider European Green Deal objectives including the circular economy action plan. Granular, real-time data on resource use allows both utility providers and consumers to optimise their behaviour, and the adoption of such tools serves as a direct proxy for open data’s contribution to more sustainable resource management. |
| Biodiversity and ecosystem health | This indicator measures how open data is used to monitor and protect biodiversity and ecosystem health. It provides evidence of open data’s contribution to national and EU conservation goals, including the EU biodiversity strategy. Geospatial and earth observation data, such as from Copernicus, enable conservation organisations, researchers and authorities to track land use change, monitor protected areas and identify threats. The use of these datasets by key actors acts as a direct proxy for improved environmental stewardship. |
| Timeliness and quality of core environmental reporting | This indicator assesses national environmental governance by measuring the timeliness, granularity and accessibility of legally mandated environmental datasets. The quality of these data outputs provides a direct proxy for the capability of the underlying governance system. Authorities that publish detailed, machine-readable data in a timely manner demonstrate strong operational capacity. This aligns with the Aarhus Convention, which emphasises access to timely, high-quality environmental information as a prerequisite for participation and accountability. The indicator therefore offers a comparable measure of transparent, data-driven environmental management. |
| Strategic dimension | |
| International competitiveness | This indicator benchmarks the EU’s collective open data ecosystem against global peers using established third-party indices. Its purpose is to provide an external and objective assessment of the EU’s progress toward leadership in the data-driven economy. Strong performance in international rankings signals a mature and innovative data environment, which can attract investment, support cross-border research and reinforce the EU’s role as a global standard setter in digital policy. The indicator aggregates Member State results to give a composite view of the EU’s competitive strength. |
| Digital sovereignty and strategic risk | This indicator assesses where demand for EU data originates and monitors any anomalous activity outside the EU. It examines the share of consumption from within the EU as a proxy for the strength of the internal digital market and identifies concentrated data harvesting by non-EU actors that may signal strategic risks. The purpose is to give policymakers a clear, data-driven understanding of who is using their national data assets and to support informed decisions that balance internal market development with the management of external dependencies. |
| Leadership in AI | This indicator measures the extent to which a Member State’s open data assets are used to develop and train European AI models. Its aim is to assess the contribution of national open data programmes to the AI ecosystem, a key driver of future economic growth and technological sovereignty under the EU’s AI Act and data strategy. High-quality and machine-readable datasets, including, as a notable example, HVDs, are essential resources for AI training. The indicator provides evidence of whether this potential is being realised and of the emergence of a home-grown AI innovation ecosystem built on public data assets. |
2.3.2. Intervention logics
At the heart of the framework lies a set of intervention logics (or ‘logic chains’) that clarify how activities translate into outputs, outcomes and impacts. These logics are the stories of how an open data activity related to a policy ambition leads to an impact. They link the four stages of the open data value chain with the output–outcome–impact sequence, ensuring that each indicator is grounded in a coherent and evidence-based causal pathway. This provides an analytical understanding of how open data generates value.
Rather than assuming that the mere availability of open data automatically leads to societal benefits, an intervention logic requires the formulation of a clear, testable hypothesis about the mechanisms through which value is created. It also guides what should be measured at each step of the process from raw data to long-term impact. Moreover, this structure offers a coherent narrative that makes the value of open data easier to communicate to policymakers and the public. Together, these functions make the framework both analytically rigorous and practically usable, anchoring the measurement of impact in a structured and transparent logic. Within the framework there are two relevant types of intervention logics: ‘foundational logics’ and ‘application logics’.
2.3.2.1 Foundational logics
The foundational logics form the first layer of the framework and are directly tied to foundational output indicators (or ‘building blocks’). These logics are essential for understanding whether the open data ecosystem is functioning effectively and whether open data is being used in practice. They serve as the building blocks for assessing outcomes and impacts and they help identify where in the value chain bottlenecks or strengths may exist.
Each stage of this open data value chain is associated with a specific logic that links an open data activity to a measurable output. These outputs reflect the operational maturity of the ecosystem and provide the necessary foundation for assessing real-world effects. Table 3 shows an example for this logic in each of the stages of the open data value chain.
Table 3. Foundational logics
| Stage | Logic |
|---|---|
| Collection | Activity: Public administrations identify and prepare datasets for release Output: Strategic governance and comprehensive data inventories |
| Publication | Activity: Datasets are published in accessible, interoperable formats Output: High publication volumes, compliance with the HVD Implementing Regulation and metadata quality |
| Uptake | Activity: Portals and intermediaries promote discoverability and usability Output: Increased portal traffic, API usage, successful search rates |
| Application | Activity: Reusers (e.g. businesses, researchers, NGOs) apply data in services and analysis Output: Documented reuse cases (including products) and formal dataset citations |
2.3.2.2 Application logics
The second part of the framework builds on the foundational outputs to assess the real-world impact across the four thematic dimensions (economic, social, environmental, strategic). Each indicator within these domains is structured using the following clear intervention logic.
Activity → Output → Outcome → Impact
This logic helps define how a specific open data activity leads to measurable outputs (e.g. API usage), intermediate outcomes (e.g. improved efficiency) and, ultimately, long-term impact (e.g. economic growth or environmental progress). This same structure applies to each of the indicators across all thematic domains.
For example, in the economic dimension, the indicator ‘Gross value added attributable to open data’ is based on the following logic.
- Activity. Businesses reuse open data in products and services.
- Output. Increased API usage and reuse cases.
- Outcome. Open data becomes a core input in business operations.
- Impact. A measurable contribution to national GVA.
3. The first practical iteration of the framework
This chapter presents the first practical iteration of the complete framework presented in Chapter 2. It begins by explaining the rationale and process for prioritising a subset of indicators (Section 3.1), selecting those that are both feasible to measure and most valuable for generating initial results. The chapter then outlines how these prioritised indicators are operationalised in practice (Section 3.2). Finally, it introduces the Member State Toolkit (Section 3.3), which provides Member States with instructions for assessing the complete set of indicators.
3.1. A pragmatic path to measuring open data impact
The comprehensive framework presented in Chapter 2 sets out a long-term vision for measuring open data impact, covering all stages of the open data value chain, along with economic, social, environmental and strategic impact dimensions. While this framework provides a robust conceptual foundation, not all indicators can be used (calculated) directly in a consistent and reliable way across all Member States. Due to insufficient data availability and differences in the maturity of the open data ecosystems across Member States, a phased approach will be both necessary and indeed valuable.
The first iteration of the framework prioritises a subset of indicators from the comprehensive framework that can be measured in the short to medium term. The selection process (for priority indicators) follows three guiding principles. First, indicators are assessed for feasibility, ensuring that data can be collected consistently across Member States. Second, among the feasible options, those with the greatest relevance for demonstrating open data impact are prioritised. Third, the final set is chosen to maintain balance, representing all key dimensions of the comprehensive framework.
As a result, five foundational output indicators have been selected for short- to medium-term focus: publication volume and growth; HVD publication rate; metadata quality; volume and thematic distribution of reuse cases; and explicit dataset reference and citations. To complete these, five thematic impact indicators were chosen to reflect the key dimensions of impact: employment; GVA; transparency and accountability; timeliness and quality of core environmental reporting; and digital sovereignty and strategic risk.
This set of indicators also provides the foundation for the pilot that has been carried out in four selected Member States: Estonia, Italy, the Netherlands and Poland. Within this pilot, the prioritised indicators were calculated for each of the selected Member States. Prioritised indicators were arrived at based on alignment with the ODM assessment, currently available information and preferences from Member State stakeholders. The activity demonstrates how the framework can be applied in practice now, along with highlighting necessary methodological refinements and offering initial insights into open data impact. The results of the pilot are presented in Chapter 5 of this study.
3.2. Operationalisation of indicators
The operationalisation of prioritised indicators includes practical measurement instructions. The instructions focus on the concrete inputs, data sources and calculation steps required to produce comparable quantitative results across Member States. These details are fully aligned with the methodologies defined in the Member State Toolkit and form the basis for the pilot measurements presented in Chapter 5. Section 3.2.1 will focus on the descriptions of measurement for the prioritised output indicators, while Section 3.2.2 will focus on the descriptions of measurement of the prioritised impact indicators.
3.2.1. Foundational output indicators
Table 4 presents the operationalisation of the five selected output indicators. For each indicator, a standardised measurement approach is provided that can be applied consistently across Member States.
Table 4. Operationalisation of prioritised output indicators
| Indicators | Description of measurement |
|---|---|
| Publication volume and growth | The practical method for calculating this indicator relies on data that is readily available from the national portal itself. The first component, publication volume, is the absolute count of datasets available on the portal, measured at a consistent point in time each year, such as the end of the fourth quarter. The unit of measure is datasets. The second component, publication growth, is calculated as the year-over-year percentage change in the total dataset count, using the formula: ((count in year two minus count in year one) divided by count in year one) multiplied by one hundred. The data source is the national open data portal’s public dashboard or its API. The measurement should be conducted annually by the responsible authority to ensure consistent longitudinal analysis. |
| HVD publication rate | This protocol provides a verifiable assessment based on a manual audit against the official legal text. The indicator is calculated as the number of mandated HVDs published by the Member State, expressed as a percentage of the total number of HVDs applicable to that state. The formula is: ((number of mandated HVDs published) divided by (total number of mandated HVDs applicable)) multiplied by one hundred. The primary data source for the denominator is the Annex to the HVD Implementing Regulation. The numerator is determined via an annual audit conducted by the responsible authority. This audit involves manually verifying the publication of each applicable dataset by searching the national portal and relevant public administration websites. A dataset is considered ‘published’ if it is discoverable and publicly accessible. Member States are required to report on all published HVDs to the Commission on a biennial basis. |
| Metadata quality | This protocol leverages the existing, automated assessment process operated by the European Data Portal (data.europa.eu). The indicator is the average metadata quality assessment (MQA) score for the national portal’s catalogue, as measured and published on the European Data Portal’s MQA dashboard. The formula is a composite score calculated by the MQA methodology, expressed as a percentage. The primary data source is the official MQA dashboard, which continuously harvests and assesses the metadata from all national portals connected to the European Data Portal. The measurement is therefore conducted on an ongoing basis by the Commission, and the role of the responsible authority is to monitor its national score and its ranking relative to other Member States. This method provides a standardised, comparable and low-effort proxy for metadata quality. |
| Volume and thematic distribution of reuse cases | The practical protocol involves a systematic audit of the national open data portal’s public reuse case repository or showcase. The measurement consists of two components. The first is total volume, calculated as the absolute count of unique and verified reuse cases listed. A case is considered ‘verified’ if it has a working link to the application or service and a clear description of its purpose. The second is thematic distribution, calculated as the percentage of total reuse cases that fall into each of the framework’s primary impact domains: economic, social and environmental. This requires a manual classification of each case based on its stated purpose. The primary data source is the national portal itself. The measurement should be conducted annually by the responsible authority. |
| Explicit dataset reference and citations | This protocol outlines a ‘best-effort’ approach using public search tools, acknowledging that without universal persistent identifiers (PIDs), measurement will be partial. The indicator is the simple count of verified citations found. The collection process, conducted annually by the responsible authority, involves a multi-pronged search strategy. First, for academic citations, automated search queries should be run on services like Google Scholar, Dimensions.ai and Scopus. Queries must combine the exact title of key datasets with the name of the publishing authority (e.g. ‘Annual Crop Survey’ AND ‘Ministry of Agriculture of [Member State]’). Second, for software references, the APIs of major code repositories, primarily GitHub, should be queried to search for direct URL links pointing to dataset resources on the national portal. Third, for policy citations, targeted keyword searches should be performed across national government publication archives and parliamentary records. |
3.2.2. Thematic impact and outcome indicators
Table 5 presents the operationalisation of the five selected impact and outcome indicators. For each indicator, a standardised measurement approach is provided that can be applied consistently across Member States.
Table 5. Operationalisation of prioritised impact and outcome indicators
| Indicators | Description of measurement |
|---|---|
| Employment | The practical protocol uses a robust, model-based estimation that combines national data with a centrally provided EU-level coefficient, avoiding the need for new, resource-intensive national surveys. The indicator calculates the ‘estimated number of open data-related FTEs’. The measurement process follows a clear division of tasks. 1. At the EU level (periodic research). To avoid placing formal reporting obligations on national statistical offices or Eurostat, a policy Directorate-General (such as the Directorate-General for Communications Networks, Content and Technology) or the central team supporting the European Data Portal will conduct periodic, targeted pan-European micro-surveys (or self-declared ‘smart surveys’) of open data reusers. The purpose of this agile research is to establish and update a credible ‘open data employment coefficient’. This coefficient represents the average percentage of ‘data professionals’ within a known open data-reusing firm who are dedicated to working with public open data. This coefficient should be published and disaggregated according to key sectors (e.g. mobility, finance, health). 2. At the Member State level (periodic calculation). National teams apply this central coefficient to their national context. The process is as follows.
|
| Gross value added | The practical protocol mirrors the hybrid approach used for the employment indicator. It uses a model-based estimation to calculate the ‘estimated GVA attributable to open data’ by combining national administrative data with a centrally provided EU-level coefficient. The measurement process follows a clear division of tasks. 1. At the EU level (periodic research). Through the same agile, pan-European micro-surveys (or ‘smart surveys’) coordinated by a policy directorate-general (such as the Directorate-General for Communications Networks, Content and Technology) or the European Data Portal team for the employment indicator, firms will also be asked to estimate their ‘open data dependency ratio’ (the percentage of their revenue they attribute to using open data). Based on this research, the central team will establish and publish an authoritative set of ‘sectoral open data GVA coefficients’. 2. At the Member State level (periodic calculation). The national team’s task is to apply this coefficient to their national context. The process is as follows.
|
| Transparency and accountability | This protocol uses a straightforward audit of the national data portal to calculate a composite ‘national accountability data index’. The indicator is a score out of a possible 10 points. The score is calculated by assessing the availability and quality of five key accountability dataset categories. For each category, a score of 0, 1 or 2 is assigned.
The five key accountability categories to be assessed are as follows.
The final score is the sum of the points for each of the five categories. This audit is to be conducted annually by the responsible authority. |
| Timeliness and quality of core environmental reporting | The practical protocol uses a targeted audit of a small number of critical, legally mandated environmental datasets to calculate a composite ‘core environmental governance data index’. The indicator is a score out of possible 6 points, calculated by assessing three key dataset categories. For each category, a score of 0, 1 or 2 is assigned:
The three core accountability categories to be assessed are as follows.
This periodic audit, conducted by the responsible authority, is highly practical as it requires checking only three specific, well-known datasets for two clear criteria. |
| Digital sovereignty and strategic risk | The practical protocol assesses infrastructure resilience and monitors for targeted, large-scale data extraction using an anomalous harvesting index. Acknowledging that open data is intended for global reuse, this measurement focuses strictly on anomalous, automated mass-harvesting rather than routine international traffic. The anomalous harvesting index is a qualitative security metric. It evaluates the frequency and severity of automated, high-volume data extraction attempts that threaten portal infrastructure or signal strategic bulk harvesting. It is calculated by the portal’s technical team during a quarterly review of aggregated, privacy-compliant security logs. The calculation involves extracting incident reports from the portal’s web application firewall (WAF) or threat intelligence platform. The team filters these reports for incidents where mass API calls or scraping attempts exceed standard rate limits. To ensure compliance with data protection regulations, the analysis relies on autonomous system numbers (ASNs) and registered organisation blocks rather than individual IP addresses. This provides visibility into whether traffic originates from known commercial data brokers or state-level entities without processing personal data. Based on this aggregated data, the technical team assigns a status score. Green indicates standard traffic patterns with no anomalous WAF interventions. Amber indicates sporadic mass-harvesting attempts detected and managed by the WAF, requiring routine monitoring. Red indicates sustained, high-volume extraction attempts by identified corporate or state-level actors, requiring escalation to a national cybersecurity agency. |
3.3. The Member State Toolkit for Measuring Open Data Impact
The Member State Toolkit for Measuring Open Data Impact provides a practical, evidence-led framework for Member States to measure the impact of their open data programmes. It is designed for policy leads, national statistical offices and open data portal teams that require clear, operational instructions for measuring both the foundational output indicators and the thematic impact indicators. Its primary purpose is to enable consistent, comparable and credible reporting on how the application of open data contributes to tangible economic, social, environmental and strategic outcomes across the EU.
The framework is underpinned by three core design principles. First, practicality ensures that measurement protocols make the maximum use of existing administrative and commercial data sources, minimising the need for new, resource-intensive EU or national surveys. However, these may become necessary as the framework and the use of it evolves. Second, coherence guarantees alignment with established methodologies such as the European Data Market Study 2024–2026 and the ODM report, positioning this framework as an integrated component of the Commission’s broader data economy monitoring. Third, proportionality delivers a balanced approach by providing a practical protocol for each of the indicators and an comprehensive protocol that sets out a pathway toward more rigorous methods as national capabilities mature.
The toolkit is structured as a series of indicator ‘recipes’ that follow the open data value chain from initial supply to final impact. Each recipe explains the indicator’s purpose and rationale, maps its causal pathway and provides detailed guidance for both practical and idealised measurement. It also includes instructions for interpreting results to ensure comparability across Member States. National teams should begin by applying the practical protocols to establish a baseline. This will provide an immediate, evidence-based assessment of their national open data ecosystem and form the basis for the first cycle of open data impact reporting.
The complete Member State Toolkit is included as an annex to this report.
4. Engagement strategy
This chapter outlines the engagement strategy to involve Member States in shaping and validating the measurement framework to ensure it is both methodologically robust and operationally feasible across diverse national contexts. First, it describes the roll-out of a structured survey designed to collect insights from the Public Sector Information (PSI) Expert Group, focusing on relevance, methodological validation and implementation challenges (Section 4.1). First, it describes the roll-out of a structured survey designed to collect insights from the PSI Expert Group, focusing on relevance, methodological validation and implementation challenges (Section 4.1). It then presents a summary of insights from in-depth interviews conducted with selected Member States to explore national contexts, identify methodological challenges and capture detailed perspectives on practical requirements (Section 4.2). Finally, it summarises discussions that were held during a workshop in Tallinn, Estonia, with open data experts from a broad range of Member States (Section 4.3).
4.1. Survey rollout
A survey was conducted to gather expert perspectives on the proposed framework for measuring open data impact, focusing on its relevance, structure and implementation challenges. The survey, programmed in EUSurvey, was open between 28 October and 10 November 2025 and targeted the PSI Expert Group, which includes one representative from each Member State. In total, 15 responses were received. The following section will present the survey findings.
The questionnaire was structured into five parts: (1) general needs and relevance, exploring the perceived importance of a common EU approach and expected benefits; (2) the structure and logic of the framework, assessing the clarity and relevance of the core concepts of the framework; (3) the prioritisation of indicators, ranking output and impact indicators across economic, social, environmental and strategic dimensions; (4) data availability and implementation challenges, identifying barriers and support needs; and (5) final comments, allowing respondents to share additional insights and reference materials. The complete questionnaire is included as an annex to this report.
4.1.1. General needs and relevance
Respondents expressed mixed views regarding the relevance of a coordinated EU approach to measuring open data impact. While some Member States considered such an approach highly relevant, others regarded it as having little or no relevance to their national context. Some comments highlighted potential benefits, such as fostering knowledge sharing and improving measurability, whereas others stressed that a single approach cannot accommodate diverse national contexts and legal frameworks.
Furthermore, respondents (with the option to select up to three benefits) highlighted several benefits of a coordinated approach to assessing open data impact. The most frequently cited were providing robust evidence for EU and national policy decisions (9 of 15), establishing shared methodological standards (9 of 15) and enabling consistent monitoring of progress (7 of 15). Other benefits noted were improved comparability across Member States (6 of 15) and better coordination and knowledge sharing (4 of 15), while aspects such as public communication and awareness (3 of 15), stronger economic benefits (2 of 15) and alignment with EU benchmarks and assessments (1 of 15) were mentioned less often.
When asked about existing national approaches to measuring open data impact, the respondents (with the option to select multiple answers) reported limited or informal practices. The dominant methods included ad hoc or thematic assessments (9 of 15) and case studies (9 of 15). Only 2 of 15 respondents indicated having a comprehensive national measurement framework, and 1 of 15 mentioned a partly structured methodology, while 1 of 15 respondents noted that no efforts to measuring open data impact are currently in place. This suggests most Member States rely on fragmented or project-based evaluations rather for assessing the impact of open data. In terms of the fit with existing measurement instruments, the 15 respondents rated the alignment of the proposed framework with existing national or EU measurement efforts at an average of 3.57 on a scale of 0 to 5. Several comments underscored the importance of full alignment with or integration into the EU ODM report.
Regarding the proposed types of evidence, the 15 respondents rated all types as moderately to highly relevant on a 0–5 scale, with case studies and reuse examples receiving the highest average score (3.87), followed by surveys (3.73), quantitative indicators (3.60) and qualitative research (3.57). On reporting frequency, most respondents preferred collecting and publishing open data impact every 2–3 years (10 of 15), while a smaller share preferred annual reporting (3 of 15), every 4–5 years (2 of 15), or ad hoc/project-based updates (1 of 15), with 1 of 15 indicating no strong preference.
As displayed in Figure 5, respondents ranked policy domains according to their relevance for assessing open data impact. Public services and governance, economy and innovation, digital transformation and data infrastructure emerged as the highest-ranked domains. Transport and mobility, healthcare, and climate and environment were also assessed highly relevant – areas closely aligned with the EU’s HVD themes. By contrast, culture and media and foreign affairs were ranked lowest, suggesting they are seen as less likely to yield significant, measurable benefits within the proposed framework.
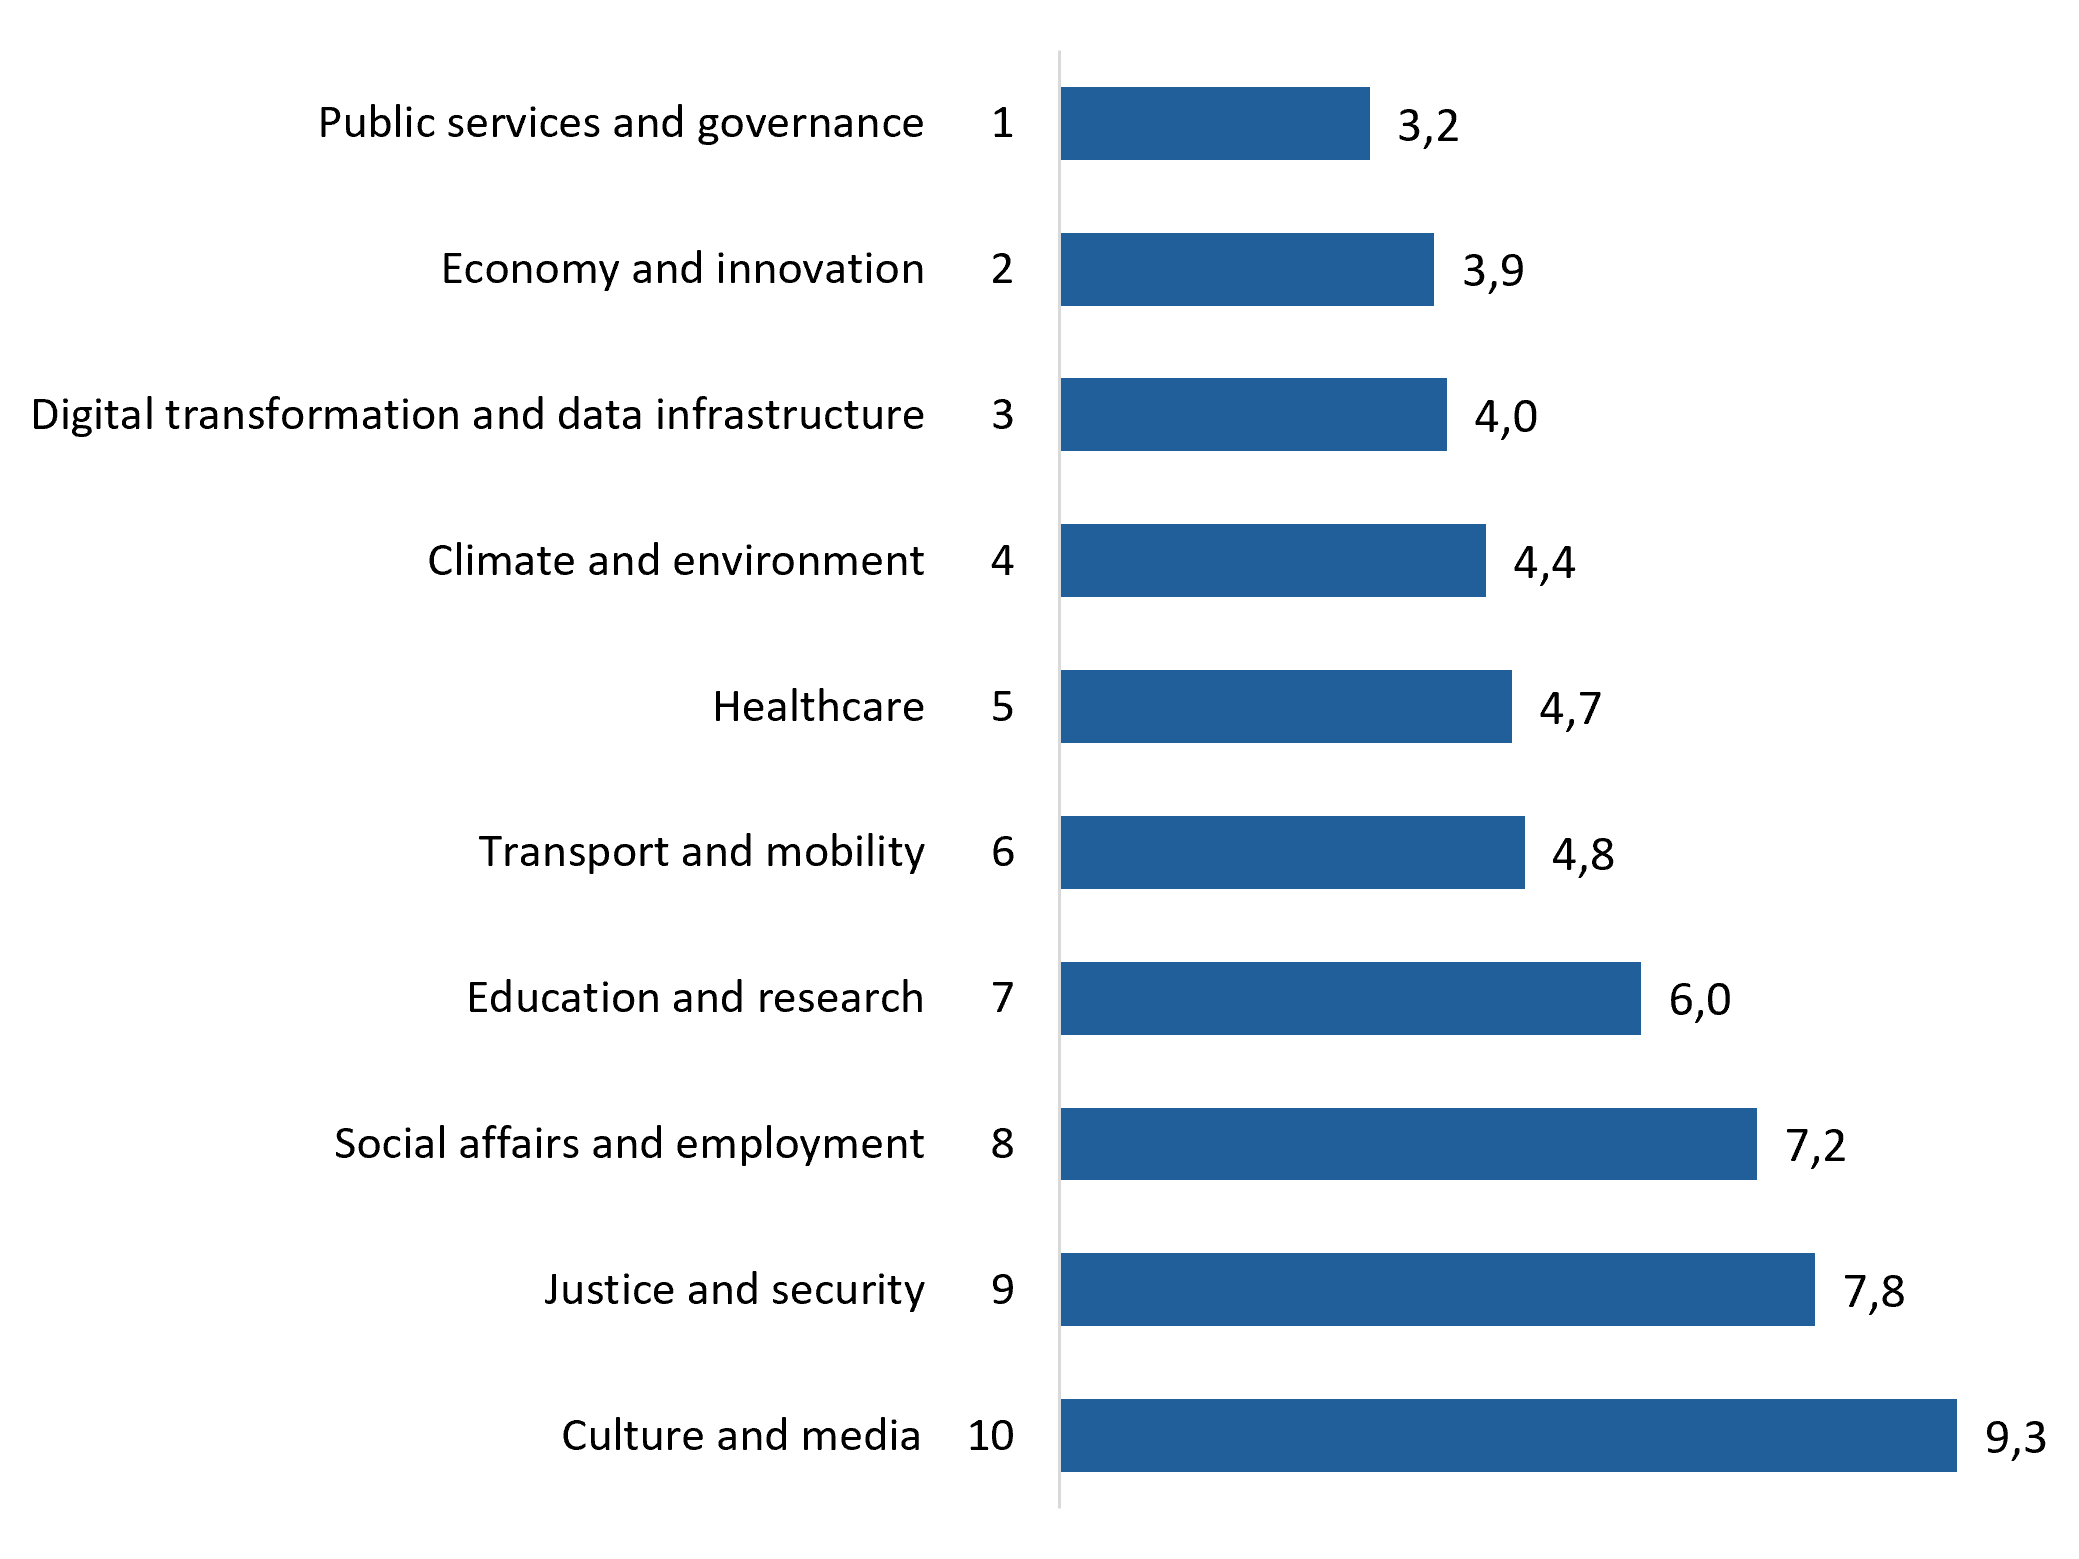
Figure 5. Prioritisation of policy domains
4.1.2. Structure and logic of the framework
Respondents provided mixed feedback on the structural logic of the proposed framework. The articulation of the open data value chain – collection, publication, uptake and application – was rated moderately appropriate for analysing open data with an average score of 3.6 on a scale of 0 to 5 out of 15 respondents. Comments acknowledged that the structure broadly reflects the open data life cycle but raised concerns about practical application to the framework, particularly regarding challenges in measuring indicators for the uptake and application stages. Similarly, the distinction between outputs, outcomes and impacts was considered a clear and logical basis for measurement, with an average of 3.21 on a scale of 0 to 5 out of 15 respondents, but difficulties were mentioned regarding operationalisation. Respondents highlighted uncertainty about indicator quality and the complexity of attributing long-term impacts to open data. The underlying intervention logic linking activities to outputs, outcomes and impacts received a lower score of 2.86 on a scale of 0 to 5 out of 15 respondents.
Regarding the relevance of the proposed impact dimensions, the 15 respondents rated the social dimension as most important, with a score of 3.93 on a scale of 0 to 5. This was closely followed by the economic dimension (3.86) and the environmental dimension (3.64), while the strategic dimension received the lowest score (3.00). Some Member States suggested refining the framework by removing the strategic dimension, arguing that its inclusion adds unnecessary complexity. Others also emphasised the need to align the framework’s dimensions with those used in the ODM report to ensure consistency and integration with existing EU open data practices.
4.1.3. Prioritisation of indicators
To validate the prioritisation of indicators as explained in Chapter 3, the 15 respondents were asked to rank all indicators within each dimension (output, social, economic, environmental and strategic).
Figure 6 illustrates that the survey results broadly align with this study’s prioritisation of the foundational output indicators, though some differences emerge. Publications volume and growth (2nd), HVD publication rate (3rd) and metadata quality (4th) were ranked highly, consistent with the prioritisation of this study. However, the volume and distribution of reuse cases (8th) and explicit dataset references and citations (11th) were ranked much lower. This suggests that Member States value indicators coming from the publication stage, while those reflecting the uptake and application stages are considered less critical. Notably, strategic data governance was ranked as the most important indicator by respondents, whereas it was not included in the prioritisation of this study, indicating a stronger emphasis among Member States on governance as a foundational enabler of open data ecosystems.
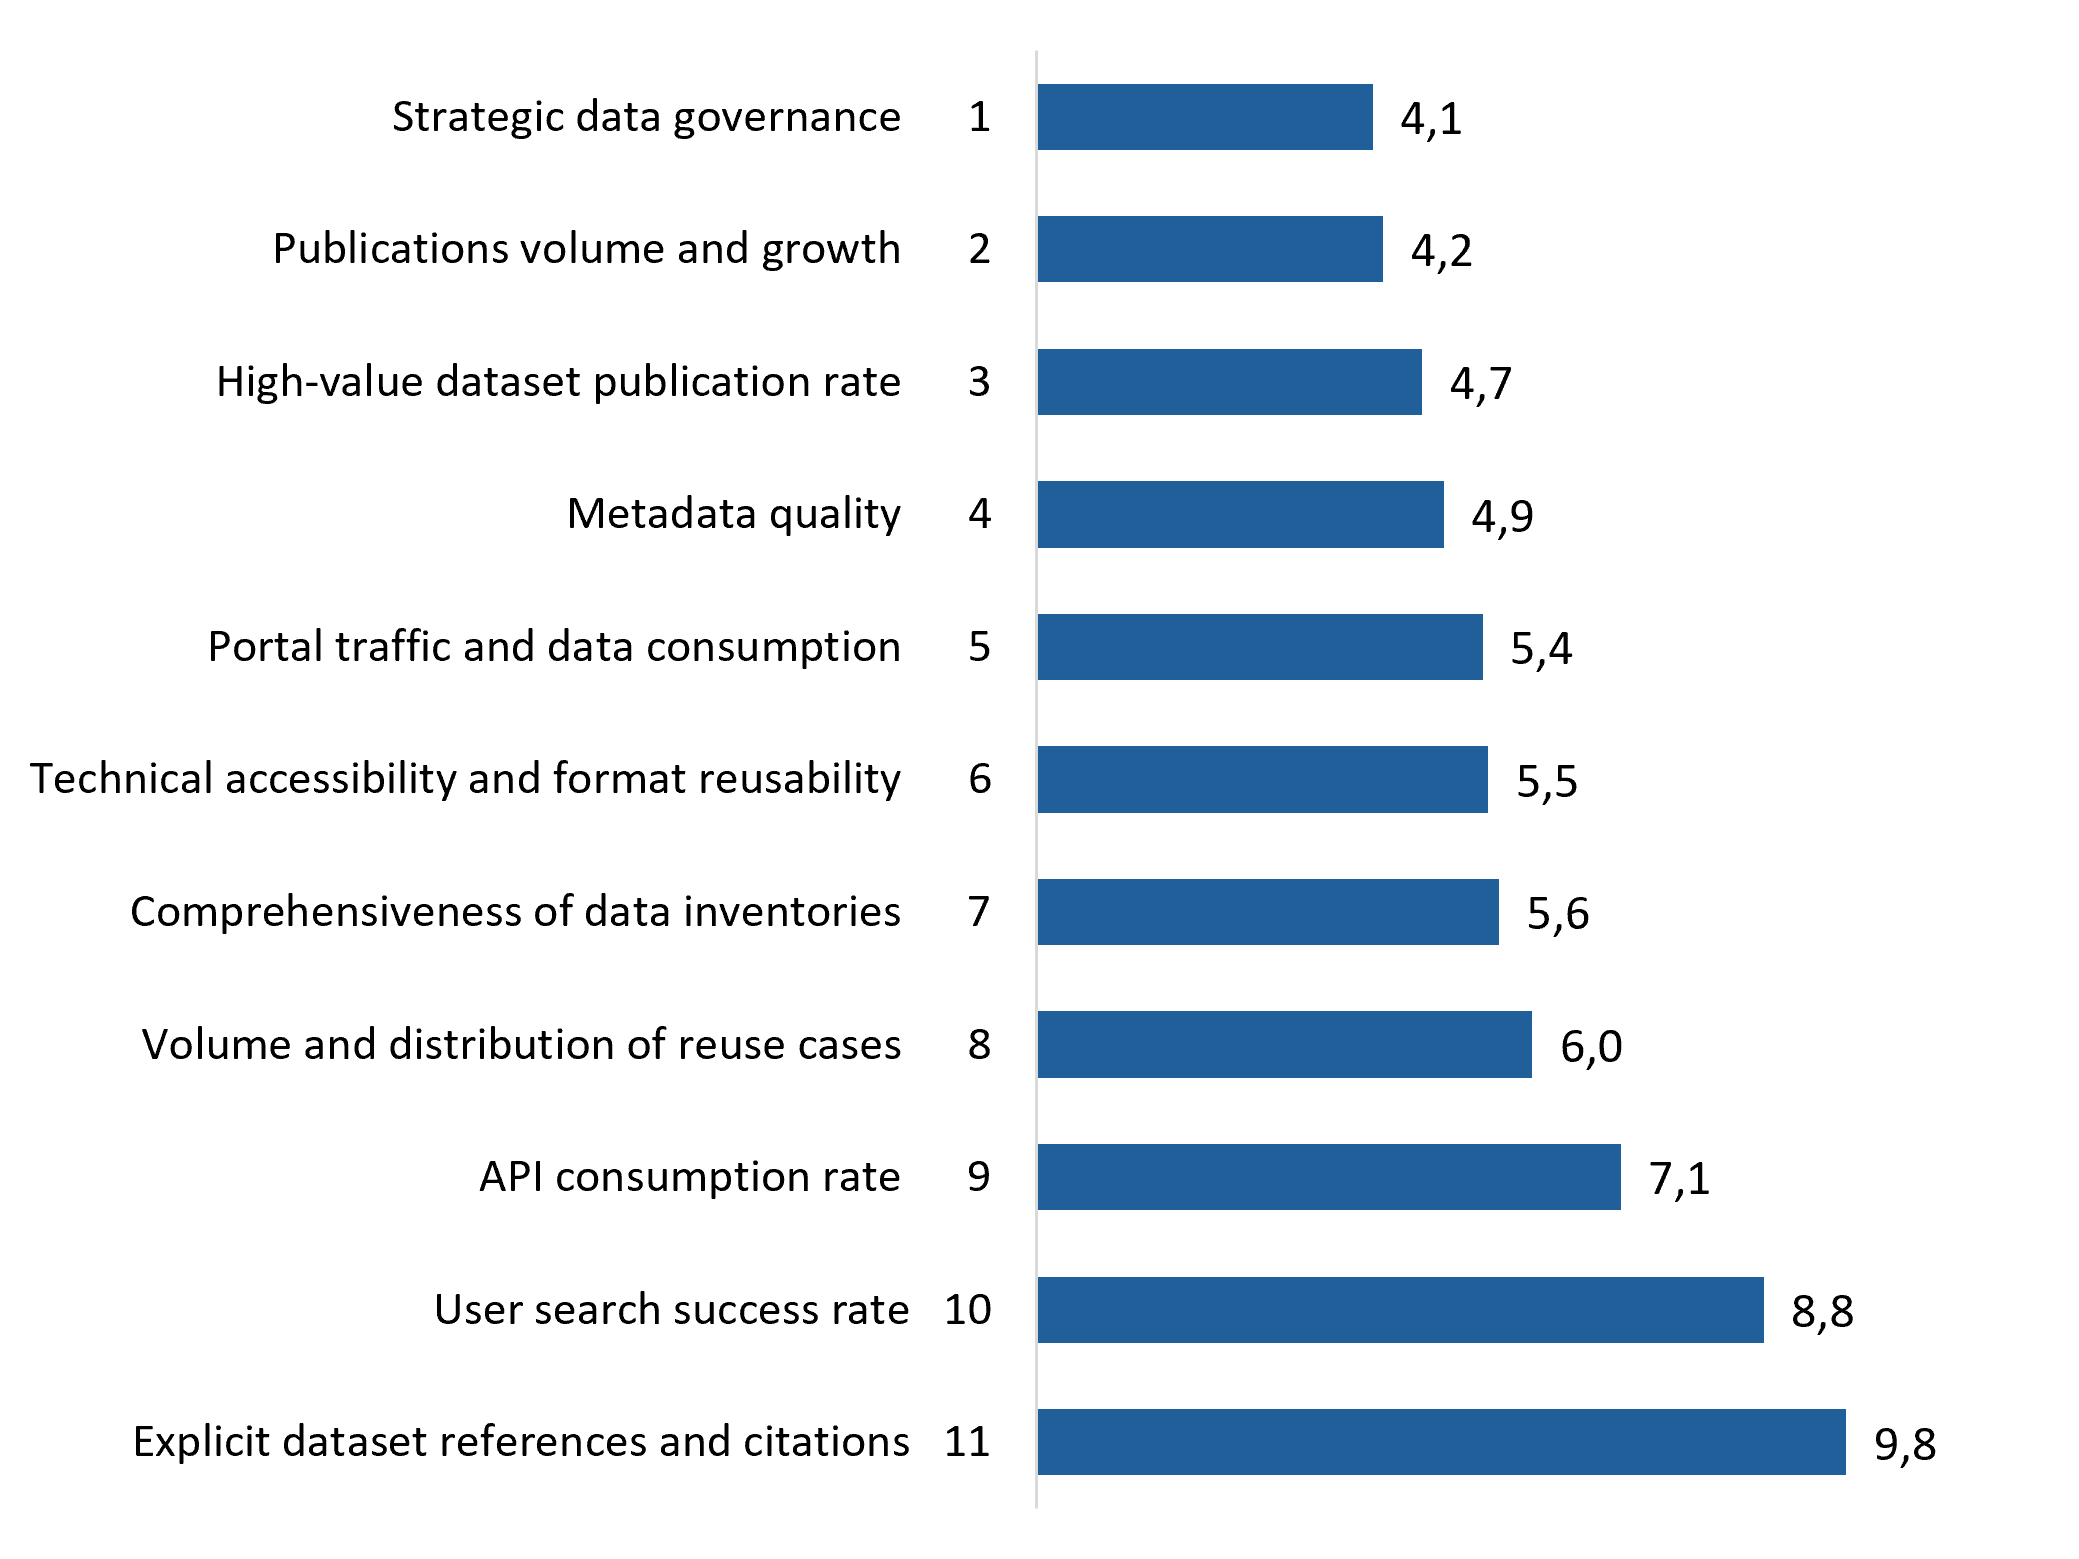
Figure 6. Prioritisation of foundational output indicators
Figure 7 shows that the survey results partially reflect this study’s prioritisation of the economic dimension. GVA was ranked 2nd, aligning with this study’s selection, while employment appeared lower at 4th, indicating lower perceived relevance among respondents. This study focused on these two indicators because they provide significant value for generating initial EU-level insights into open data’s economic impact. By contrast, innovation (ranked 1st) and cost savings (ranked 3rd) were not prioritised in this study, as their proposed measurement approaches require extensive preparation and resources beyond the scope of this first iteration.
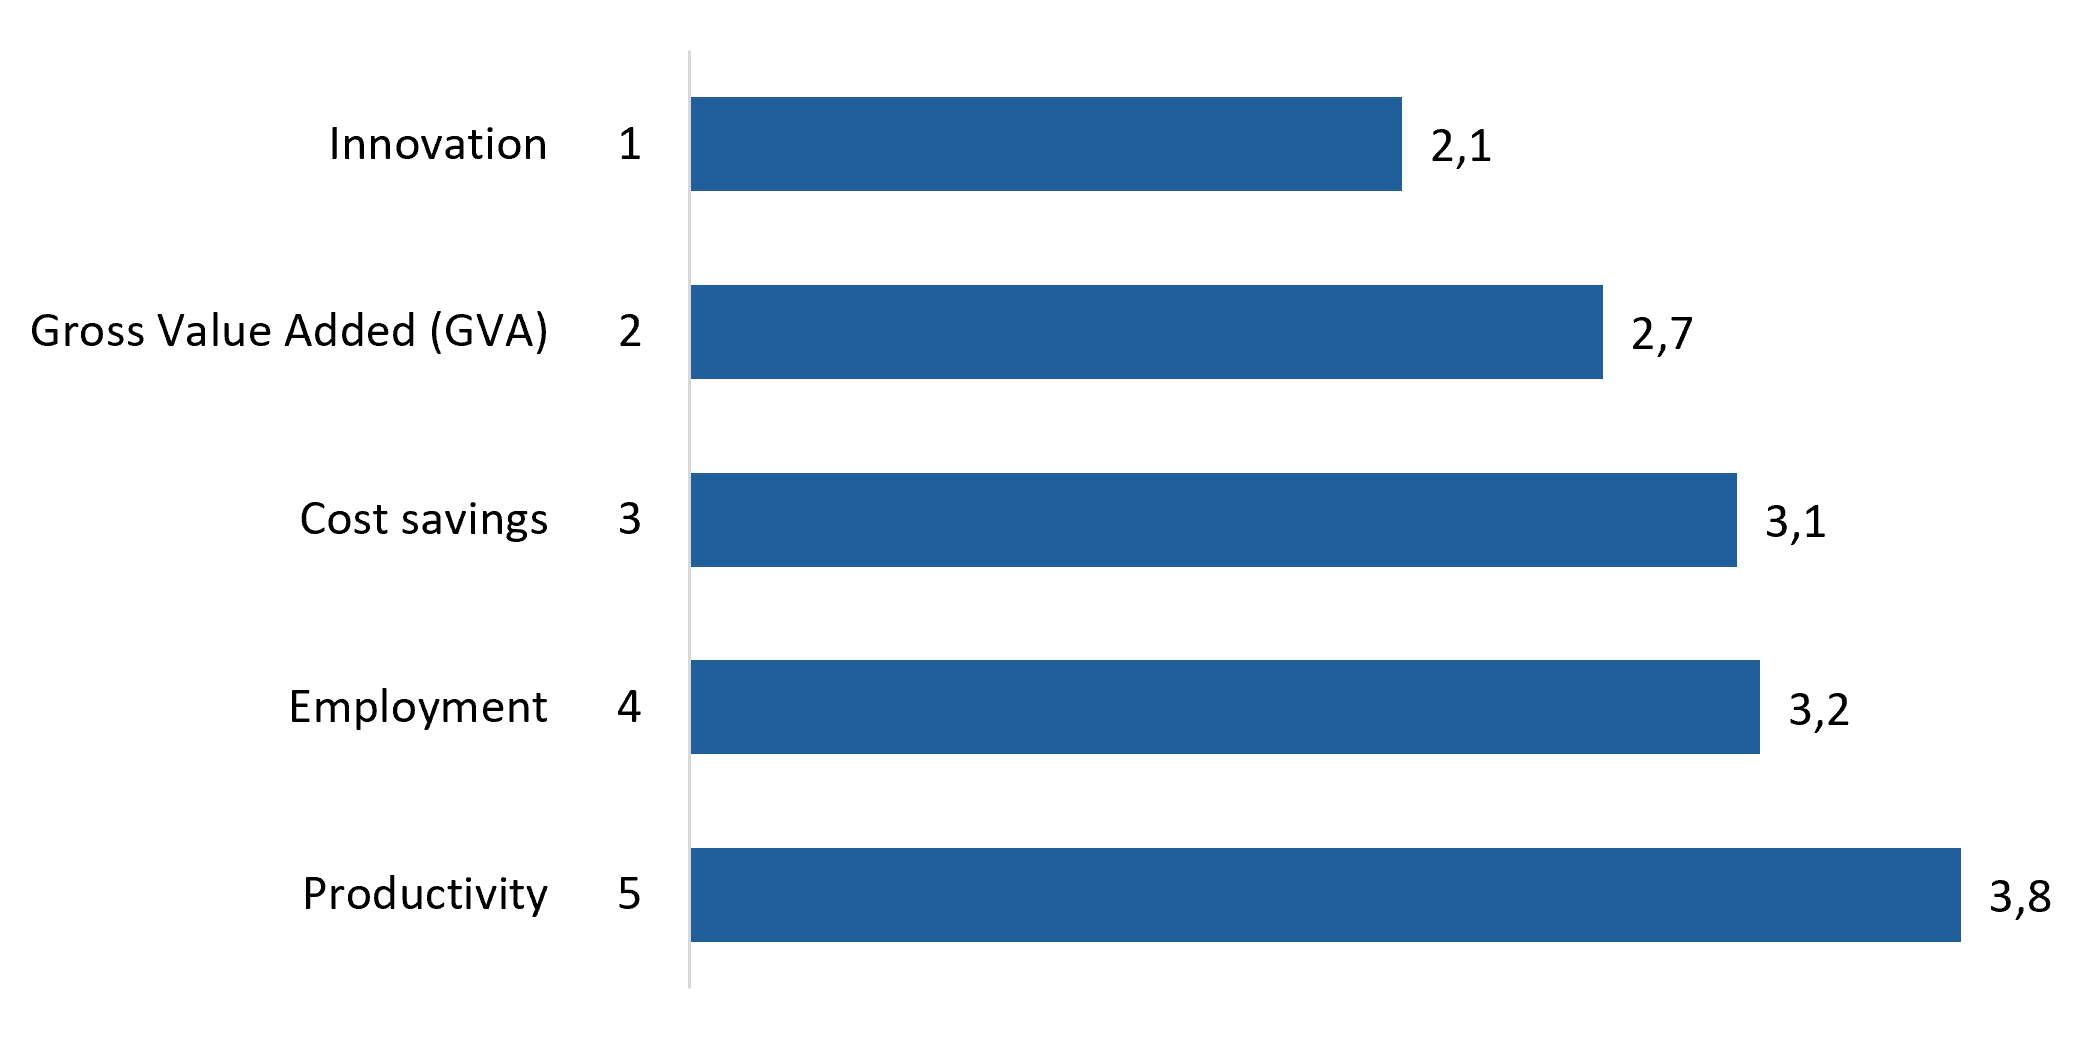
Figure 7. Prioritisation of economic impact indicators
Figure 8 illustrates a clear divergence between the survey results and this study’s prioritisation of the social dimension. While this study selected transparency and accountability as a key social indicator, respondents ranked it last (5th), favouring quality of decision-making (1st) and access to public services (2nd). However, transparency and accountability was included because open data plays a critical role in strengthening government integrity, reducing corruption and promoting public oversight, effects that should be clearly reflected in the initial results of this framework.
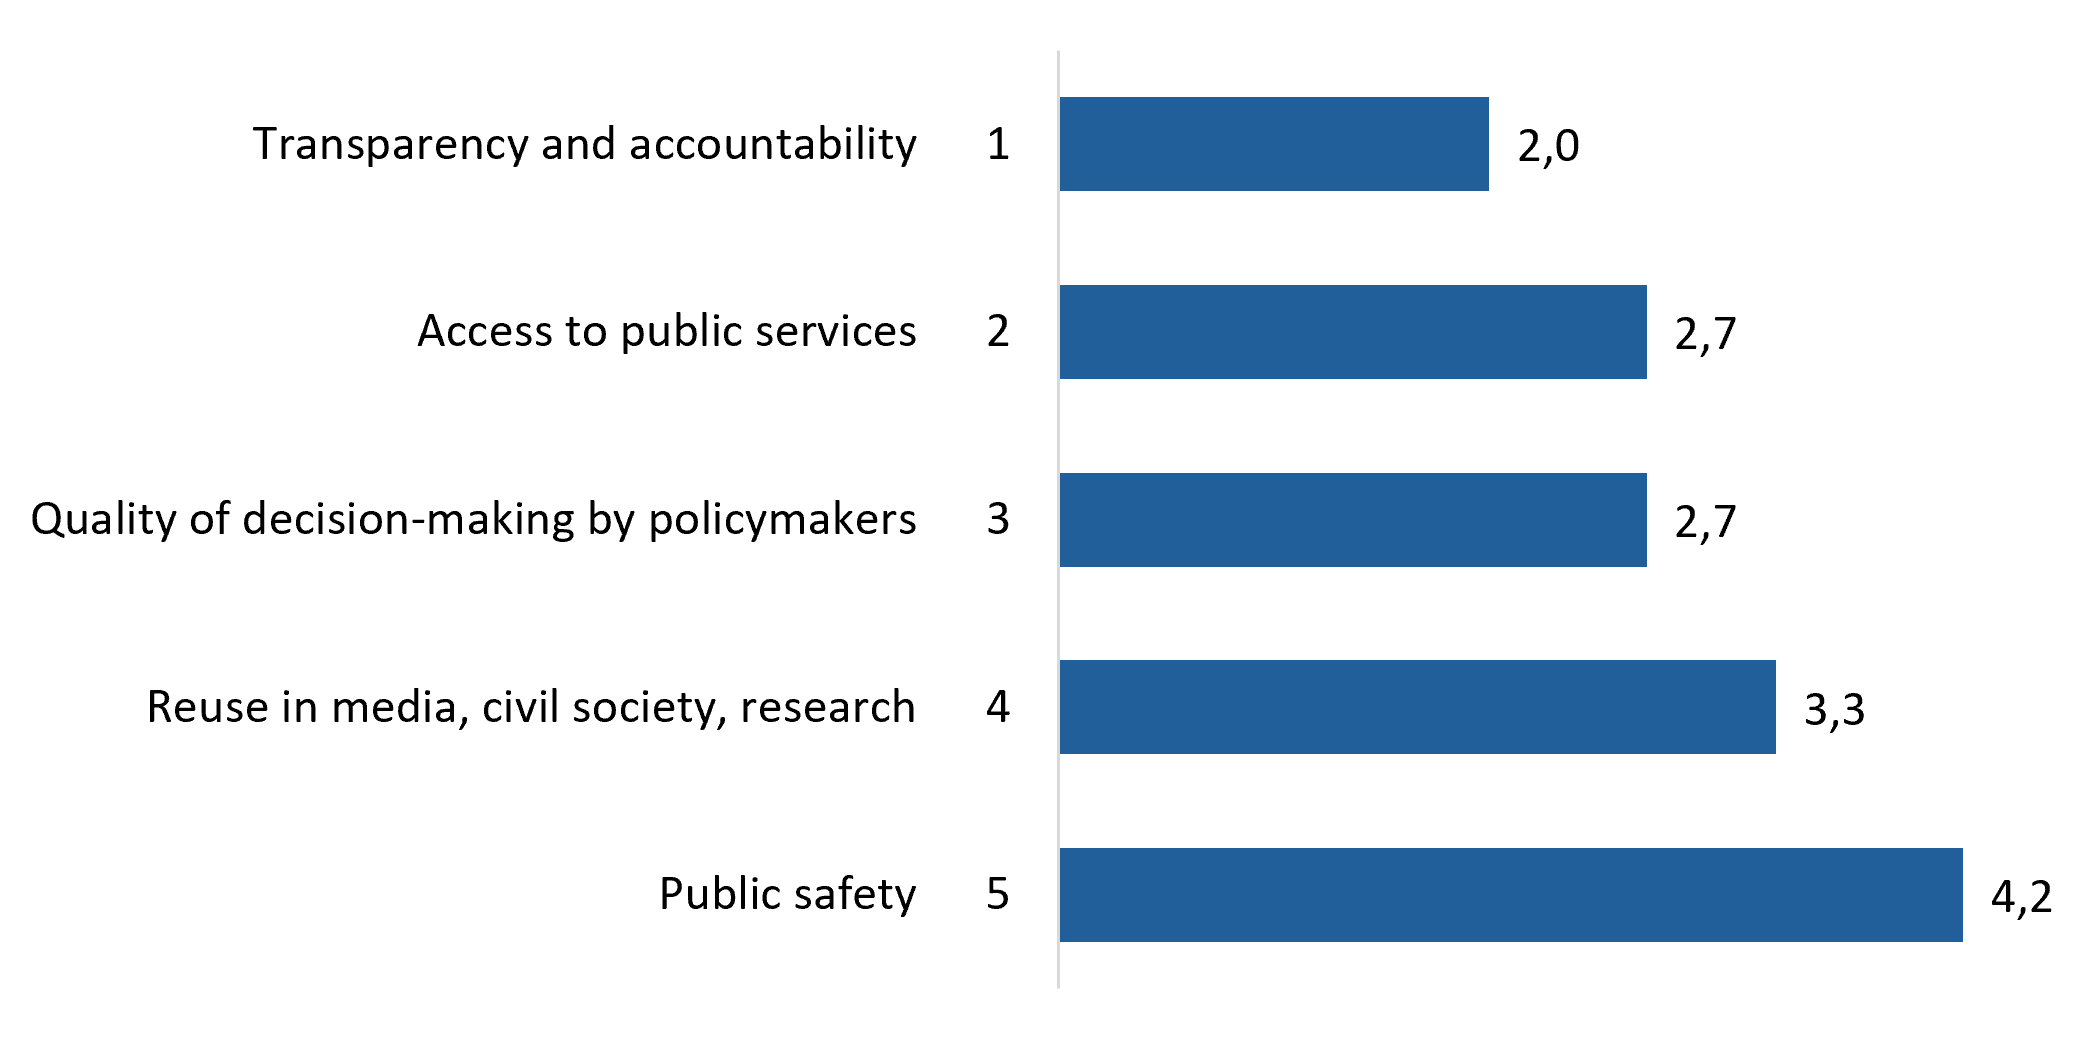
Figure 8. Prioritisation of social impact indicators
Figure 9 shows that the prioritisation of environmental governance and research within the environmental dimension contrast with the survey results. The indicator was ranked 3rd behind climate action and emissions reduction (1st) and sustainable resource management (2nd). This indicates that Member States place greater importance on climate-related impacts compared to governance-focused measures. However, this study selected environmental governance and research because directly quantifying the impact of open data on environmental outcomes was too complex for the first iteration of this framework. Therefore, this indicator was chosen as a practical and measurable proxy for assessing how open data supports environmental policy implementation.
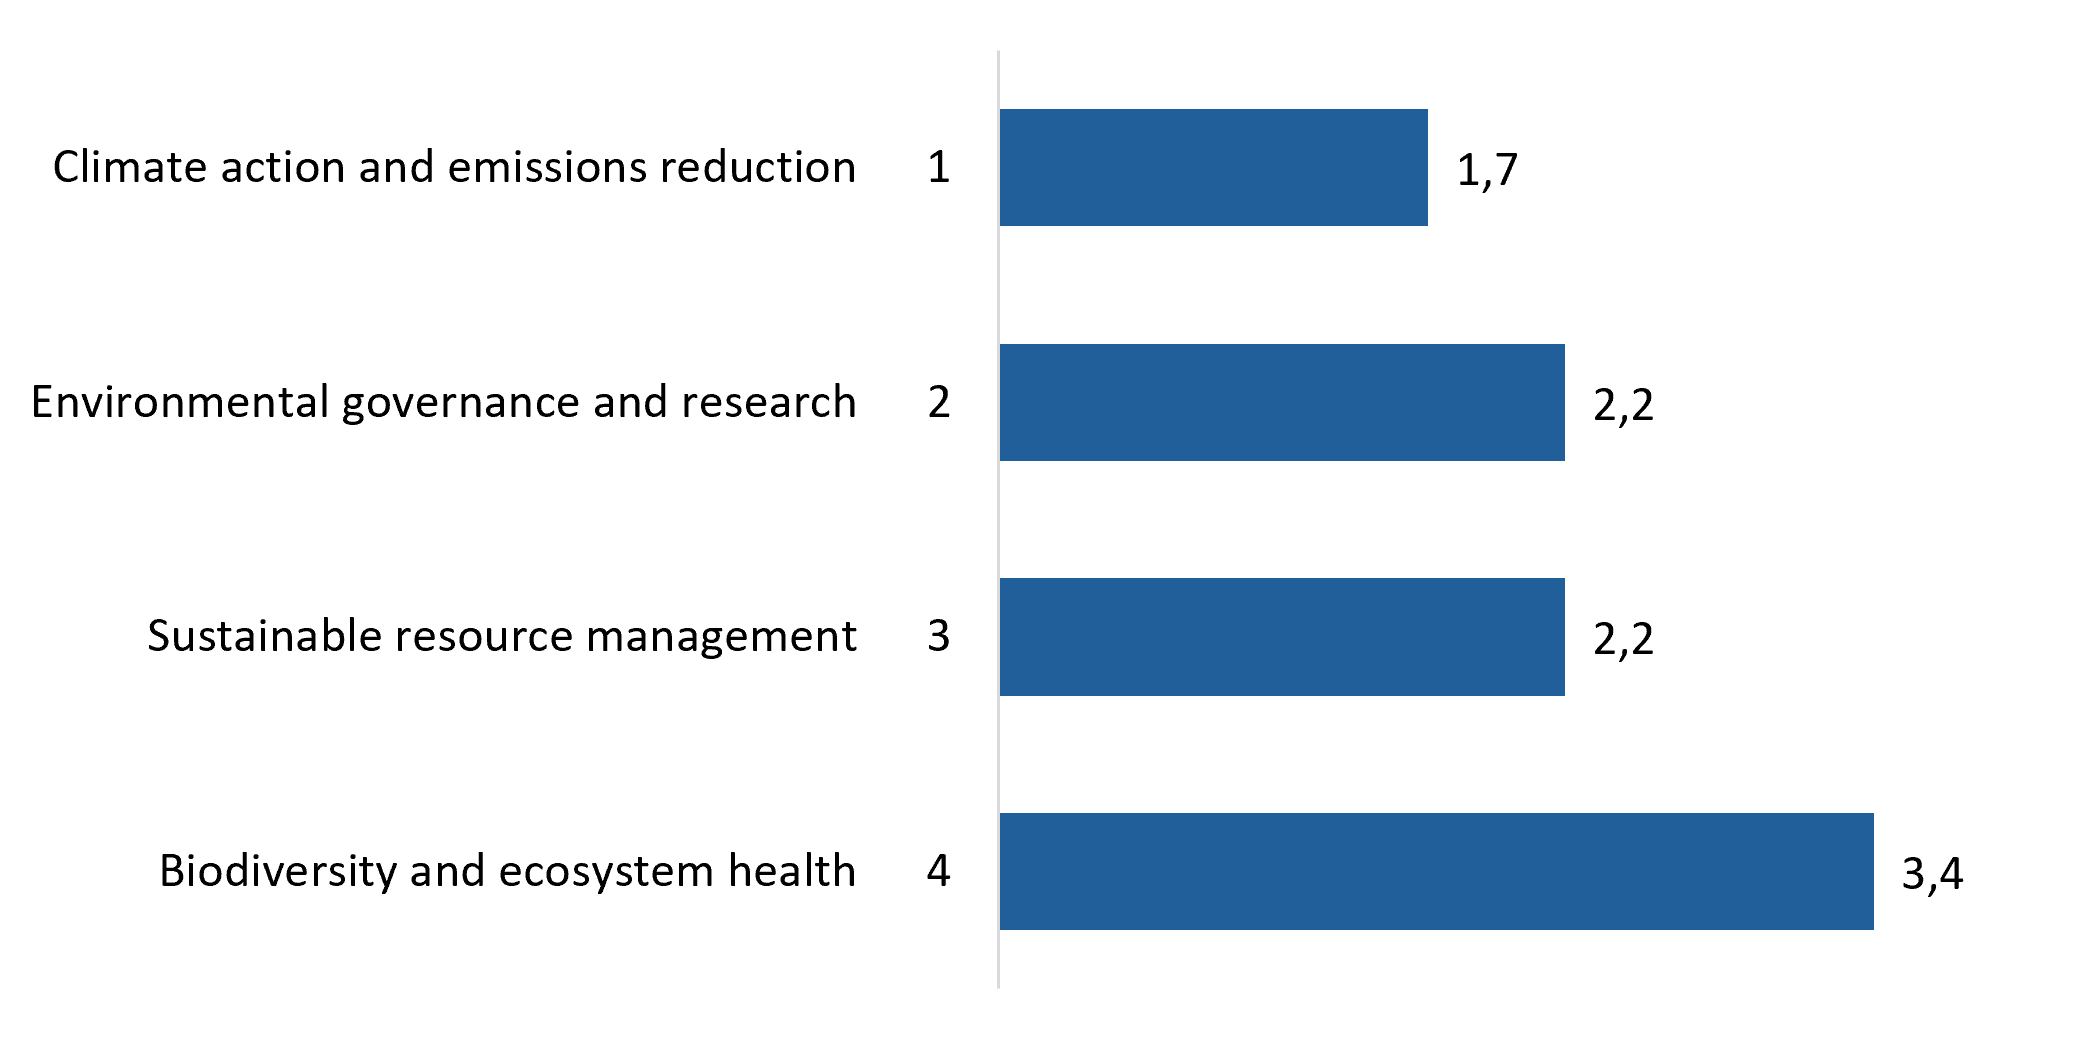
Figure 9. Prioritisation of environmental impact indicators
Finally, Figure 10 confirms strong alignment between the survey results and this study’s prioritisation of the strategic dimension. The digital sovereignty and strategic risk indicator was ranked highest by respondents, reinforcing its importance as a strategic indicator for monitoring external dependencies and EU autonomy.
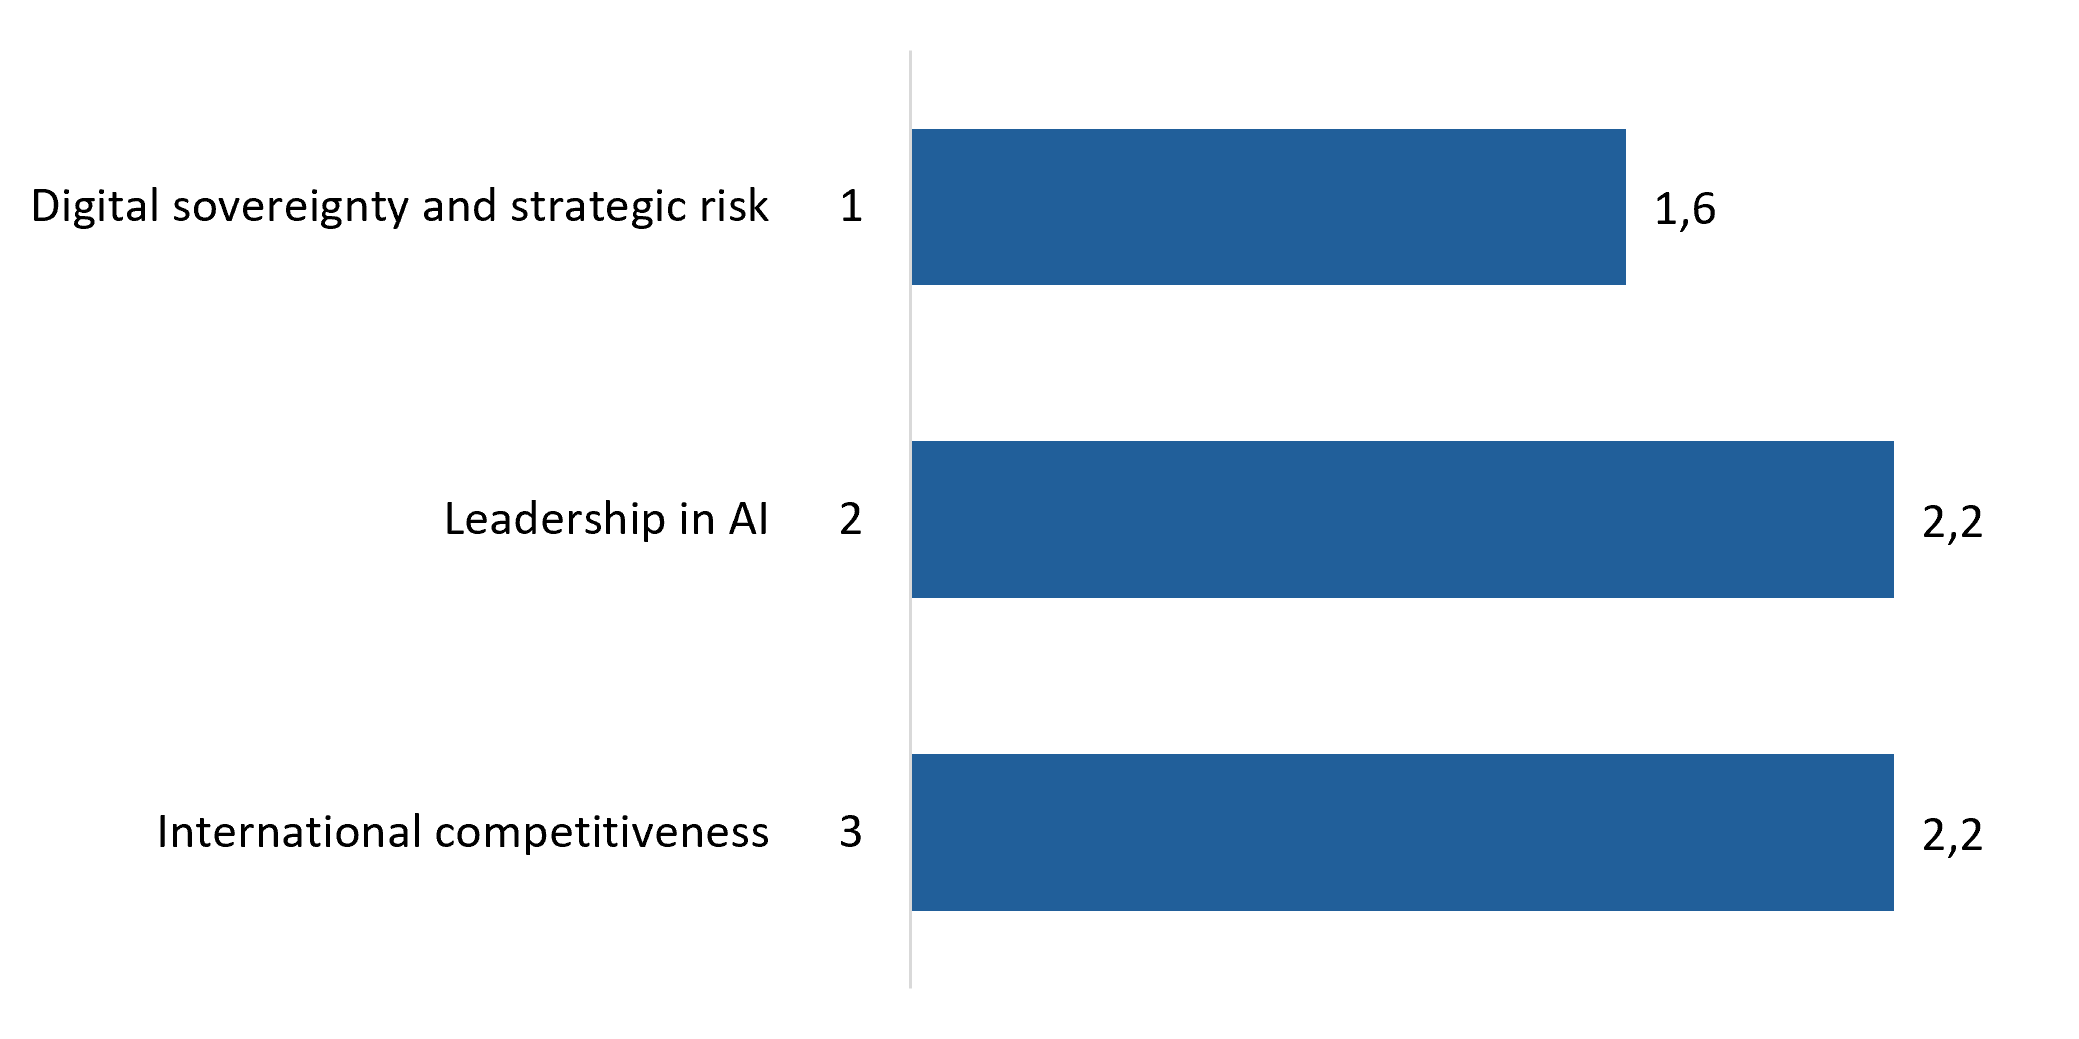
Figure 10. Prioritisation of strategic impact indicators
4.1.4. Data availability and implementation challenges
Respondents were asked to evaluate the availability of the data needed to measure this study’s prioritised indicators. According to the 15 respondents, the foundational output indicators are generally accessible across Member States. Publication volume and growth (3.93), HVD publication rate (3.79) and metadata quality (4.14) received relatively high scores for data availability on a scale of 0 to 5, reflecting the maturity of the portal-level indicators. In contrast, volume and thematic distribution of reuse cases (2.62) and explicit dataset references and citations (1.91) scored significantly lower, indicating persistent challenges in tracking reuse and application of open data. For the impact indicators, availability was considered much lower across all dimensions by the 15 respondents. Job creation (1.57), GVA (1.50) and digital sovereignty and risk (1.40) received the lowest scores, while transparency and accountability (2.27) and environmental governance and research (2.25) were perceived as slightly more accessible. This underscores the need for strong methodological support and capacity building for future implementations of the proposed framework.
Next, respondents (with the option to select up to three options) identified several barriers to collecting data for the proposed indicators of the framework. The most frequently cited barrier was high costs or limited staff capacity (12 of 15), followed by a lack of coordination between involved institutions (8 of 15) and a low institutional priority for measuring impact (8 of 15). Other barriers noted were time-intensive processes or administrative burdens (7 of 15), while issues such as the limited technical capacity of open data outputs (2 of 15) and legal or privacy constraints (1 of 15) were mentioned less often.
In addition, when asked about implementation challenges beyond data availability, respondents highlighted several themes (with the option to select up to three options). Insufficient (financial) resources and the complexity of indicators and calculation methods emerged as the most pressing concerns, each cited by 8 of 15 respondents. Coordination issues were also prominent, with limited collaboration among key stakeholders and a lack of political or institutional support both mentioned by 6 of 15 respondents. Other challenges included the absence of suitable tools or IT infrastructure (4 of 15) and the perception that measurement is treated primarily as a compliance exercise (4 of 15). A smaller number pointed to limited analytical capacity (2 of 15). These findings point out that resource constraints, methodological complexity and governance gaps represent Member States’ most significant obstacles to successfully implementing the framework.
Furthermore, respondents highlighted several types of support that would be most helpful for implementing the framework (with the option to select up to three options). Templates and automation tools were the most frequently mentioned (11 of 15), and these will be addressed through the Member State Toolkit. Financial support and technical guidance on data collection followed closely, each cited by 7 of 15 respondents, highlighting the need for resources and expertise. Capacity building and training (5 of 15), peer exchange and best practices (5 of 15) were also valued. Overall, these findings indicate that Member States favour several ways of assistance that help support them in successfully implementing the framework in future assessments.
Finally, the 15 respondents rated their national administration’s financial and resource capacity at 1.9 on a scale of 0 to 5, indicating limited means to implement the framework. This suggests that without targeted support, Member States are likely to face challenges in applying the proposed framework.
4.2. In-depth interviews
To complement the survey and gain deeper insights into the practical application of the framework, a series of interviews were conducted with representatives from the PSI Expert Group from four selected Member States: Estonia, Italy, the Netherlands and Poland. These interviews aimed to explore the relevance of the framework, validate the proposed framework, prioritise indicators and identify practical needs for implementation. In addition, the discussions provided valuable input for preparing the pilot phase, as these Member States were also included in the pilot presented in Chapter 5, including clarifying data availability for the prioritised indicators of this study.
4.2.1. Relevance and structure of the framework
The interviewees generally confirmed the relevance of a harmonised EU-wide methodology for measuring open data impact. Several interviewees described the framework as highly needed, noting that some Member States do not have an approach to measure the impact of open data or that approaches differ significantly across Member States. To ensure coherence, interviewees stressed that aligning the framework with the ODM report is crucial to avoid duplication and to facilitate integration with existing EU monitoring practices. For Member States without a national mechanism to assess open data impact, the framework was seen as an opportunity to introduce a consistent and credible methodology. One interviewee emphasised that the initiative is very valuable as it could underpin future policy interventions but cautioned that the framework must be credible and methodologically sound to serve as a reliable basis for such decisions. Other interviewees acknowledged the ambitious nature of the framework, warning that assessing impact across diverse national contexts is challenging given the limited capacity and resources of national administrations.
The comprehensiveness of the framework was widely appreciated as interviewees generally agreed that it provides a complete picture of open data impact. In addition, the clear distinction between outputs and impacts was valued, described as a logical foundation of the framework. One interviewee highlighted the strength of the underlying intervention logic, which links activities to outputs, outcomes and impacts. This approach was considered methodologically sound because it clearly demonstrates, step by step, how open data leads to impact. However, other interviewees raised concerns that this could add unnecessary complexity and make it difficult to operationalise indicators across outputs, outcomes and impacts.
Further, interviewees generally viewed the foundational output indicators as relevant and feasible. In particular, the indicators that were already monitored through national portals were not seen as too difficult to measure. However, several interviewees cautioned against overemphasising HVDs, noting that many impactful datasets fall outside this category. Therefore, they recommended an approach that captures both HVD and non-HVD datasets, which is reflected in the framework. By contrast, the volume and distribution of reuse cases and explicit dataset references and citations were seen as more challenging due to the limited mechanisms available for tracking these indicators and persistent data gaps across Member States.
Moreover, interviewees broadly agreed on the relevance of the four impact dimensions, but their perceived importance varied. The economic dimension was consistently highlighted as a critical component for demonstrating the effects of open data, though interviewees acknowledged the methodological complexity of isolating economic effects. The social dimension was also considered highly relevant, with interviewees emphasising open data’s role in strengthening democratic processes and improving transparency. One interviewee suggested reframing this dimension to also include ‘democratic functioning’ that goes beyond transparency and accountability. Views on the environmental dimension were mixed. While most interviewees agreed on its importance, some questioned its feasibility. One interviewee argued that measuring direct environmental impact from open data is very difficult and suggested that it overlaps with the social dimension. Last, interviewees agreed that the strategic dimension is important, especially considering the increasing importance of AI and the need to ensure digital sovereignty.
4.2.2. Prioritised indicators
Interviewees broadly validated the prioritisation of the foundational output indicators. In addition, respondents considered them feasible where they already monitored through national portals and data.europa.eu. In particular, publication volume and growth, HVD publication rate and metadata quality were viewed as valuable signals of the health of the open data ecosystem and the conditions for enabling societal impact. Existing portal statistics and the metadata quality assessment (MQA) were cited as good data sources for these indicators, although some interviewees noted they did not have MQA scores or HVD publication numbers prepared. Moreover, the volume and distribution of reuse cases indicator was consistently described as challenging. Most Member States lack a systematic mechanism to collect reuse cases, relying instead on individual cases or incomplete lists. Interviewees also highlighted the need for a harmonised EU definition of a ‘reuse case’, as current practices vary widely from a media citation to an open data-dependent service or organisation. This ambiguity was seen as a key challenge for operationalising this indicator. The explicit dataset references and citations indicator was considered even more difficult. Interviewees noted that systematic tracking of citations is absent in their national contexts and that current approaches consist of manual searches on scholarly platforms. Overall, interviewees were in favour of the idea of introducing PIDs such as DOIs to enable automated citation monitoring.
The prioritisation of the impact indicators was broadly supported by the interviewees. At the same time, several interviewees were sceptical about the feasibility and data availability of some indicators, noting that while conceptually relevant, practical measurement remains challenging in the short term. For instance, the economic indicators (employment and GVA) were highlighted as critical indicators by all interviewees, yet they acknowledged the methodological difficulty of isolating open data contributions to macroeconomic outcomes. One interviewee cautioned about the idea of launching new business surveys for upcoming measurements, noting that these surveys are not always reliable. Respondents of these surveys do not always recognise open data use, which can lead to biased results. Therefore, interviewees favoured the model-based estimation methods, using the European Data Market Study 2024–2026 as a starting point for estimating the economic effects of open data. Within the social and environmental dimensions, interviewees considered transparency and accountability and environmental governance and research relevant and workable proxies for assessing social and environmental impact, with data largely available. Finally, the strategic indicator on digital sovereignty and strategic risk was considered important for monitoring how open data affects the strategic position of the EU and its Member States. One interviewee suggested that the indicator leadership in AI might be more relevant, given that open data provides essential input for training AI systems.
4.2.3. Practical needs
Interviewees emphasised that practical implementation of the framework requires strong EU-level support and clear instructions. They all favoured the idea of a Member State Toolkit that has step-by-step instructions for each indicator and a harmonised methodology to ensure comparability across Member States. One interviewee suggested including operational roles and required skills within the methodology to ensure clarity on who should perform the measurement and what expertise and knowledge is needed for each indicator. Interviewees also raised questions about the division of responsibilities between Member States and the EU. On this point, one interviewee mentioned that the Commission should provide technical guidance and take care of aggregating results, while Member States should focus on collecting data and measuring the indicators. In practice, however, aggregation at the EU level may not always be possible, as Member States may implement and measure different indicators during the early stages of implementing the framework. Lastly, one interviewee cautioned that EU-level benchmarking within the framework would be difficult due to institutional differences and recommended focusing first on producing robust national results rather than creating direct comparisons across Member States.
4.3. Insights from the European Data Portal workshop
To further validate the framework and ensure it addresses the practical realities of national administrations, a workshop was held with representatives from Member States in Tallinn. The session focused on the strategic positioning of the framework and its alignment with existing policy instruments. Three key themes emerged from the discussion.
Alignment with the open data maturity assessment
A primary point of discussion concerned the relationship between the proposed impact framework and the existing ODM assessment. Member States expressed curiosity regarding how this new methodology might influence or align with future ODM exercises. There is a clear demand for coherence to ensure that impact measurement complements the maturity assessment without creating duplicative reporting burdens. The discussion highlighted the need to clearly distinguish between measuring the readiness of a country (maturity) and the actual socioeconomic effects realised (impact).
The convergence of open and protected data
A broader strategic question emerged regarding the future scope of the framework. Member States noted that the distinction between ‘open data’ and ‘protected data’ is increasingly blurring, both in governance structures and in day-to-day practice. As the different parts of the Data Act (previously related to the Data Governance Act) come into force, public administrations are managing broader data sharing ecosystems that include non-open/protected data.
Participants questioned whether a measurement framework focusing exclusively on ‘open data’ will remain sufficient in the long term, or if it should evolve to assess the impact of wider data sharing initiatives. This suggests that future iterations of the framework may need to account for shared data spaces where value is generated through controlled reuse, not just open publication.
Refining the open data value chain
The workshop generated specific feedback on the ‘collection’ phase of the proposed open data value chain. Representatives challenged the description of data as simply ‘pre-existing’, noting that this terminology risks understating the significant resources and activities required to make internal data suitable for publication.
It was clarified that ‘pre-existing’ refers to the principle within the Open Data Directive that public bodies are not obliged to collect data expressly for the purpose of opening it; rather, they open data that is already collected for the performance of public tasks. However, the framework explicitly accounts for the technical burden of preparing this data through the subsequent value chain steps of ‘processing for opening’ and ‘governance’. This distinction is vital for accurately capturing the costs and efforts borne by data publishers.
The value of the portal as enabling infrastructure
A distinct challenge raised by Member States concerned the need to justify the specific financial investment in national open data portals. These portals represent significant digital infrastructure projects with ongoing operational costs. Participants highlighted the difficulty in communicating the value of this ‘enabling expenditure’ separately from the value of the data itself.
The discussion emphasised that while the ultimate economic and social impact is derived from the reuse of data, the portal provides the essential service of reducing transaction costs, ensuring discoverability and guaranteeing metadata quality. Consequently, the framework was validated as being useful for distinguishing between these two layers of value: providing specific output indicators (such as search success rates and API performance) that justify the infrastructure investment, while separate impact indicators capture the downstream benefits of the data.
5. Preliminary results (open data impact in the EU)
This chapter presents the results of the pilot conducted to test the proposed framework for measuring open data impact. The prioritised indicators introduced in Chapter 3 were tested in a selected group of Member States – Estonia, Italy, the Netherlands and Poland – to assess the practical applicability of the framework and to generate initial empirical insights into open data impact. The chapter is structured around the two core components of the framework. First, it presents the results for the foundational output indicators (Section 5.1), which assess the functioning and maturity of the open data ecosystem across the open data value chain. Second, it presents the results for the thematic impact indicators (Section 5.2), which generate estimates of the economic, social, environmental and strategic effects associated with the reuse of open data. Together, these results illustrate how the framework can be applied in practice and highlight both emerging patterns and remaining methodological challenges.
5.1. Foundational output indicators
The foundational output indicators provide insight into how effectively national open data ecosystems are functioning in practice. By examining publication volume and growth (Section 5.1.1), HVD publication (Section 5.1.2), metadata quality (Section 5.1.3), volume and thematic distribution of reuse cases (Section 5.1.4) and explicit dataset references and citations (Section 5.1.5), these indicators shed light on whether the core conditions for generating value are in place. Comparing results across the four pilot Member States provides a structured basis for assessing the robustness and practical applicability of the methodology across different national contexts, while helping to identify methodological strengths, limitations and areas for further refinement.
5.1.1. Publication volume and growth
Table 7 illustrates the publication volume and growth of open datasets across the four pilot Member States, drawing data from both national open data portals and data.europa.eu. For the national open data portals, the most recent publication volumes were retrieved directly from the portal websites, as these figures were consistently available for all Member States. Italy reported the highest number of published datasets (67 998), followed by the Netherlands (20 615), Poland (17 135) and Estonia (5 706). These figures provide an overview of the scale of dataset publication at the national level.
Publication growth could not be systematically assessed using national open data portals, as none of the portals provided publicly accessible historical data or time series enabling the calculation of growth over time. Following additional information requests submitted to the pilot Member States, publication growth data was obtained for Italy and Poland, which reported an increase of 8.64 % and 367.68 % respectively between December 2024 and December 2025. This highlights that information regarding the historical development of open dataset publications is sometimes available but not visible on the open data portals themselves. Further, this shows that open data publications can grow at a rapid pace in some Member States, as shown in Poland’s exceptionally high growth rate.
Data from data.europa.eu provides complementary insights into both publication volume and growth. The publication volumes reported at data.europa.eu broadly align with national figures; however, as data.europa.eu displays the national portal catalogues under their respective names, small differences can be observed for the pilot Member States, with a notably larger difference for Poland where the publication volume reported on data.europa.eu (10 017) is substantially lower than that reported on the national open data portal (17 135). While publication volumes can therefore be compared at the portal level, historical data on publication growth is only available at the Member State level on data.europa.eu. As a result, it was possible to generate growth numbers, but these capture changes across all catalogues for a Member State, including the national open data portal and other catalogues such as geospatial or domain-specific portals. Using this aggregated view, positive publication growth was observed for all four Member States between January 2025 and January 2026, ranging from + 5.5 % in the Netherlands and + 92.4 % in Estonia. This provides an indicative measure of overall dataset publications over time, rather than changes to the national open data portal alone.
Overall, these findings indicate that publication volumes are easy to retrieve directly from open data portals, while publication growth is generally not presented on the portals and can only be obtained through requests submitted to the Member States. The differences between data.europa.eu and national open data portals also reveal inconsistencies in publication volume numbers. At the same time, data.europa.eu provides aggregated Member-State-level insights into publication growth across all Member States.
Additionally, these results imply that the basic precondition for open data impact (the large-scale availability of datasets) is in place across diverse Member States. High publication volumes combined with prosperous growth indicate that governments are continuously expanding the data upon which innovation, data-driven services, environmental research and transparency initiatives depend. This means that limitations in open data impact in the EU are increasingly unlikely to stem from a lack of data supply, but rather from how effectively this data is made useable and reused. Thus, the scale of publication and accompanying growth numbers suggest that the potential economic, social, environmental and strategic impact from open data is present and growing over time.
Table 6. Publication volume and growth per Member State
| Member State | National portal website | National portal publication volume[4] | National portal publication growth | data.europa.eu publication volume[5] | data.europa.eu publication growth[6] |
|---|---|---|---|---|---|
| Estonia | https://andmed.eesti.ee | 5 706 | Not available | 5 582 | + 92.4 % |
| Italy | https://www.dati.gov.it | 67 998 | +8.64 %[7] | 64 482 | + 11.7 % |
| Netherlands | https://data.overheid.nl | 20 615 | Not available | 19 914 | + 5.5 % |
| Poland | https://dane.gov.pl | 17 135 | 367 68 %[8] | 10 017 | + 34.5 % |
5.1.2. High-value dataset publication rate
The HVD publication rate is based on the official reporting of HVDs by Member States as of February 2025. The data was collected directly from pilot Member States through reporting files and follow-up exchanges.
For each Member State, the total number of mandated HVDs is derived from the HVD Implementing Regulation, which defines a fixed set of HVDs across different thematic areas (e.g. geospatial, statistics, mobility). These mandated HVDs represent the expected datasets to be made available, regardless of how many individual datasets are used to fulfil them.
The number of mandated HVDs published is determined by assessing whether a Member State provides data corresponding to each required HVD. In practice, a single mandated HVD may be fulfilled using multiple datasets (e.g. regional datasets covering parts of a country), which together represent one nationally available HVD. As such, the indicator reflects coverage of mandated HVDs, rather than the total number of datasets published.
Table 8 illustrates that reporting on HVD publication is incomplete, with no data submitted by the Netherlands or Poland, resulting in missing values for these Member States. For Estonia and Italy, the reported figures provide insight into the extent to which mandated HVDs have been published in line with the HVD Implementing Regulation. While the Estonian results indicate a high level of coverage relative to the total number of expected HVDs, the Italian results show that less than half of the mandated HVDs have been published.
As such, where reporting information is available, this indicator provides valuable insights into the extent to which Member States provide data corresponding to the required HVDs and align with the requirements of the HVD Implementing Regulation. Taken together, these insights illustrate that the indicator functions sufficiently, but gaps in reporting across Member States limit the ability to fully compare publication rates across the EU.
As HVDs are defined as those with the highest reuse potential, the results directly indicate the extent to which Member States are making the most strategically important data available for impact creation. This means that progress on HVD publication can be interpreted as a proxy for the EU’s capacity to unlock the highest value from open data. The high coverage observed for Estonia suggests that key HVD areas, such as geospatial, mobility, meteorology and statistics, are largely accessible as open data.
Table 7. High-value dataset publication rate per Member State[9]
| Member State | Total number of mandated HVDs | Total number of mandated HVDs published | HVD publication rate |
|---|---|---|---|
| Estonia | 65 | 50 | 76.9 % |
| Italy | 63 | 30 | 47 6 % |
| Netherlands | Not available | Not available | Not available |
| Poland | Not available | Not available | Not available |
5.1.3. Metadata quality
Metadata quality was assessed using the MQA framework as implemented on data.europa.eu, which evaluates metadata against a consistent set of dimensions covering findability, accessibility, interoperability, reusability and contextuality. For each pilot Member State, MQA scores were retrieved directly from data.europa.eu, where the underlying scores are publicly available and calculated in a uniform manner across all catalogues[10]. The results shown in Table 9 indicate clear differences in metadata quality across the pilot Member States, with Italy achieving an ‘excellent’ MQA score, reflecting strong performance across all dimensions. Poland scores a ‘good’ score, while the Netherlands and Estonia record ‘sufficient’ scores. As the MQA framework is planned to be fully operational, regularly updated and consistently applied across Member States, this indicator does not present any big methodological limitations and can assumedly be readily used for future measurements.
These results show that the impact of open data is influenced not only by how much data is published, but also by how easily it can be found, accessed and integrated into any application. Higher metadata quality, as observed for Italy and Poland, directly lowers the technical and organisational barriers for companies, researchers and civil society to reuse datasets. Conversely, lower metadata quality can limit reuse even when large volumes of datasets are available. This implies that improvements in metadata quality can have a positive effect on the real-world impact of open data by turning published datasets into practically reusable assets.
Table 8. Metadata quality per Member State[11]
| Member State | MQA score | Findability | Accessibility | Interoperability | Reusability | Contextuality |
|---|---|---|---|---|---|---|
| Estonia | 199/405 | 67/100 | 47/100 | 40/110 | 30/75 | 15/20 |
| Italy | 372/405 | 100/100 | 77/100 | 101/110 | 74/75 | 20/20 |
| Netherlands | 199/405 | 45/100 | 45/100 | 54/110 | 50/75 | 5/20 |
| Poland | 252/405 | 79/100 | 61/100 | 67/110 | 30/75 | 15/20 |
5.1.4. Volume and thematic distribution of reuse cases
The indicator on volume and thematic distribution of reuse cases was assessed by listing the documented reuse cases on national open data portals of Estonia, the Netherlands and Poland. The Italian open data portal did not include a section on reuse cases and was therefore excluded from the pilot of this indicator. A reuse case is considered verified when (1) the use of open data is demonstrable; (2) the added value is created through transformation, analysis, visualisation, redistribution or application in a way that creates new insights, functionality or service deliverable; and (3) a retrievable link and identifiable creator are provided.
For Estonia, the audit covered 133 reuse cases drawn from the ‘usage stories’ section of the national portal[12]. These usage stories generally include a description, an application link and creator attribution. Direct references to the underlying datasets, however, were often missing. Representative examples include Eesti terviseradade kasutusstatistika and Eesti 3D kaksik, both of which present clear links and provenance. The thematic distribution across the verified set is 65 for social (48.9 %), 53 for environmental (39.8 %) and 15 for economic (11.3 %). Social cases are concentrated around public-service usability and civic information (e.g. city-service and mobility applications); environmental cases span geospatial and environmental governance topics (e.g. air quality, water status, geology and protected areas); and economic cases capture a smaller set of market/finance and planning tools. However, the current list of reuse cases on the open data portal is far from complete. This was emphasised during interviews with a Estonian representative. The usage stories reflect only voluntary submissions and curated examples rather than a systematic registry of reuse. This means the documented set cannot be interpreted as representative of total reuse activity.
A total of 65 verified data stories were reviewed from the ‘Impact’ section on the national portal of the Netherlands. Each story satisfies the verification criteria defined in the toolkit[13]. The curated format of the Dutch portal consistently links back to underlying datasets in the catalogue (e.g. the ‘Data with impact’ and ‘Impact stories’ pages), while also giving space to the creators of the reuse case to explain the application. The thematic distribution across these stories is 38 for social (58.5 %), 15 for environmental (23.1 %) and 16 for economic (24.6 %). Social cases primarily address public-service usability, mobility and civic information. Examples include Ongevalrisico.nl (traffic safety insights), Zwemindex.nl (public swimming locations), municipal dashboards such as Zaanstad Cijfers and journalism-oriented tools like LocalFocus and Check de facts. Environmental cases reflect the energy transition and environmental monitoring, illustrated by Zonnedakje, Energieopwek.nl and Waterinfo (Rijkswaterstaat). Economic cases focus on market and business value creation, exemplified by Kamer van Koophandel (KVK) Regiodata, Prijzendashboard and Nieuwbouwmonitor. Yet, the overview is not up to date. The impact stories have not been structurally updated since 2022, and interviews with Dutch representatives confirm that the impact section on the national portal is not a representative set of reuse cases of open data in the Netherlands.
The assessment covered 91 reuse cases drawn from the Polish showcase section of the data portal[14]. Based on the total list of these reuse cases, the thematic distribution is 60 for social (65.9 %), 17 for environmental (18.7 %) and 14 for economic (15.4 %). Social cases are concentrated in public-service and mobility use (e.g. Jakdojade, Moja Komenda, MSIP Kraków); environmental cases span geospatial and environmental governance (e.g. national geoportal services and integrations of cadastral / land-use layers, Wody Polskie WMS, mBDL); and economic cases include business/market tools and finance transparency (e.g. Bizraport, Prześwietl.pl, Biała Lista VAT). During interviews with the Polish representative, it was noted that the showcase primarily reflects public sector-oriented reuse and does not capture a lot of private sector reuse. As with the other Member States, the portal provides curated examples rather than a comprehensive overview.
From a methodological perspective, the pilot confirms that the indicator functions as intended. The verification criteria can be applied consistently, and reuse cases can be categorised thematically. However, the incompleteness of reuse documentation significantly limits the interpretability of the number of reuse cases and the thematic percentages given to the impact domains in this pilot. This means for the indicator to become more valuable in the future, it will be necessary that such reuse case documentation be regularly updated and expanded with new cases.
Overall, the number and nature of observed reuse cases illustrate where open data impact is currently most visible in society: public services, environmental governance, mobility, geospatial applications and innovative practices. This reflects where open data directly contributes to better services for citizens, improved environmental management and new digital applications. Although the documented cases on the open data portals are incomplete, they clearly demonstrate that open data is already being translated into tangible applications across several core societal areas. Also, the largest share of documented reuse cases fall within the social impact domain. While the reuse case documentation is clearly incomplete and should not be treated as a representative sample, this initial pattern nevertheless suggests that open data impact most visibly materialises where it directly affects citizens and public services.
5.1.5. Explicit dataset references and citations
The indicator on explicit dataset references and citations assesses the integration of national open data into scientific research, policy documents and software development. It serves as a verifiable proxy for high-value application. During the pilot, the practical measurement protocol was tested across the four participating Member States.
The assessment relied on a manual search strategy. Queries combining key dataset titles and publishing authority names were executed across academic databases, code repositories and policy archives. The pilot confirmed that data availability for this indicator is currently severely limited. National administrations do not systematically track external citations.
Across Estonia, Italy, the Netherlands and Poland, the manual search approach yielded fragmented results. Researchers and developers frequently mention the use of government data but rarely provide formal citations or direct links to national open data portals. This lack of standardised referencing makes it difficult to definitively link a published paper or software tool to a specific dataset. Generating a robust quantitative baseline was therefore not possible during this initial iteration.
These constraints align with the feedback gathered during the stakeholder engagement phase. Relying on manual search queries is resource-intensive and prone to significant undercounting. The pilot demonstrates that the current practical measurement protocol is insufficient for long-term monitoring. It highlights the necessity of transitioning to the comprehensive measurement protocol outlined in the toolkit.
To accurately capture the impact of open data on research and innovation, Member States should implement PIDs for their data assets. Assigning DOIs to high-value datasets is (in our opinion) a critical technical prerequisite. This step will enable automated tracking through global citation registries and provide a scalable measure of downstream data application.
Notes on tracking URLs in an academic research setting
Tracking national open data portal URLs (such as data.overheid.nl, dati.gov.it, andmed.eesti.ee or dane.gov.pl) through major academic databases and publishers (e.g. ScienceDirect, Springer, Wiley, Taylor & Francis) is technically possible. However, executing these targeted queries reveals several critical methodological insights that confirm the limitations of relying on manual search strategies for measuring impact.
These empirical findings strongly validate the framework’s recommendation. Tracking raw portal URLs through academic databases provides a severely undercounted and skewed picture of data application. It confirms that establishing the ‘idealised’ protocol (specifically the mandatory assignment of persistent DOIs to high-value datasets) is the only credible mechanism for tracking the true volume and thematic spread of open data reuse in the research ecosystem.
Based on an assessment of how these specific portal URLs appear in published scholarly articles, the following empirical insights emerge.
A. The distinction between ‘data as a source’ and ‘data as a subject’
When portal URLs like data.overheid.nl or dati.gov.it appear in academic literature, they are frequently cited in studies evaluating the open data ecosystem itself, rather than in domain-specific research using the data. For example, papers published in journals such as Library Hi Tech or the Journal of Cleaner Production cite these portals to assess metadata quality, interoperability standards or open government policies. While this demonstrates academic engagement with the portals, it does not capture the downstream economic or environmental research (e.g. climate modelling or traffic analysis) that relies on the actual datasets.
B. Primary publisher attribution obscures portal impact
The most significant finding from tracking these URLs is the prevalence of the ‘aggregator bypass’. Researchers consistently cite the primary data owner rather than the national portal. A researcher using Dutch demographic data will formally cite the Centraal Bureau voor de Statistiek and a researcher using Italian environmental data will cite the Istituto Nazionale di Statistica or the Istituto Superiore per la Protezione e la Ricerca Ambientale. Consequently, the national open data portals suffer a severe attribution deficit in formal bibliographies, meaning search queries for the portal URLs capture only a fraction of the actual data reuse.
C. Informal in-text referencing limits automated extraction
Where researchers do mention the national portals as the source of their data, the references are highly fragmented. Portal URLs are typically buried informally within the methodology section (e.g. ‘The data was retrieved from the national portal at data.overheid.nl’) rather than formatted as formal bibliographic citations. This informal referencing makes it practically impossible to track data usage systematically using standard bibliometric APIs (such as Crossref or Scopus) without highly sophisticated natural language processing and text mining.
Notes on tracking URLs in general media
The tracking the URLs of national open data portals (such as data.overheid.nl, dati.gov.it or dane.gov.pl) through major reputable media outlets and journalistic archives yields critical methodological insights. Executing the proposed practical measurement protocol for indicator Soc1 (reuse in media, civil society and research) against archives of major outlets (including Reuters, the Financial Times, NRC Handelsblad, Nederlandse Omroep Stichting, Corriere della Sera and La Repubblica) demonstrates that tracking direct portal URLs is highly ineffective for capturing journalistic reuse.
These real-world findings demonstrate that the practical protocol for indicator Soc1 requires immediate recalibration. Relying on search queries for portal URLs to measure media reuse will result in a severe underrepresentation of open data’s social impact.
To generate a credible measure of media reuse, Member States must pivot from tracking the portal to tracking the institutional publisher. The measurement protocol should instruct national authorities to utilise professional media monitoring services (e.g. Meltwater or LexisNexis) configured to track mentions of specific, high-impact data-producing agencies in conjunction with terms like ‘data analysis’ or ‘statistics.’ This is the only defensible method for capturing how open data informs public discourse without relying on absent URL citations.
The following empirical insights emerge from this tracking exercise.
D. The institutional attribution gap in journalism
Major media outlets do not cite the aggregating national open data portals. When journalists utilise open data for investigative reporting or data journalism, editorial standards dictate citing the primary institutional author. A financial journalist at Het Financieele Dagblad or NRC Handelsblad analysing corporate insolvency will cite the Centraal Bureau voor de Statistiek or the KvK, never data.overheid.nl. Similarly, Corriere della Sera attributes environmental or demographic data directly to the Istituto Nazionale di Statistica or the Istituto Superiore per la Protezione e la Ricerca Ambientale, not to dati.gov.it. Consequently, searching media archives for portal URLs returns a near-zero result rate, completely failing to capture the actual volume of data-driven journalism.
E. Narrative integration over formal referencing
Unlike academic publishing, journalism integrates data directly into the narrative. Findings are presented as statements of fact (‘according to recent government figures’ or ‘an analysis of state procurement records shows’) rather than accompanied by explicit hyperlinks or bibliographic metadata. This editorial practice renders automated or manual search strategies that rely on specific URL strings or dataset titles obsolete.
F. Portal mentions are restricted to policy reporting
In the rare instances where national portal URLs do appear in mainstream media archives, they are the subject of the reporting rather than the source of the data. Mentions are confined to articles discussing government transparency initiatives, digital policy launches or EU maturity rankings, rather than investigations built upon the datasets hosted within those portals.
5.2. Thematic impact indicators
While the foundational output indicators describe the functioning of open data ecosystems, the thematic impact indicators focus on what these activities ultimately deliver for society. This section offers an initial view of open data impact across Estonia, Italy, the Netherlands and Poland, by looking at employment (Section 5.2.1), GVA (Section 5.2.2), transparency and accountability (Section 5.2.3), environmental governance and research (Section 5.2.4) and digital sovereignty and strategic risk (Section 5.2.5). The results illustrate both the analytical potential of the framework and the key methodological challenges.
5.2.1. Employment levels
This indicator (Econ1 in the Member State Toolkit) is an estimate of the number of FTE jobs that are directly supported by the reuse of open data. While job creation is a primary objective of the European data strategy, measuring it requires isolating the specific contribution of open data from the broader data economy.
The proposal is for this indicator is calculated using the practical measurement protocol defined in the Member State Toolkit over the short to medium term. This method employs a model-based estimation that combines the total population of data workers with a specific ‘open data employment coefficient’. This coefficient represents the average percentage of a data professional’s time dedicated to working specifically with public open data, distinguishing general data analysis from open data reuse.
Preliminary EU-level estimation
To generate an initial EU-level estimation, this study leverages the baseline figures established by the European Data Market Study 2024–2026. According to the study, the total number of data professionals in the EU-27 reached 8.2 million in 2024, representing approximately 4.5 % of total employment.
Applying the measurement protocol to this baseline requires determining the relevant open data employment coefficient. Based on the employment structures observed in the Use Case Observatory (Volume III) (where reuse cases range from small, dedicated teams (100 % open data reliance) to large corporations using open data as a supplementary input (low percentage reliance)); a conservative weighted coefficient of 1.5 % to 2.0 % was applied for this pilot estimation.
- Total data professionals (EU-27, 2024): 8.23 million.
- Open data employment coefficient (conservative estimate): 1.5 %.
- Estimated open data FTEs: ~123 500.
- Total data professionals (EU27, 2024): 8.23 million.
- Open data employment coefficient (optimistic estimate): 2.0 %.
- Estimated open data FTEs: ~164 600.
This framework estimates that open data currently supports between 123 000 and 165 000 FTE jobs across the EU.
Derivation and justification of the open data employment coefficient
The coefficient range of 1.5 % to 2.0 % applied in this pilot is not arbitrary; it is derived from a triangulation of macroeconomic data regarding the European data market and micro-economic evidence from the Use Case Observatory. The logic for this estimation is provided below.
a. The ratio of open data to the total data economy
The European Data Market Study 2024–2026 estimates the total value of the data economy at approximately 4.4 % of EU gross domestic product (GDP). Historically, studies on the specific economic value of open data (e.g. by the OECD or the European Data Portal’s own analytical reports) suggest a direct GDP contribution ranging between 0.5 % and 1.0 %.
This suggests that the ‘open’ component represents roughly 11 % to 22 % of the total data economy’s economic value. However, employment intensity does not map 1:1 with value generation. Open data, being free at the point of use, often generates high value with leaner teams compared to proprietary data generation, which requires heavy commercial sales and procurement workforces. Consequently, a deflationary factor is applied to the value ratio, resulting in a conservative workforce estimate of approximately 1.5 % to 2 % of the total pool of data professionals.
b. The dominance of ‘mixed-use’ profiles in the labour market
The breakdown of data professionals in the European Data Market Study 2024–2026 identifies that the majority of data roles are embedded within non-tech industries (e.g. finance, manufacturing, retail). For these professionals, open data is rarely a singular focus but rather a supplementary input.
High-intensity users (100 % coefficient): this includes employees in ‘pure play’ open data intermediaries and civic tech firms (e.g. Open Food Facts, Integreat). As detailed in the Use Case Observatory, these organisations are typically small and medium-sized enterprises (SMEs) with teams of fewer than 50 people.
Low-intensity users (< 5 % coefficient): this includes data scientists in large enterprises (e.g. insurance or logistics) who may use open weather or geospatial data as one of dozens of inputs into a broader predictive model.
Given that the labour market is numerically dominated by large enterprises (low intensity) rather than boutique open data SMEs (high intensity), the weighted average coefficient shifts significantly towards the lower end of the spectrum.
c. Alignment with observed data maturity levels
The coefficient is further validated against the ODM assessment. The pilot Member States (e.g. Estonia, Italy, the Netherlands) consistently score high on ‘impact’ and ‘quality’ dimensions. However, the European Data Market Study 2024–2026 notes that the ‘intensity of data professionals’ (the number of pros per company) has remained relatively stable (12.8 in 2024). This indicates that while data usage is widening, it is not yet leading to a mass expansion of roles dedicated exclusively to external data sources.
Therefore, the 1.5 % lower bound represents a baseline where open data is a recognised but minor component of the average data professional’s workflow, while the 2.0 % upper bound assumes a higher degree of integration where open data becomes a critical dependency for core business processes in key sectors like transport and energy.
Analysis and interpretation
This estimation highlights that while open data reusers constitute a niche subset of the wider data workforce, they represent a significant economic force in absolute terms, comparable in size to the employment figures of specific mid-sized industrial sectors.
It is critical to interpret this figure as a measure of labour intensity rather than a headcount of individuals. As outlined in the toolkit’s rationale, many of these FTEs are distributed across roles that use open data as a key input for innovation and business creation, such as data scientists training AI models on public datasets or developers integrating real-time transport data into mobility apps. The robust link between open data availability and this derived demand for labour confirms the intervention logic: high-quality supply (as measured by Output Indicators 2.1 and 2.3) is a prerequisite for sustaining this specialised workforce.
Future iterations of this measurement will refine the ‘open data employment coefficient’ through the pan-European micro-survey proposed in the toolkit, allowing for disaggregation by sector (e.g. mobility, finance, health) to identify where open data is creating the most intense demand for skills.
Comparison with previous credible estimates
The estimation range of 123 000 to 165 000 FTEs represents a deliberate methodological refinement compared to earlier projections commissioned by the EU. Most notably, the Economic Impact of Open Data 2020 report forecasted that open data employment in the EU-27 would reach between 1.12 million and 1.97 million jobs by 2025[15].
The significant variance between these figures and the current calculation is driven by a shift in definition from ‘headcount’ to ‘FTE intensity’. Previous studies generally adopted a broad definition, counting any employee who interacted with open data as part of their role as an ‘open data worker’. For instance, a lawyer consulting a public case-law registry once a week or a logistics manager checking weather data would each be counted as a single job supported by open data. While valid for assessing broad reach, this approach tends to overestimate the specific economic dependence of the labour market on public data assets.
In contrast, the measurement protocol defined in this framework isolates the specific fraction of labour time attributable to open data. By applying a coefficient to the baseline of 8.2 million data professionals established by the European Data Market Study 2024–2026, this report corrects for the reality that for the majority of data professionals, open data acts as a supplementary input rather than the sole driver of employment. If the earlier projection of nearly 2 million jobs were measured as pure FTEs, it would imply that roughly 25 % of the entire European data workforce works exclusively on open data. Given the dominance of proprietary commercial data in the current economy, the revised estimate of 1.5 % to 2.0 % offers a more defensible baseline for direct economic attribution.
This conservative approach is also aligned with the HVD impact assessment.[16] That assessment emphasised that while the availability of high-value datasets would generate significant GVA (projected to increase by a lower bound of EUR 19.9 billion by 2030), the primary mechanism for this growth is efficiency gains and automation rather than mass employment. Consequently, a lower but highly specialised FTE figure is consistent with a policy objective focused on high-value, technology-intensive reuse rather than labour-intensive manual processing.
5.2.2. Gross value added
This indicator (Econ2 in the Member State Toolkit) estimates the portion of GVA within the (national) data economy that is attributable to the use of public open data. GVA serves as the primary measure of economic production, representing the value of goods and services produced minus the cost of intermediate inputs.
This indicator is calculated using the practical measurement protocol defined in the Member State Toolkit. This methodology mirrors the approach used for employment: it applies a specific ‘open data GVA coefficient’ to the broader financial baselines of the data economy. This ensures that the measurement of open data impact remains methodologically coherent with the Commission’s flagship economic monitoring.
Preliminary EU-level estimation
To provide an aggregate EU-level estimation, this study utilises the baseline established by the European Data Market Study 2024–2026, which estimates the total value of the EU-27 data economy in 2024 at EUR 579.2 billion. Applying the practical measurement protocol requires determining the share of this value derived specifically from open resources. Based on a forensic analysis of the HVD impact assessment,[17] this framework applies a baseline coefficient of 10 % (within a suggested reporting range of 8 % to 13 %).
- Total data economy value (EU-27, 2024): EUR 579.2 billion.
- Open data GVA coefficient (central estimate): 10.1 %.
- Estimated direct open data GVA: EUR 58.6 billion.
Derivation and justification of the open data GVA coefficient
The coefficient of 10.1 % is derived by anchoring the measurement in the Commission’s previous economic modelling for the reuse of PSI. The derivation uses the following three-step logic.
1. Establishing the PSI and HVD-related economy baseline
The impact assessment study on the list of HVDs modelled the economic value of the ‘PSI and HVD-related economy’. It is important to note that this is a specific modelling construct limited to six strategic thematic areas: geospatial, earth observation and environment, meteorological, statistics, companies and company ownership, and mobility. It does not represent the entire universe of PSI, but rather a boundary around economic activity enabled by reuse in these high-value domains. That study projected a baseline growth for this specific economy from EUR 184 billion in 2020 to EUR 255 billion in 2028. By interpolating this growth trajectory, we estimate a value of approximately EUR 216.6 billion for 2024.
2. Isolating the direct effect
The HVD impact assessment reports a ‘total effect’ composed of a direct effect and an indirect forward effect. The Member State Toolkit requires a direct GVA figure to ensure verifiability and avoid double counting. The impact assessment reports a 2028 direct effect for the preferred policy option of EUR 75 billion, noting this is an incremental EUR 6 billion over the baseline. This implies a 2028 baseline direct effect of EUR 69 billion. Comparing this to the total 2028 baseline (EUR 255 billion) indicates that the direct effect constitutes approximately 27 % of the total value. Applying this share to the 2024 projection (EUR 216.6 billion) yields a direct PSI value of approximately EUR 58.6 billion.
3. Calculating the coefficient against the data market
When comparing this direct PSI value (EUR 58.6 billion) against the total data economy measured by IDC (EUR 579.2 billion) in the most recent European Data Market Study 2024–2026, we derive a coefficient of 10.1 %. This coefficient confirms that the direct reuse of PSI in high-value domains accounts for approximately one-tenth of the total value generated by the European data economy. To reflect that the six thematic areas are not the full PSI universe (and the inherent uncertainty of model-based constructs) a reporting range of 8 % to 13 % is recommended.
Analysis and interpretation
This figure should be interpreted as an order-of-magnitude monitoring metric. It reflects economic activity enabled primarily by efficiency and innovation mechanisms. As highlighted in the European Data Market Study 2024–2026, the sectors growing fastest in the data economy are finance and information/communication. These coincide with the heaviest users of the six HVD thematic categories identified in the calculation (e.g. corporate registries for finance or geospatial data for logistics/transport). This correlation suggests that open data is a core input for the highest-growth sectors of the EU economy.
Future refinement: sectoral and national coefficients
While the 8–13 % coefficient provides a robust EU-wide baseline, future iterations of the framework must move towards higher granularity to support specific national policymaking. The current flat coefficient simplifies a complex reality where reuse intensity varies by industry and maturity. The following roadmap is proposed for refining this metric.
- Sectoral coefficients. The European Data Market Study 2024–2026 breaks down the data economy by sector (e.g. finance, manufacturing, agriculture). Future research should map the six HVD thematic categories against these sectors to create weighted coefficients. For example, the transport sector, which relies heavily on geospatial and mobility data, should likely carry a coefficient higher than 10 %, while manufacturing may carry a lower coefficient.
- National maturity weighting. Member States are at different stages of open data implementation. It is methodologically unsound to apply the same coefficient to a country with a low ODM score as to a global leader. Future iterations should apply a national weighting factor based on the ODM ‘impact’ and ‘data quality’ scores. Countries with high maturity would apply an upward adjustment to the EU average coefficient (e.g. 12–13 %), reflecting their higher capacity to convert data availability into economic value, while developing ecosystems would apply a lower bound (e.g. 8 %).
Distribution across Member States
The aggregate GVA figure provides a headline metric for the EU, but the European Data Market Study 2024–2026 confirms that the distribution of this value is highly concentrated. The economic benefits of open data reuse track the structural size and maturity of national data markets.
Analysis of the underlying market data reveals that the top five economies (Germany, Spain, France, Italy and the Netherlands) account for approximately 67.7 % of the total value of the EU data market. It is therefore statistically probable that the majority of the estimated EUR 59 billion in open data GVA is generated within these jurisdictions. This concentration reflects the reality that open data requires a thriving downstream ecosystem of technology companies and consultancies to transform raw datasets into economic value; where the general data market is the strongest, the capacity to reuse open data is the highest.
However, absolute volume does not capture the full strategic picture. The European Data Market Study 2024–2026 highlights that smaller economies often exhibit a higher relative intensity of data value. Member States such as Estonia, Ireland and Luxembourg consistently show higher growth rates and a larger share of the data economy relative to their GDP than the EU average. In these contexts, open data often plays a disproportionately large strategic role, serving as a core enabler for national digital services strategies (as seen in the high metadata quality scores for Estonia in Section 5.1.3). Therefore, while the absolute GVA of open data is highest in Germany or France, the relative economic dependence on open data may be significantly higher in these smaller, digitally advanced nations. This disparity underscores the necessity of the Member State Toolkit’s bottom-up measurement approach, which allows smaller states to demonstrate high-intensity impact that might otherwise be obscured in aggregate EU-level modelling.
Relationship to earlier EU estimates and wider research
Placing the current pilot estimate of EUR 59 billion into the wider landscape of economic research requires careful contextualisation. Over the past decade, various studies have produced estimates for the value of open data ranging from EUR 20 billion to over EUR 300 billion. These variances do not reflect a disagreement on the value of data, but rather fundamental differences in research boundaries, time periods and, most critically, impact concepts. Some studies report a narrow, accounting-style measure of value added (direct GVA). Others report a broader, economy-wide effect that aggregates direct, indirect and induced impacts. This framework explicitly selects a direct open data GVA construct. This choice is made to ensure the indicator is usable as a stable monitoring metric for Member States and to minimise the risk of double counting against other digital economy measures managed by the Commission.
The HVD impact assessment as a conceptual bridge
The most relevant comparison for this framework is the impact assessment accompanying the High-Value Datasets Implementing Regulation, prepared to support the implementing acts under the Open Data Directive.[18] This study provides a useful bridge between methodologies because it explicitly separates a direct economic effect from an indirect forward effect.
The assessment models the economic value of the ‘PSI and HVD-related economy’. It is important to clarify that this is not a formal industrial sector definition. Rather, it is a modelling boundary around economic activity enabled by the reuse of PSI within six specific thematic areas: geospatial, earth observation and environment, meteorological, statistics, companies and company ownership, and mobility. The study reports a baseline growth trajectory for this specific ‘PSI economy’ rising from EUR 184 billion in 2020 to EUR 255 billion in 2028 (EU-27). The impact assessment breaks down the total economic value into its component parts. For the year 2028, under the preferred policy package, it reports a direct effect of EUR 75 billion. It notes that this figure represents an incremental increase of EUR 6 billion over the autonomous baseline.
By subtracting the policy increment (EUR 6 billion) from the total direct effect (EUR 75 billion), we can derive that the baseline direct effect in 2028 is approximately EUR 69 billion. Comparing this EUR 69 billion direct baseline against the total economy baseline of EUR 255 billion reveals that the direct component accounts for approximately 27.1 % of the total economic value generated.
This split provides the practical rationale for the magnitude of our pilot estimate. It confirms that direct open data GVA should logically represent a minority share (roughly one quarter) of the broader open data economy figures often cited in headlines.
European Data Portal 2015 benchmark
The European Data Portal study Creating Value through Open Data (European Commission, 2015) remains the clearest Commission-linked reference point for a ‘direct-style’ measure similar to the one proposed in this framework. That study estimated a direct market size for open data in the EU-28+ of EUR 55.3 billion in 2016, projecting it to rise to EUR 75.7 billion by 2020.
Simultaneously, the same study reported a much larger total market size of between EUR 265 billion and EUR 286 billion for 2020. This explicitly reflected a broader impact concept that included indirect effects and cost savings. This historical distinction aligns with the choice made in the Member State Toolkit to focus on the direct, monitorable construct. It implies that direct open data GVA estimates in the ‘tens of billions’ are not anomalous; they are broadly consistent with the order of magnitude implied by the European Data Portal’s historical benchmarking, once allowances are made for the change in geographic coverage (EU-27 versus EU-28+) and the shift from forecast to realised value.
European Data Portal 2020 benchmark
The subsequent 2020 study, The Economic Impact of Open Data, estimated the open data market size at EUR 184 billion and forecast a range of EUR 199.5 billion to EUR 334.2 billion by 2025. These figures are materially higher than our pilot estimate because the 2020 work uses the widest possible market framing. It is an ‘open data economy’ aggregate that captures broader value creation channels, wider societal participation and induced effects (including employment effects of up to 1.97 million jobs). For reporting purposes, the 2020 market size should not be treated as a like-for-like comparator to a direct GVA indicator. Instead, it serves as an estimate of the total societal envelope of value, within which our direct GVA metric sits as the verifiable economic core.
The Organisation for Economic Co-operation and Development and the wider literature
The OECD synthesis on the economic and social benefits of data access and sharing cites older EU-wide PSI reuse market estimates of roughly EUR 28 billion in 2008 and EUR 32 billion in 2010, with aggregate indirect and induced impacts of around EUR 140 billion annually (roughly 1.5 % of GDP). While these estimates date from an earlier era of the data economy, they reinforce a consistent long-running pattern in the literature: direct market size estimates are typically far smaller (often by a factor of 4 or 5) than economy-wide impact estimates once indirect, induced and consumer surplus channels are included.
Implications for positioning the current EU estimate
A direct open data GVA estimate of approximately EUR 59 billion for the EU-27 in 2024 is robust. Derived as 10.1 % of the total data economy value (EUR 579.2 billion) in the European Data Market Study 2024–2026, this figure sits in a plausible range. It is below the expansive 2020 ‘open data economy’ figures but aligns closely with the 2015 ‘direct market size’ benchmark and the 2022 HVD impact assessment’s specific modelling of direct effects. This triangulation confirms that the indicator effectively isolates the specific economic contribution of open data reuse without succumbing to the risk of over-claiming impact through multiplier effects.
5.2.3. Transparency and accountability
Table 10 illustrates the pilot results for the transparency and accountability indicator, based on the assessment of five key accountability dataset categories for Estonia, Italy and the Netherlands. The assessment was conducted by reviewing the official national sources for each category and scoring the availability and quality of the data according to the 0–2 scale defined in the toolkit: the dataset is not available as open data (0); the dataset is available, but only in a low-quality format (1); and the dataset is available as high-quality, structured, machine-readable open data and offers bulk download (2).
Estonia achieves a total score of 9/10, demonstrating that nearly all accountability datasets are available as high-quality open data. Public procurement data is provided through the national public procurement register as a searchable, machine-readable database disclosing tender and awarded contracts (2/2). Company and beneficial ownership information is openly searchable through the national business register (2/2). Political party and campaign finance disclosures are published in a structured and searchable format by the Political Party Financing Supervision Committee (2/2). Lobbying activity is recorded in a public register identifying interest representatives and the topics discussed (2/2). Asset and financial interest declarations of public officials are available but require authenticated login and are not provided as open datasets, resulting in a lower score (1/2).
Italy scores 6/10, reflecting that the relevant transparency and accountability data largely exists but is often provided in formats that limit reuse. Public procurement data is released by the National Anti-Corruption Authority via a searchable open data portal covering procedures, awards, suppliers and values in machine-readable form (2/2). Company and ownership information is accessible through the national business register via API and search-based downloads, but bulk download is not possible yet (1/2). Political party and campaign finance disclosures are published online through the parliament, primarily as web pages and PDFs rather than structured machine-readable datasets (1/2). Lobbying registers exist at the Chamber of Deputies and the Ministry of Enterprise, but data is not provided in structured, machine-readable formats and bulk download is not available (1/2). Asset declarations of public officials are published, though mainly as document-based disclosures rather than consolidated open datasets (1/2).
The Netherlands scores 5/10. Public procurement information is published through the TenderNed platform as a searchable and openly accessible database covering tenders, awards, suppliers and contract values (2/2). Detailed information about registered companies and their beneficial owners is searchable via the national business register (KvK), but detailed data requires marginal payments and is not available as a full open dataset (1/2). A national lobbyist register is not in place in the Netherlands, and lobbying information is therefore not available as an open dataset (0/2). Asset and financial interest disclosures exist through parliamentary and governmental registers but are fragmented and document-based rather than machine readable (1/2).
Taken together, the pilot confirms that the indicator functions well to produce a comparable assessment of how Member States provide key datasets that are essential for public scrutiny and accountability. The category-level scoring makes it explicit where transparency information exists but is not yet provided in reusable, machine-readable form, illustrating the gap between information availability and high-quality open data provision.
At the EU level, these results illustrate that while transparency-related information is widely available across Member States, it is not consistently provided in formats that enable large-scale reuse, analysis and public scrutiny. The variation in scores shows that the difference between ‘information being public’ and ‘information being open data’ remains substantial. This has important implications for democratic accountability within the EU, as the availability of high-quality open data directly affects the ability of journalists, civil society and researchers to analyse public spending, ownership structure, political financing and more. These preliminary results therefore highlight that improving the quality of open data with regard to transparency and accountability can strengthen societal impact by preventing corruption, ensuring integrity in public decision-making and increasing transparency of government. At the same time, the fact that this information is already widely availability already supports these social impacts in practice.
Table 9. Transparency and accountability per Member State
| Member State | Public contracts | Company and beneficial ownership register | Political party and campaign finance | Lobbyist register | Asset declarations of public officials | Total score |
|---|---|---|---|---|---|---|
| Estonia | 2/2[19] | 2/2[20] | 2/2[21] | 2/2[22] | 1/2[23] | 9/10 |
| Italy | 2/2[24] | 1/2[25] | 1/2[26] | 1/2[27] | 1/2[28] | 6/10 |
| Netherlands | 2/2[29] | 1/2[30] | 1/2[31] | 0/2 | 1/2[32] | 5/10 |
5.2.4. Environmental governance and research
Table 10 summarises the pilot results for the Core Environmental Governance Data Index, based on three legally mandated dataset categories: industrial emissions (pollutant release and transfer register), air-quality monitoring for key pollutants (e.g. PM2.5, NO2) and the Water Framework Directive (WFD) water-body status. For each category, official national sources were reviewed and scored according to the practical protocol of the toolkit: absence of open data or > 12 months delay (0); availability with delay or in low-quality / non-machine-readable form (1); and timely (6 months), machine-readable and granular data provision (2).
Estonia achieves a very strong overall result (6/6), reflecting high-quality and timely open data practices in environmental reporting. Industrial emissions data is made available through the national open data portal as company-and site-level annual reporting in reusable formats (CSV/XLXS/JSON), providing granular insight into industrial waste and emissions streams shortly after the reporting year (2/2). Air-quality information is similarly well supported through an INSPIRE-conformant open dataset that enables API-level access in a standardised and machine-readable way (2/2). For water quality, the WFD water-body status is published on the national Keskkonnaportaal in a machine-readable format and aligned to the reference period, satisfying the timeliness requirement (2/2).
Italy records a high score as well (5/6), demonstrating strong alignment between environmental reporting obligations and open data provision. Industrial emissions information is accessible through an interactive web map, offering granular and machine-readable access to emissions data (2/2). Air-quality monitoring data is published by the National System for Environmental Protection as pollutant-specific datasets (e.g. PM10 2024) in a machine-readable format (CSV) and meets the criteria for timeliness (2/2). For water quality, WFD water body statuses are accessible; however, dataset publication occurred more than six months after the reference year, meaning that while data is open and granular, it does not fully meet the timeliness aspect of the indicator (1/2).
The Netherlands scores 4/6, reflecting strong performance in environmental monitoring. The National Institute for Public Health and the Environment provides a portal for emissions data; however, complete validated publications become available between six and twelve months after the reporting year, limiting the timeliness for a full score (1/2). In contrast, the National Institute for Public Health and the Environment national air-quality monitoring network offers both publications of the data within the toolkit’s timeline and annual datasets via documented open data and API (2/2). For water quality, national Kaderrichtlijn Water (WFD) assessments are publicly accessible through the Compendium voor de Leefomgeving and ministerial portals, yet information is mainly presented through pages on the website rather than a consolidated machine-readable dataset (1/2).
Poland scores equally high (4/6), reflecting strong air-quality data provision but more limited practices for industrial emissions and water quality. Industrial emissions information is accessible through the national Chief Inspectorate for Environmental Protection portal, which provides facility-level data but does not offer the data within six months of the reference year (1/2). Air-quality monitoring is supported by a well-documented national API, meeting all requirements for timeliness, machine-readability and granularity (2/2). For water quality, WFD water-body status is published through the Chief Inspectorate for Environmental Protection portal, including machine-readable Web Map Service services and Water Body (Jednolita Część Wód) level classifications, but the publication of the data exceeded the six-month threshold (1/2).
Overall, the pilot demonstrates that the indicator effectively distinguishes between the availability of environmental information and the quality of its publication as open data. For future measurements, it may be considered whether the timeliness requirement for a full score should be adjusted from publication within six months to publication within twelve months after the reporting year. Such an extension would better reflect the diversity of reporting cycles across Member States, while still rewarding timely high-quality open data within a reasonable time frame.
From an EU perspective, these findings demonstrate that environmental reporting obligations in accordance with EU policies already generate high-quality datasets that are highly suitable for open data reuse. The variation is primarily driven not by the absence of the data, but by differences in timeliness. This suggests that the essential environmental data for monitoring and public oversight is already being produced, but the main opportunity lies in publishing open data in a timely manner so that information reflects recent conditions and remains relevant for reusers. Consequently, timely and high-quality publication of these datasets can enhance environmental impact. Emissions data, air-quality measurements and water-status information provide essential insights for monitoring pollution, identifying ecological risks and informing public health and environmental planning. When these datasets are published on time and in open, machine-readable formats, they become far more useful for analysts, policymakers and the public.
Table 10. Environmental governance and research per Member State
| Member State | Industrial emissions | Air quality | Water quality | Total score |
|---|---|---|---|---|
| Estonia | 2/2[33] | 2/2[34] | 2/2[35] | 6/6 |
| Italy | 2/2[36] | 2/2[37] | 1/2[38] | 5/6 |
| Netherlands | 1/2[39] | 2/2[40] | 1/2[41] | 4/6 |
| Poland | 1/2[42] | 2/2[43] | 1/2[44] | 4/6 |
5.2.5. Digital sovereignty and strategic risk
The indicator on digital sovereignty and strategic risk could not be assessed during the pilot. The indicator relies on two data inputs that were not available in the participating Member States: (1) geographic breakdowns of data consumption based on IP addresses (e.g. downloads and API calls from EU vs. non‑EU sources); and (2) the traffic‑log information required to identify concentrated large-scale harvesting by non‑EU actors. Member States reported that such information is either not collected or cannot be shared due to legal and privacy considerations, as IP addresses are classified as personal data under the General Data Protection Regulation. As a result, the practical measurement protocol could not be implemented, although the indicator conceptually aligns with the growing policy interest in digital sovereignty and external dependencies.
6. Conclusions
To conclude, this study presents a common EU approach for measuring the impact of open data. By doing so, it brings together conceptual foundations, practical measurement tools, co-creation with Member States and empirical testing to make a framework that is both analytically robust and operationally realistic for administrations.
Firstly, the study introduced a methodology that can serve as a harmonised way for Member States to measure the impact of open data in a consistent and comparable manner. The framework is built around two core concepts that together form the backbone of its structure: the open data value chain and the results-chain logic of outputs, outcomes and impacts. Using these two concepts as its foundation, the framework is organised into two interconnected parts. The first consists of the foundational output indicators, which assess how the open data ecosystem functions across the four stages of the value chain (collection, publication, uptake, application). These indicators capture the essential conditions that must be in place before effective reuse and subsequent impact can show up. The second part consists of the thematic impact indicators, which examine the broader effects of reuse across four impact dimensions (economic, social, environmental, strategic). These indicators focus on how open data contributes to society and (connected) policy goals.
The indicators presented in this full framework outline a long-term vision for measuring open data impact. In the Member State Toolkit attached to this study, all indicators are explained and operationalised for measurements that can already happen in the short term, and the toolkit serves as a guideline for how the measurement of these indicators should evolve in the future. However, not all indicators can yet be calculated directly in a consistent and reliable way across all Member States due to insufficient data availability and differences in the maturity of open data ecosystems across the EU. For this reason, this study prioritised the most important and feasible indicators that still fully capture all key dimensions of the framework. These indicators were subsequently piloted in a group of Member States to test their applicability and analytical value. The prioritised set of indicators includes the foundational output indicators: publication volume and growth; HVD publication rate; metadata quality; volume and thematic distribution of reuse cases; and explicit dataset reference and citations. In addition, the following impact indicators were prioritised: employment; GVA; transparency and accountability; timeliness and quality of core environmental reporting; and digital sovereignty and strategic risk.
Throughout the development of this framework, Member States were actively engaged to ensure that the methodology is both meaningful and feasible. Engagement took place through three channels: a survey, a series of in-depth interviews and a workshop. The survey gathered initial reactions on the logic, complexity and relevance of the framework. This was followed by in-depth interviews, which provided more detailed reflections on the methodology and data availability. The workshop in Tallinn then offered an opportunity for broader discussion with representatives from all Member States, focusing on strategic alignment with existing EU instruments, the evolving role of open data and the operational realities that Member States would face in implementing the framework. Overall, this involvement confirmed broad support for the overall direction of the methodology while also highlighting the need for clear guidance, practical tools and coherence with existing EU monitoring tools.
6.1. The operational viability of the framework
The pilot confirms that a standardised EU-wide measurement of open data impact is operationally viable, provided a distinction is made between ‘practical’ and ‘comprehensive’ measurement protocols. Evidence from the pilot demonstrates that foundational output indicators (such as metadata quality and publication volumes) are already mature and can be measured consistently using existing infrastructure (e.g. MQA scores). Similarly, the social and environmental impact indicators proved robust during testing. The methodology of auditing specific HVDs (e.g. for environmental reporting or public procurement) successfully differentiated performance between Member States, capturing nuances in data timeliness and usability that purely quantitative metrics miss.
The pilot results underscore that a more granular understanding of reuse and reusers is the primary dependency for the entire framework. Because impact is fundamentally a downstream consequence of data application, the current reliance on voluntary and non-representative repositories limits the accuracy of all subsequent impact indicators. For instance, the model-based estimates for employment and GVA are directly constrained by the completeness of the known population of data-reusing firms. Moving beyond simple download counts to identify specific user profiles, such as distinguishing between commercial developers, academic researchers and public sector analysts, is essential for attributing societal change to specific datasets. Standardising the definition of a reuse case and incentivising its systematic reporting must therefore be a priority. Without this granular visibility, the causal link between open data publication and its eventual strategic benefit remains speculative rather than empirical.
However, the pilot also exposed specific constraints regarding data availability. The strategic indicator on digital sovereignty could not be calculated due to privacy restrictions on IP address data, while the reuse case indicator revealed that national repositories (e.g. in Estonia and the Netherlands ) remain incomplete and non-representative. This confirms the feedback from the PSI Expert Group in Chapter 4, where respondents ranked reuse-tracking as a low-feasibility area. Consequently, while the framework is viable, specific indicators require further technical development before they can be deployed at scale.
6.2. The need for a common European approach
The research and pilot results demonstrate that the current absence of a harmonised methodology creates a significant evidentiary gap for European data policy. As identified in the literature review and stakeholder interviews, the existing landscape of impact assessment is characterised by fragmentation. Member States currently rely on a disparate mix of ad hoc thematic studies, isolated case studies and inconsistent quantitative proxies. This lack of standardisation prevents the European Commission from aggregating results at the EU level and makes cross-border benchmarking impossible. The pilot results in Chapter 5 highlight this inconsistency clearly; while some Member States could provide granular historical data on publication growth, others lacked the basic longitudinal records required to calculate such a metric. A common framework provides the necessary shared definitions and measurement ‘recipes’ to ensure that impact is assessed against a uniform baseline across all jurisdictions.
Stakeholder engagement revealed a complex attitude toward a new EU-level framework. While survey respondents initially reported a low perceived relevance for a coordinated approach, with an average score of 1.36 out of 5, in-depth interviews clarified that this was primarily a reaction to the potential administrative burden rather than a rejection of the concept. When explored qualitatively, representatives from the PSI Expert Group expressed a strong desire for a methodology that moves beyond ‘reporting for reporting’s sake’ and instead provides robust, defensible evidence to justify the substantial financial investment required for national data portals. There is a clear mandate for a framework that provides ‘quick wins’ through practical protocols while setting a long-term technical roadmap for more ambitious measurement.
A primary driver for a common approach is the necessary evolution of the ODM assessment. Currently, the ‘impact’ dimension of the ODM assessment relies heavily on qualitative indicators and self-reported examples of reuse, which measure the ‘readiness’ of a country to generate impact rather than the actual socioeconomic effects realised. The framework proposed in this study offers a methodological pathway to transform this dimension. By integrating the thematic impact indicators developed here (such as monetised GVA estimates and verified citation counts), the ODM assessment can evolve from a maturity benchmark into a performance-based assessment. And Member States have largely signalled they are ready for this change. Workshop participants in Tallinn explicitly noted that the ODM assessment should eventually incorporate these more rigorous, evidence-led metrics to reduce duplicative reporting and provide a more accurate reflection of the return on investment in open data infrastructure.
A unified approach is required to address the blurring lines between open data and wider data sharing initiatives under the Data Governance Act or the Data Act. As public administrations begin to manage broader data ecosystems, including shared data spaces, they require a consistent logic model to track value creation. A common European framework ensures that, as these ecosystems evolve, the methodology for measuring impact remains coherent and integrated with the Commission’s flagship monitoring tools. This coherence is essential for identifying which sectors, such as transport or healthcare, are yielding the highest societal returns, allowing both the Commission and Member States to direct resources toward the data assets with the greatest strategic potential.
6.3. The necessity of an iterative implementation
The framework must be viewed as a trajectory rather than a static instrument. Chapter 4 highlighted that resource constraints and methodological complexity are the primary barriers to implementation for national administrations. Simultaneously, the pilot in Chapter 5 showed that while ‘comprehensive’ automated measurement (e.g. via PIDs) is technically superior, it is not yet widely implementable.
Therefore, the framework is designed to evolve. The practical protocols allow Member States to report credible estimates immediately (using model-based approaches for GVA and employment) while the ecosystem matures. As identified in the workshops, the transition to comprehensive protocols will require central support from the Commission, particularly regarding the automation of reuse tracking and the harmonisation of reuse definitions.
6.4. Strategic value and policy steering
The framework successfully operationalises the open data value chain, providing a clear narrative of how data supply translates into societal value. By separating output indicators (which measure the efficiency of the portal infrastructure) from impact indicators (which measure downstream benefits), the framework helps policymakers distinguish between technical performance and actual societal return.
The preliminary results suggest that open data is already a critical enabler for high-priority policy areas, including the European Green Deal and the digital transition. For instance, the environmental indicators in the pilot revealed that while data availability is high, timeliness remains a bottleneck for impact. By monitoring these specific attributes, the framework empowers the Commission and Member States to move beyond compliance and direct their efforts toward the specific data assets and quality dimensions that yield the highest strategic return.
7. Recommendations
The following recommendations are intended to provide a pragmatic path forward for the Commission and Member States. They prioritise the use of existing data sources and voluntary alignment to minimise additional administrative requirements while gradually improving the evidence base for open data impact.
7.1. General policy and implementation recommendations
The Commission should explore the gradual integration of the impact indicators developed in this study into the existing ODM assessment. Rather than creating a separate reporting obligation, the Commission could refine the impact dimension of the ODM assessment to incorporate more performance-based metrics over time. To ensure this does not increase the workload for national coordinators, a biennual cycle for the more complex impact indicators could be considered. This would allow for a longer period for data to mature between reporting exercises while maintaining a clear longitudinal baseline for the EU.
Member States are encouraged to enhance the visibility of reuse on their national portals through streamlined, voluntary reporting mechanisms. The pilot results indicate that a better understanding of reusers is essential for accurate impact assessment, yet current repositories remain non-representative. National authorities could consider implementing low-friction feedback tools or periodic engagement with high-impact sectors to better identify user profiles. Focusing efforts on documenting reuse within specific HVD categories would provide a more manageable and targeted evidence base than attempting a comprehensive registry of all data applications.
To improve the automated tracking of data impact in research and policy, Member States might consider the selective use of PIDs, such as DOIs, for their most significant datasets. A targeted application of these identifiers to HVDs would provide a cost-effective way to monitor citations in academic and technical literature. This approach offers a technical alternative to manual searching and provides a verifiable signal of impact without requiring extensive new reporting from data publishers.
Member States interested in generating more precise economic impact figures should consider fostering closer alignment between open data coordinators and national statistical offices. Where feasible, the inclusion of a limited number of targeted questions in existing business or labour-force surveys represents a low-burden method for gathering representative data on open data dependency. By piggybacking on established statistical processes, national administrations can move toward the comprehensive measurement protocols defined in the toolkit without the need for resource-intensive standalone surveys.
7.2. Recommendations for future research
Future research should focus on refining the framework through wider testing across a broader range of Member States. This would help to validate the initial EU-level coefficients used for estimating employment and gross value added, ensuring they remain relevant as the European data economy evolves. Engaging the wider research community in a peer review of these intervention logics would further strengthen the credibility and transparency of the model-based estimates.
Specialised study is also required to address the indicators that proved difficult to implement during the pilot. In particular, researchers should explore privacy-preserving alternatives for measuring digital sovereignty that do not rely on the collection of personal data or IP addresses. Additionally, as the implementation of the Data Act progresses, research should investigate how this impact framework can be adapted to measure value creation in shared data spaces and other emerging forms of data reuse.
7.3. Specific recommendations for toolkit implementation
The practical application of the measurement framework depends on a clear division of labour between the Commission and national authorities. To ensure that the methodology remains operationally feasible while producing robust results, the following specific technical actions are recommended.
The Commission should undertake the central research required to establish the open data employment coefficient (indicator Econ1) and the sectoral open data GVA coefficient (indicator Econ2). These coefficients are the primary variables for the model-based estimation of economic impact. By conducting a periodic, pan-European micro-survey of a representative sample of reusers, the Commission can establish credible dependency ratios at the EU level. This centralisation removes the need for Member States to conduct separate, resource intensive econometric studies and guarantees that the resulting national estimates are methodologically aligned and comparable across the EU.
National authorities should leverage existing automated tools for reporting on Indicator 2.3 (metadata quality) and Indicator 2.4 (technical accessibility and reusability). The MQA dashboard on data.europa.eu already provides these scores in a standardised format. By monitoring these existing metrics rather than developing internal assessment tools, Member States can fulfil the foundational reporting requirements with minimal administrative overhead. This approach uses established Commission infrastructure to provide a real time diagnostic of the technical health of the national open data supply.
To operationalise Indicator 3.2 (API consumption rate) and Indicator 4.1 (volume and thematic distribution of reuse cases), the Commission should provide standardised, voluntary reporting templates. These templates will simplify the collection of data from various public sector bodies by providing clear schemas for API call logs and reuse case metadata. Member States should encourage their national portal operators to adopt these common formats for their public showcases. Initially focusing these efforts on the most frequently used HVDs will ensure the task remains proportionate while building a more representative evidence base for data uptake.
Regarding Indicator 4.2 (explicit dataset references and citations), the Commission and Member States should explore a phased implementation of PIDs. While the practical protocol relies on manual search strategies, the transition to the comprehensive protocol requires the systematic use of DOIs. The Commission should provide technical guidance on the integration of these identifiers into national catalogues. This step is a prerequisite for the eventual automation of citation tracking and will significantly improve the long term visibility of open data’s impact on research and policy development.
Finally, for the social and environmental impact indicators (Indicators Soc1 to Soc5 and Env1 to Env4), national coordinators should prioritise the targeted audit approach defined in the toolkit. Rather than attempting a comprehensive census of all data applications, authorities should focus on a curated set of accountability and environmental governance datasets. This categorical scoring method allows Member States to demonstrate the specific societal value of open data in areas such as public procurement and air quality monitoring while keeping the data collection process manageable for national administrations.
References
Alderete, M. V. (2020), ‘Towards measuring the economic impact of open data by innovating and doing business’, International Journal of Innovation and Technology Management, Vol. 17, No 3, pp. 1–20, https://doi.org/10.1142/S0219877020500224.
Cattaneo, G., Micheletti, G., Glennon, M., La Croce, C. and Mitta, C. (2020), The European Data Market Monitoring Tool – Key facts & figures, first policy conclusions, data landscape and quantified stories – D2.9 final study report, Publications Office of the European Union, Luxembourg, https://op.europa.eu/en/publication-detail/-/publication/9fb0599f-c18f-11ea-b3a4-01aa75ed71a1.
Curry, E. (2016), ‘The big data value chain: Definitions, concepts and theoretical approaches’, in: Cavanillas, J., Curry, E. and Wahlster, W. (eds), New Horizons for a Data-Driven Economy, Springer, Cham, pp. 29–37, https://doi.org/10.1007/978-3-319-21569-3_3.
Dekkers, M., Polman, F., te Velde, R. and de Vries, M. (2006), MEPSIR – Measuring European Public Sector Information Resources – Final report of study on exploitation of public sector information – Benchmarking of EU framework conditions, https://www.researchgate.net/publication/297032105_Measuring_European_Public_Sector_Information_Resources.
Deloitte (2021), Conducting an open data impact study in Cyprus and developing its measurement methodology: Report on the impact of open data in Cyprus.
DemosEuropa, Warsaw Institute for Economic Studies, Buchholtz, S., Bukowski, M. and Sniegocki, A. (2014), ‘Big and open data in Europe: A growth engine or a missed opportunity?’ https://www.researchgate.net/publication/296282674_Big_and_open_data_in_Europe_A_growth_engine_or_a_missed_opportunity#full-text.
European Commission (2021), ‘Better regulation: Guidelines and toolbox’, European Commission website, https://commission.europa.eu/law/law-making-process/better-regulation/better-regulation-guidelines-and-toolbox_en.
European Commission: Directorate-General for Communications Networks, Content and Technology, Capgemini, Spark Legal, Open Evidence, Gardner, H. et al. (2025), Study supporting the evaluation of the free flow of non-personal data regulation, open data directive and data governance act – Final report, Publications Office of the European Union, Luxembourg, https://data.europa.eu/doi/10.2759/8620781.
European Commission: Directorate-General for Communications Networks, Content and Technology, Capgemini, Page, M., Behrooz, A. and Moro, M. (2024a), 2024 Open Data Maturity Report, Publications Office of the European Union, Luxembourg, https://doi.org/10.2830/8656811.
European Commission: Directorate-General for Communications Networks, Content and Technology, de Bas, P. and Page, M. (2024b), Indicators for an Open Data Impact Assessment, Publications Office of the European Union, Luxembourg, https://data.europa.eu/sites/default/files/report/Indicators%20for%20an%20open%20data%20impact%20assessment.pdf.
European Commission: Directorate-General for Communications Networks, Content and Technology, van Ooijen, C., Osimo, D., Regeczi, D., Simperl, E. et al. (2023), Rethinking the Impact of Open Data – A first step towards a European impact assessment for open data, Publications Office of the European Union, Luxembourg, https://data.europa.eu/sites/default/files/report/Rethinking%C2%A0%20impact%C2%A0%20of%C2%A0%20open%C2%A0%20data.pdf.
European Commission: Directorate-General for the Information Society and Media, Carrara, W., Chan, W. S., Fischer, S. and van Steenbergen, E. (2015), Creating Value through Open Data – A study on the impact of re-use of public data resources, Publications Office of the European Union, Luxembourg, https://op.europa.eu/en/publication-detail/-/publication/51ec011a-e13b-11e6-ad7c-01aa75ed71a1.
European Commission, Directorate-General for the Information Society and Media, Pira International Ltd, University of East Anglia and KnowledgeView Ltd (2000), Commercial Exploitation of Europe’s Public Sector Information – Executive summary, Publications Office, Luxembourg, https://op.europa.eu/en/publication-detail/-/publication/26571436-9097-447e-aed4-1b8522aaf153/language-en.
Faroukhi, A. Z., El Alaoui, I., Gahi, Y. and Amine, A. (2020), ‘Big data monetization throughout big data value chain: A comprehensive review’, Journal of Big Data, Vol. 7, No 3, 8 January, https://link.springer.com/article/10.1186/s40537-019-0281-5.
IDC, The Lisbon Council and Carsa (2025), The European Data Market study 2024–2026 – D2.1 first report on facts and figures, EDM_2024__2026__First_Report_on_Facts_and_Figures_9cU0iIjcuSZhjmwI9TchwqenidQ_114043.pdf.
Intrac (2024), ‘Outputs, outcomes and impact’, https://www.intrac.org/app/uploads/2024/12/Outputs-outcomes-and-impact.pdf.
Huyer, E. and van Knippenberg, L. (2020), The Economic Impact of Open Data – Opportunities for value creation in Europe, Publications Office of the European Union, Luxembourg, https://op.europa.eu/en/publication-detail/-/publication/1021d8a7-5782-11ea-8b81-01aa75ed71a1.
Jetzek, T., Avital, M. and Bjørn-Andersen, N. (2013), ‘Generating value from open government data’, in: Baskerville, R. and Chau, M. (eds), Proceedings of the 34th International Conference on Information Systems (ICIS 2013): Reshaping Society Through Information Systems Design, Association for Information Systems, pp. 1–20, https://aisel.aisnet.org/icis2013/proceedings/GeneralISTopics/5.
Lateral Economics, Omidyar Network, Gruen, N. and Tooth, R. (2014), Open for Business: How open data can help achieve the G20 growth target, https://www.academia.edu/35698222/Open_for_Business_How_Open_Data_Can_Help_Achieve_the_G20_Growth_Target.
McKinsey Global Institute, Manyika, J., Chui, M., Farrell, D., Van Kuiken, S. et al. (2013), Open Data: Unlocking innovation and performance with liquid information, https://www.mckinsey.com/capabilities/tech-and-ai/our-insights/open-data-unlocking-innovation-and-performance-with-liquid-information.
OECD (2020), ‘Open, useful and re-usable data (OURdata) index: 2019’, OECD Public Governance Policy Papers, No 1, OECD Publishing, Paris, https://doi.org/10.1787/45f6de2d-en.
OECD (2022), Glossary of key terms in evaluation and results-based management, Second edition, OECD Publishing, Paris, https://doi.org/10.1787/632da462-en-fr-es.
Open Data Watch (2018), ‘The data value chain: Moving from production to impact’, https://opendatawatch.com/wp-content/uploads/2018/03/Data_Value_Chain-WR-1803126.pdf.
Porter, M. E. (1985), The Competitive Advantage: Creating and sustaining superior performance, Free Press, New York.
Verhulst, S. G. and Young, A. (2017), Open Data in Developing Economies – Toward building an evidence base on what works and how, African Minds, Cape Town, https://www.africanminds.co.za/open-data-in-developing-economies-toward-building-an-evidence-base-on-what-works-and-how/.
Vickery, G. (2011), Review of recent studies on public sector information re-use and related market developments, Information Economics, https://www.researchgate.net/publication/265573154_Review_of_Recent_Studies_on_PSI_Re-Use_and_Related_Market_Development.
Welle Donker, F.M., van Loenen, B. and Korthals Altes, W.K. (2017), Maatschappelijke kosten-batenanalyse open data, Delft University of Technology. https://research.tudelft.nl/en/publications/maatschappelijke-kosten-batenanalyse-open-data/
World Wide Web Foundation (2017), Open Data Barometer – Global report – Fourth edition, World Wide Web Foundation, https://opendatabarometer.org/4thedition/report/.
Washington, A. L. (2014), ‘Uncertain risk: Assessing open data signals’, in: Proceedings of the 35th International Conference on Information Systems (ICIS 2014): Building a Better World Through Information Systems, Association for Information Systems, pp. 1–12, https://doi.org/10.1108/TG-09-2019-0086.
Appendix: Member State Toolkit for Measuring Open Data Impact
This toolkit provides Member States with practical instructions for measuring the impact of their open data programmes. It is designed for policy leads, national statistical offices (NSOs) and portal teams that require a ready-to-implement solution. It is intended to be modular (Member States can, of course, choose to calculate only those indicators that matter the most to them). The framework translates the core principles of the European data strategy and the better regulation guidelines into a set of precise indicators and low-burden (at least in the first iteration) measurement protocols. Its primary purpose is to enable consistent, comparable and credible reporting on how the publication of open data contributes to tangible economic, social, environmental and strategic outcomes in Member States across the European Union.
The framework is built upon three core design principles. The first is practicality: the measurement protocols prioritise the use of existing administrative and commercial data sources, avoiding wherever possible the need for new, resource-intensive EU or national surveys (although they might be required over the longer term). The second is coherence: the indicators are explicitly aligned with the methodologies of the European Data Market Study and the Open Data Maturity Report (‘ODM report’), ensuring that this framework serves as a consistent component of the European Commission’s wider data economy monitoring. The third is proportionality: for each indicator, a practical protocol provides a reliable, low-burden starting point for all Member States, while an extended protocol outlines a path towards more statistically robust methods as national capabilities mature.
The toolkit is structured like a menu of indicator ‘recipes’, organised to follow the open data value chain from initial supply to final impact. For each indicator, the corresponding recipe defines its intent and rationale, describes its specific causal pathway, provides detailed practical and extended measurement protocols and offers guidance on analysis and interpretation. Member State teams should begin by establishing a baseline using the practical protocols. This will provide an immediate, evidence-based assessment of their national open data ecosystem and form the basis for the first annual cycle of impact reporting.
The set of possible indicators is provided below.
Output indicators
The output indicators form the foundation of the measurement framework. They do not measure the final impacts of open data, but rather the essential preconditions for those impacts to occur. They provide direct, operational metrics on the health, maturity and activity of the open data ecosystem itself, covering the ‘supply’ and ‘uptake’ stages of the value chain. These indicators assess the strategic governance of data assets, the volume and quality of what is published and the extent to which that data is being discovered and consumed by potential reusers. They are the leading indicators of the entire system; a weakness identified here, such as poor metadata quality or low application programming interface (API) consumption, will inevitably inhibit the generation of downstream economic and social value. These metrics are therefore the primary diagnostic tools for national portal operators and policy coordinators, providing the actionable, real-time intelligence required to manage and improve the national open data infrastructure.
Indicator 1.1 (collection): strategic data governance and prioritisation
Intent and rationale
This indicator measures the extent to which a clear, publicly documented national strategy exists for governing, managing and prioritising the release of open data. A formal strategy is a foundational enabling factor for a sustainable and impactful open data ecosystem. Academic research confirms that effective ‘resource governance’ is a critical precondition for generating economic and social value from open data. By establishing clear institutional roles, legal mandates and a predictable policy environment, a national strategy signals long-term political commitment. This signal is crucial for potential data reusers, as it reduces the uncertainty and risk associated with investing in the use of government data assets. This metric therefore serves as a primary, qualitative measure of the maturity of a Member State’s strategic intent, which macro-level studies suggest is a key determinant of downstream innovation and economic activity.
Intervention logic
The theory of change for this indicator begins with the activity of public administrations investing dedicated resources to formalise their approach to open data. This involves defining roles and responsibilities across the government, establishing a clear mandate for a national coordinating body and creating a transparent process for identifying datasets with high value for reuse, as specified in the Open Data Directive. The direct output of this activity is a set of public documents, including an official national open data strategy and a corresponding implementation plan. This indicator measures the completeness and operational focus of those documents. These artefacts are the first tangible signal to potential reusers that the government’s publication efforts are deliberate, sustainable and aligned with user needs, thereby establishing the necessary trust and predictability to encourage their participation in the data ecosystem.
Measurement protocol: practical
This protocol provides a verifiable assessment based on publicly accessible documents. The indicator is calculated as a composite score based on the existence of key strategic components, resulting in a score from zero to three. A score of one is assigned for each of the following criteria that is met: first, a public document exists that assigns overall responsibility for the national open data strategy to a named ministry, agency or coordination body; second, a public implementation plan for the release of high-value datasets (HVDs) under Commission Implementing Regulation (EU) 2023/138 (‘HVD Implementing Regulation’) is available; and third, the national strategy or a related public document explicitly describes a process for consulting with public and private stakeholders on data prioritisation. The primary data sources are national open data portals and official government websites. The measurement should be conducted annually by the responsible authority, serving as a direct, evidence-based proxy for strategic intent.
Measurement protocol: extended
A more mature measurement protocol assesses the operational reality of governance, moving beyond the simple existence of documents. This extended indicator would be calculated as a maturity score, from zero (non-existent) to three (managed and optimised), based on an evidential review of the underlying processes. The assessment would verify whether a formal, cross-government body with a legal mandate and dedicated budget convenes regularly to oversee the strategy. It would also assess if a documented, repeatable process exists for identifying and prioritising new datasets for publication, which must include evidence of stakeholder consultation, such as published reports and a cost–benefit analysis for significant datasets. Finally, it would verify that the national open data strategy is explicitly linked to resource allocation in the national budget. The data sources for this assessment are internal government records, meeting minutes of governance bodies and budgetary documents, collected annually by the responsible authority through a formal request submitted to the relevant ministries.
Analysis and interpretation
This indicator provides a national-level score that does not require normalisation. It is designed for direct comparison between Member States and over time to track strategic progress. When interpreting the results, it is critical to acknowledge the indicator’s limitations. It is a leading indicator that measures strategic intent and the maturity of governance processes, not the execution of those processes or the ultimate impact of the open data released. A high score suggests that a strong foundation for creating value is in place, but it does not measure that value directly. The data quality for the practical measurement is graded according to the accessibility of the source documents; a grade of ‘A’ requires all necessary documents to be current and accessible from the national portal within three clicks. Known exclusions, such as regional or city-level strategies not covered by the national plan, should be documented.
Indicator 1.2 (collection): comprehensiveness of data asset inventories
Intent and rationale
This indicator measures the degree to which public sector bodies maintain and publish structured, machine-readable inventories of their data holdings. The creation of such inventories is a foundational component of effective ‘resource governance’, a critical enabling factor for the entire open data ecosystem as demonstrated by Jetzek et al. (2013) An administration cannot strategically manage or prioritise what it does not know it possesses. For data reusers, public data inventories provide essential ‘signals’ that reduce uncertainty and lower search costs, addressing one of the primary barriers to data reuse identified by researchers such as Welle Donker et al. (2017). By making the existence of data assets visible, even if the data itself is not yet open, these inventories allow potential reusers to discover what is available and to request access to the datasets that are most valuable to them.
Intervention logic
This indicator provides evidence for the first step in the formal data publication process. The intervention logic begins with the activity of public bodies undertaking a systematic audit of their internal data assets. The direct output is a structured inventory that serves as a comprehensive catalogue of the organisation’s data holdings. This indicator measures the quality and coverage of these inventories. The immediate outcome is enhanced visibility of the government’s data assets, both internally for civil servants and externally for the public. This visibility is a prerequisite for a strategic approach to open data, allowing for the systematic identification and prioritisation of datasets for publication and thereby enabling a more efficient and demand-led open data value chain.
Measurement protocol: practical
This protocol provides a verifiable assessment based on a survey of publicly accessible information. The indicator is calculated as a composite score from zero to three, based on the percentage of central government ministries, or equivalent national-level bodies, that publish a data asset inventory. A score of one is assigned if between one and thirty-three per cent of ministries publish an inventory; a score of two is assigned if this figure is between thirty-four and sixty-six per cent; and a score of three is assigned if sixty-seven per cent or more do so. For a ministry’s inventory to be included in the count, it must be machine-readable, available in a format such as CSV or JSON or via an API and contain at a minimum a title, a brief description and the name of the holding department for each asset. The primary data sources are national open data portals and the websites of individual ministries. The measurement should be conducted annually by the responsible authority.
Measurement protocol: extended
A more mature and automated measurement protocol would shift from a sample-based score to a comprehensive, machine-validated metric. The extended indicator is calculated as the percentage of central government bodies that provide a data asset inventory compliant with a national metadata profile, discoverable and harvestable via a central API. The numerator is the count of ministries providing a compliant inventory feed. The denominator is the total number of central government ministries, as sourced from an official national register of public bodies. Compliance would be automatically validated by a script that checks for the presence and correct formatting of mandatory metadata fields in each ministry’s inventory, ensuring a consistent and fully reproducible assessment of data governance maturity across the public administration.
Analysis and interpretation
This indicator provides a national-level score designed for comparison over time and across Member States. Its primary purpose is to assess the maturity of foundational data asset management. A significant caveat is that this indicator is a proxy for the potential supply of open data, not the actual supply or its value. A comprehensive and high-quality inventory is a necessary, but not sufficient, condition for a high-impact open data programme. The data quality for the practical measurement is graded according to the ease of discovery; a grade of ‘A’ requires inventories to be discoverable through a central catalogue on the national portal. Known exclusions from the calculation, such as the data assets of sub-national bodies or state-owned enterprises, must be clearly documented.
Indicator 2.1 (publication): publication volume and growth
Intent and rationale
This indicator measures the total number of datasets published on the national open data portal and the annual growth rate of the catalogue. It is a foundational supply-side metric that provides a primary signal of a government’s activity and sustained commitment to its open data policy. A consistently growing catalogue indicates a healthy, expanding ecosystem where new resources are regularly made available, which in turn can stimulate innovation and create economic value. While a simple count is not a measure of impact in itself, it is a necessary precondition; without a growing supply of data, the potential for reuse and the subsequent generation of social and economic benefits is inherently limited. Furthermore, a dynamic and expanding catalogue acts as a positive signal to potential reusers, reducing their uncertainty about the long-term viability of the data source and encouraging them to invest in developing data-driven services.
Intervention logic
The causal pathway for this indicator begins with the ongoing operational activity of public bodies identifying, preparing and transferring datasets to the national portal operator for release. The portal operator, in turn, curates and publishes this data. The direct and measurable output is an increase in the absolute number of datasets available in the national catalogue. This indicator tracks both the stock and the flow of this output. The immediate outcome of a larger and growing dataset portfolio is an increase in the statistical probability that a potential reuser will discover a dataset that is relevant to their needs. This expanded supply of raw material creates a larger surface area for experimentation and innovation, which serves as a critical enabler for the eventual creation of higher-level economic and social impacts.
Measurement protocol: practical
The practical method for calculating this indicator relies on data that is readily available from the national portal itself. The first component, publication volume, is the absolute count of datasets available on the portal, measured at a consistent point in time each year, such as the end of the fourth quarter. The unit of measure is datasets. The second component, publication growth, is calculated as the year-over-year percentage change in the total dataset count, using the formula: ((count in year two minus count in year one) divided by count in year one) multiplied by one hundred. The data source is the national open data portal’s public dashboard or its API. The measurement should be conducted annually by the responsible authority to ensure consistent longitudinal analysis.
Measurement protocol: extended
A more robust, extended measurement protocol moves beyond a simple, undifferentiated count to provide a more meaningful assessment of the quality of the supply. This would involve disaggregating the volume and growth metrics into key strategic categories. The extended protocol would therefore report not one, but three distinct growth figures, calculated annually: first, the overall catalogue growth as described in the practical protocol; second, the growth in the number of HVDs as defined under the Open Data Directive; third, the growth in the number of datasets that are provided in machine-readable formats and accessible via an API. This requires an automated harvesting of portal metadata to categorise datasets accurately. This method provides a much richer and more policy-relevant picture of progress, distinguishing between the simple expansion of quantity and a strategic improvement in the quality and potential reusability of the national data assets.
Analysis and interpretation
For analytical purposes, the raw count of datasets should be normalised to enable meaningful cross-country comparison. A recommended normalisation rule is the number of datasets published per one million inhabitants. Growth rates, being percentages, are directly comparable. When interpreting this indicator, it is imperative to acknowledge its primary limitation: it is a measure of supply, not of demand or impact, and is susceptible to being a ‘vanity metric’. A high volume of low-quality, unused or irrelevant datasets does not represent progress. Therefore, this indicator must always be analysed in conjunction with other indicators that measure data quality, dataset use and eventual outcomes. Disaggregating the total volume according to publisher can identify which ministries are most active, while disaggregation according to theme can show whether publication is aligned with strategic policy areas such as the green transition or public health. The data quality is graded based on the availability and granularity of the portal’s own statistics; a grade of ‘A’ requires that the portal provide time-series data on catalogue size through a public API.
Indicator 2.2 (publication): high-value dataset publication rate
Intent and rationale
This indicator measures the percentage of datasets mandated by the Open Data Directive’s HVD Implementing Regulation that a Member State has made available as open data. This is a primary metric of legal compliance and strategic alignment with a core pillar of the European data strategy. Unlike a general measure of catalogue size, this indicator focuses on a curated list of datasets identified by the Commission as having the highest potential to generate significant socioeconomic benefits across the EU. The publication of HVDs provides a powerful signal to the market, reducing uncertainty for reusers and indicating that the government is prioritising the release of assets with the greatest potential for innovation and value creation, a key factor in encouraging private sector investment in data-driven services.
Intervention logic
This indicator measures a specific, legally mandated publication activity. The intervention logic begins when a Member State transposes the list of HVDs from the HVD Implementing Regulation into a national action plan. Public sector bodies then identify the specific datasets within their holdings that correspond to the mandated thematic categories and technical specifications. They prepare this data for publication, ensuring it meets the required conditions, such as API accessibility. The direct output is the publication of these specific HVDs. This indicator measures the completion rate of this output against the legal requirement. The intended outcome is to make the most valuable public data assets readily and consistently available across the entire single market, thereby accelerating cross-border innovation and creating a more integrated and competitive European data economy.
Measurement protocol: practical
This protocol provides a verifiable assessment based on a manual audit against the official legal text. Member States are currently required to report information to the Commission biennially. The indicator is calculated as the number of mandated HVDs published by the Member State, expressed as a percentage of the total number of HVDs applicable to that state. The formula is: ((number of mandated HVDs published) divided by (total number of mandated HVDs applicable)) multiplied by one hundred. The primary data source for the denominator is the Annex to the HVD Implementing Regulation. The numerator is determined via an annual audit conducted by the responsible authority. This audit involves manually verifying the publication of each applicable dataset by searching the national portal and relevant public administration websites. A dataset is considered ‘published’ if it is discoverable and publicly accessible.
Measurement protocol: extended
A more robust and automated measurement protocol would rely on a machine-readable, national HVD registry. Datasets are being gradually published on national portals, appropriately tagged so they can be identified as HVDs and categorised using the common controlled vocabularies for HVDs. Each Member State is required to maintain a public metadata record for every applicable HVD, using a common European identifier for each dataset category. This record specifies the publication status, such as ‘published’ or ‘in preparation’ and provide a direct, resolvable link to the dataset and its associated API endpoint. A central harvesting service, for instance operated by European Data Portal, will then automatically poll these national registries via an API. The extended protocol should also include an automated spot-check to validate that the linked dataset meets the minimum technical requirements of the directive, such as format and API availability, thus measuring not just publication but full compliance.
Analysis and interpretation
As a percentage, this indicator does not require further normalisation and is directly comparable across Member States and over time. For more granular analysis, the publication rate should be disaggregated into the six thematic categories of HVDs defined in the directive: geospatial, earth observation and environment, meteorological, statistics, companies and company ownership and mobility. This allows for an assessment of progress in specific strategic domains. The primary caveat is that this indicator measures supply-side compliance, not the demand for or impact of the data. A 100 % publication rate is a positive sign of good governance, but the ultimate goal of creating value depends on these datasets being reused. Therefore, this indicator should be interpreted in conjunction with metrics on dataset usage. The data quality of the practical measurement depends on the systematic rigour of the manual audit.
Indicator 2.3 (publication): metadata quality
Intent and rationale
This indicator measures the descriptive quality, completeness and standards-compliance of metadata across the national open data catalogue. High-quality metadata is a foundational element of a functional open data ecosystem. As research by Washington (2014) on ‘data signals’ demonstrates, metadata acts as the primary signal through which potential reusers assess the suitability, reliability and trustworthiness of a dataset. It is the mechanism that reduces information asymmetry between the publisher and the consumer. Inadequate or non-standard metadata creates uncertainty, significantly increases the search and evaluation costs for reusers and acts as a major barrier to the discovery and subsequent use of data. This indicator’s purpose is therefore to measure the extent to which a portal provides clear and consistent signals, thereby directly enabling the findability, interoperability and reusability of its data assets, in line with the FAIR (findable, accessible, interoperable, reusable) data principles.
Intervention logic
The causal pathway begins with the activity of a national open data authority establishing and enforcing a common metadata standard, aligned with the data catalogue vocabulary application profile for data portals in Europe (DCAT-AP). Data publishers within public sector bodies then invest resources in creating complete and accurate metadata records for each dataset they publish. The direct output is a high-quality, standards-compliant metadata record accompanying each dataset. This indicator measures the aggregate quality score across all records in the national catalogue. The immediate outcome is a reduction in search costs and uncertainty for data reusers. They can more easily discover relevant data through faceted search, understand its content and context without needing to download the files and trust that it is accurately described, which are all essential preconditions for investing their own resources in creating value from that data.
Measurement protocol: practical
This protocol leverages the existing, automated assessment process operated by the European Data Portal. The indicator is the average metadata quality assessment (MQA) score for the national portal’s catalogue, as measured and published on the European Data Portal’s MQA dashboard. The formula is a composite score calculated by the MQA methodology, expressed as a percentage. The primary data source is the official MQA dashboard, which continuously harvests and assesses the metadata from all national portals connected to the European Data Portal. The measurement is therefore conducted on an ongoing basis by the Commission, and the role of the responsible authority is to monitor its national score and its ranking relative to other Member States. This method provides a standardised, comparable and low-effort proxy for metadata quality.
Measurement protocol: extended
A more robust and insightful protocol would augment the automated MQA score with a qualitative, user-centric audit, addressing aspects of clarity and utility that automated checks cannot fully capture. This extended indicator would be a composite index combining the MQA score (weighted at 70 %) with a manual audit score (weighted at 30 %). The manual audit, conducted annually by the responsible authority, would assess a strategic sample of at least 20 HVDs against a common European rubric. This rubric would evaluate the clarity of titles and descriptions for non-experts, the availability and quality of data dictionaries and clear referencing to the relevant EU legislation as highlighted in the European Data Portal’s HVD findability study. This hybrid approach combines broad, automated technical compliance with an in-depth, qualitative assessment of the metadata’s practical usefulness, providing a more holistic measure of its quality.
Analysis and interpretation
The MQA score is a normalised metric, allowing for direct comparison over time and across Member States. For actionable insights, the score must be disaggregated according to the key MQA dimensions of findability, accessibility, interoperability, reusability and contextuality to identify specific areas for improvement. Further disaggregation by the publishing authority is crucial for providing targeted support and training to the public bodies that need it most. The primary caveat of this indicator is that it measures a critical enabling condition, not the impact of the data itself. A dataset can have perfect metadata but be irrelevant or unused. Therefore, a high MQA score should be interpreted as a sign of a mature supply-side infrastructure, and its value is fully realised only when correlated with indicators of data usage, such as downloads, API calls and documented reuse cases.
Indicator 2.4 (publication): technical accessibility and reusability
Intent and rationale
This indicator measures the extent to which datasets are provided in formats and through channels that enable efficient, automated reuse. It assesses the technical fitness-for-purpose of the data supply, focusing on machine-readability and API availability. This is a direct operationalisation of the ‘technical connectivity’ enabling factor identified by Jetzek et al. (2013) as being critical for generating economic value. Data that is published only in non-machine-readable formats, such as a PDF document, or as a one-off file download has severely limited potential for scalable or innovative reuse. The provision of data in open, structured formats and via a well-documented API acts as a powerful ‘data signal’, as described by Washington (2014). It communicates to potential reusers, particularly developers and data scientists, that the data is intended for reuse and that the publisher has considered their technical needs, thereby reducing the cost, risk and uncertainty associated with building services on that data.
Intervention logic
The causal pathway for this indicator begins with the specific technical activity of data publishers formatting datasets into structured, non-proprietary formats and developing application programming interfaces (APIs) to provide access to them. This represents a deliberate investment in making data not just open, but truly reusable at scale. The direct output is a dataset distribution that is both machine-readable and accessible via a live API endpoint. This indicator measures the proportion of the national catalogue that meets these technical standards. The immediate outcome is a significant reduction in the technical barriers to reuse. This allows data scientists and application developers to automate the ingestion of data, integrate it directly into their workflows and build services that can rely on a continuous, up-to-date data flow, which is a fundamental prerequisite for the ‘innovation’ value-generation mechanism.
Measurement protocol: practical
The practical protocol leverages automated assessments to measure two distinct but related components of technical accessibility. The first metric is the machine-readability rate, calculated as the percentage of dataset distributions available in high-value, machine-readable formats. The numerator is the count of distributions in formats such as CSV, JSON, XML, GeoJSON and RDF, while the denominator is the total number of distributions in the catalogue. The second metric is the API availability rate, calculated as the percentage of datasets that are accessible via an API. The primary data source for both metrics is the metadata harvested from the national portal by the European Data Portal’s MQA, which already assesses format availability. The responsible authority should monitor its national MQA results and ensure the portal’s metadata accurately declares the format and API availability for each dataset.
Measurement protocol: extended
An extended measurement protocol would move beyond simply counting formats and API endpoints to assess their quality and strategic importance. The extended indicator would be a weighted HVD reusability score. This score would focus exclusively on the datasets mandated by the HVD Implementing Regulation. For each HVD, the protocol would first automatically verify the presence of a documented API endpoint. Second, it would perform a technical ‘ping’ to the API to confirm its operational status and measure its average response time, providing a proxy for reliability. Third, it would confirm that the data formats provided via the API are non-proprietary and machine-readable. A higher score would be given to datasets that provide stable, well-documented and high-performance API access, thus measuring the true functional reusability of the most strategically important data assets.
Analysis and interpretation
As percentages, both the practical and extended metrics are directly comparable across Member States and over time. For analysis, these indicators should be disaggregated according to publishing authority to identify which public bodies may require additional technical guidance and support. It is crucial to recognise the primary caveat: high technical accessibility is a powerful enabler, but it does not guarantee impact. It measures the potential for reuse, not the actual reuse itself. An excellent API for an irrelevant dataset creates no value. Therefore, this indicator must be interpreted as a supply-side maturity metric and should be analysed in conjunction with demand-side indicators, such as API call volumes and the number of registered reuse cases, to build a complete picture of the open data value chain.
Indicator 3.1 (uptake): portal traffic and data consumption
Intent and rationale
This indicator measures the volume of user interaction with the national portal, making a critical distinction between the passive viewing of data and active consumption through downloads. It is the most direct, quantitative measure of demand-side activity. Research highlights the importance of moving beyond simple portal visits to analyse stronger signals of intent; a download represents a user’s decision to invest their own time and resources in a dataset and is therefore a more powerful proxy for potential reuse than a simple page view. Tracking this activity provides essential feedback to data publishers, helping to identify which datasets are most relevant to user communities and justifying continued investment in the open data programme as a whole.
Intervention logic
This indicator measures the direct output of a user discovering and choosing to engage with a dataset. The intervention logic begins with the ongoing activity of operating a findable, accessible and user-friendly national data portal. A potential reuser then acts on a need for data by searching the portal. The output occurs when the user finds a dataset and interacts with it, first by viewing its metadata page to assess its relevance and second by actively consuming it through a file download or API access. This indicator quantifies these user actions. The immediate outcome is the generation of a demand signal, which informs data publishers about the utility of their assets and provides the first tangible evidence of uptake in the open data value chain, a necessary bridge from mere publication to value creation.
Measurement protocol: practical
The practical protocol relies on standard web analytics to capture two primary metrics. The first is dataset views, defined as the number of unique page views for a dataset’s metadata page. The second, and more important, metric is dataset downloads, defined as the number of times a specific file or distribution associated with a dataset is downloaded. These two core metrics should be used to calculate a third, the download-to-view ratio, using the formula: (total downloads for a dataset divided by total views for that dataset’s page). This ratio serves as a key performance indicator for the quality of the metadata and the relevance of the dataset itself. The data source is the portal’s own privacy-compliant analytics platform, and the metrics should be collected by the responsible authority and reported publicly on at least a quarterly basis.
Measurement protocol: extended
An extended measurement protocol would enrich the anonymous, quantitative data with contextual information about the reusers themselves. This would be enabled by a voluntary, privacy-compliant user registration system on the portal. This system would allow for the calculation of more sophisticated metrics, such as the volume of downloads disaggregated according to user type, for example commercial, academic, non-governmental or public sector. It would also enable the tracking of user retention, measuring the number of datasets downloaded per registered user over time and the extent of cross-border data flows, by measuring the proportion of downloads originating from users located in other Member States. The data sources would be the portal’s analytics platform linked to an anonymised user registration database, requiring robust data protection measures to be in place.
Analysis and interpretation
To enable meaningful comparisons, the raw counts of downloads should be normalised, for instance per 100 000 inhabitants, to account for differences in country size. The data must also be disaggregated according to theme and by publishing organisation to provide actionable intelligence for strategic planning. The most significant caveat for this indicator is that it is a measure of interest, not of impact. A high download count is a positive leading indicator, but it does not in itself represent the creation of economic or social value. A dataset may be downloaded many times but never used, or used trivially. Conversely, a single download by a strategic reuser could lead to significant innovation. This indicator must therefore be interpreted with caution as a demand signal and should be used to identify datasets worthy of more in-depth, qualitative investigation through case studies.
Indicator 3.2 (uptake): API consumption rate
Intent and rationale
This indicator measures the volume of data consumed programmatically via APIs. It is a direct and robust measure of machine-to-machine reuse, which is fundamentally different from manual file downloads. API consumption signifies a deeper level of integration, where open data becomes an operational component of another digital service, application or analytical workflow. This form of reuse is a key enabler of high-value, automated and real-time services, reflecting the ‘technical connectivity’ factor that academic models, such as the one by Jetzek et al. (2013), identify as a direct driver of efficiency and innovation. A high rate of API consumption is therefore a strong signal of a mature data ecosystem where reusers have the confidence and capability to build dependent services upon government data assets.
Intervention logic
The causal pathway for this indicator begins when a data publisher invests in creating and maintaining a reliable, well-documented API for one or more of its datasets. A data reuser, typically a developer or data scientist, then writes software that makes automated calls to this API to fetch data as part of an ongoing process. The direct, measurable output is a successful API call, which is recorded in the system’s logs. This indicator is the aggregated count of these outputs over a given period. The immediate outcome is the creation of a live data dependency, where the reuser’s service is programmatically linked to the publisher’s data stream. This establishes a dynamic and scalable form of reuse that is a direct precondition for creating innovative services, from real-time public transport applications to automated business intelligence dashboards.
Measurement protocol: practical
This protocol addresses the common challenge that API usage data is often not public by establishing a standardised, transparent reporting requirement. The primary metric is the total number of successful API calls per month, disaggregated according to dataset. This data is to be collected and published by the responsible authority. Because the raw data resides in internal API gateway logs, the practical collection method requires that the national coordinator mandate a simple, standardised reporting template for all public bodies that operate data APIs. This template should require the quarterly publication of aggregated, anonymised statistics including, at a minimum, the total API calls per dataset; the number of unique registered API keys or users per dataset; and a ranked list of the top ten most consumed datasets via API.
Measurement protocol: extended
An extended protocol would establish a fully automated, real-time and more granular measurement system, likely through a common national API management gateway or a federated monitoring standard to which all public sector APIs must adhere. This would enable the public and policymakers to monitor a live dashboard of national API usage. Beyond simple call counts, this system would calculate and display advanced metrics, such as API uptime and error rates, providing a direct measure of service reliability. It would also track average API response times (latency), a key performance indicator for real-time applications. Furthermore, it would allow for the analysis of consumption by endpoint, revealing which specific parts of a dataset or data service are most in demand, providing highly actionable intelligence for both data publishers and potential innovators.
Analysis and interpretation
To enable comparison across Member States, the raw number of API calls should be normalised, for instance per 100 000 inhabitants or per dataset with an available API. The most critical analysis involves disaggregating the data to identify which datasets and which publishing agencies are generating the most significant automated reuse. This provides a powerful, evidence-based tool for directing future investment and support. The central caveat is that while API consumption is a very strong proxy for value creation, it is not a direct measure of economic or social impact. A high volume of calls signifies successful technical integration, but the value of the service using the API must be assessed separately. This indicator is therefore a powerful tool for identifying high-potential reuse cases that warrant deeper investigation through qualitative case studies.
Indicator 3.3 (uptake) user search success rate
Intent and rationale
This indicator measures the effectiveness of the national portal’s search functionality by calculating the proportion of user search queries that result in a user engaging with a search result. A primary function of an open data portal is to act as a discovery mechanism, and this metric is a direct measure of its success in that role. The process of finding relevant data involves tangible ‘search costs’ for reusers, as described by Welle Donker et al. (2017).; a high search success rate indicates that the portal is effectively minimising these costs. Furthermore, in the context of information asymmetry described by Washington (2014), the search results page is the first critical set of ‘signals’ a user receives. A successful search, in which the user finds and clicks on a relevant dataset, indicates that the portal’s metadata, titles and indexing are working effectively to reduce user uncertainty and build confidence. A failed search represents a signal failure, increasing user friction and potentially leading them to abandon their quest for data.
Intervention logic
The causal pathway for this indicator begins with the activity of a data publisher providing clear, well-structured metadata and a portal operator implementing a robust search algorithm. A user then acts on a need for data by executing a search query. The direct output is the search results page. A successful outcome occurs when the user identifies a promising result on this page and clicks through to a dataset page for further investigation. A failed outcome is when the user abandons the search or refines their query without clicking on any results. This indicator measures the ratio of successful outcomes to total search attempts. It is a critical early-stage metric in the ‘uptake’ phase of the value chain, serving as a gateway to all subsequent activities such as dataset download, use and the eventual creation of value. If users cannot find the data, no impact can be generated.
Measurement protocol: practical
This protocol uses standard, privacy-preserving web analytics to calculate the success rate. The indicator is calculated as the percentage of unique search sessions that include a click on a link from the search results page. The formula is: ((number of searches followed by a result click) divided by (total number of unique search queries)) multiplied by one hundred. A ‘search query’ is a unique instance of a user submitting a search term. A ‘result click’ is a user clicking on any dataset, application or information link presented on the results page. The primary data source is the anonymised search log analytics from the portal’s own platform, which should be collected and reviewed at least quarterly by the responsible authority to identify trends and potential issues.
Measurement protocol: extended
An extended protocol provides a more nuanced and actionable understanding of search performance by moving beyond a simple click-through rate. It would involve calculating three distinct metrics. First, the zero-result rate, calculated as the percentage of unique search queries that return no results, providing a direct measure of vocabulary mismatch and content gaps. Second, the search abandonment rate, which measures the percentage of search sessions where a user leaves the site directly from the results page without any interaction. Third, it refines the definition of success to be a search leading to a qualifying action, such as a file download or an API call made shortly after the search. This more stringent definition of success filters out ‘bounces’ where a user clicks a result but immediately determines it to be irrelevant, thus providing a much stronger signal of true findability and relevance. These metrics would require an advanced, privacy-compliant analytics platform capable of tracking user flows and conversion events.
Analysis and interpretation
While a rising success rate is a positive indicator of portal health, the most actionable insight comes from analysing the failures. The responsible authority should regularly analyse and publicly report a list of the most frequent search terms that yield zero results. This list represents a direct, evidence-based signal of unmet user demand and provides an invaluable, prioritised roadmap for future data publication and metadata improvement efforts. It is important to recognise the indicator’s limitations: it measures findability, not the ultimate quality or impact of the data. A user may successfully find a dataset only to discover it is outdated or in a poor format. Therefore, this indicator should be used as a diagnostic tool for the portal itself and interpreted in conjunction with data quality and data consumption metrics to form a complete picture of the user journey.
Indicator 4.1 (application): volume and thematic distribution of reuse cases
Intent and rationale
This indicator measures the number and thematic focus of documented applications, services, visualisations and research built upon open data. It is the primary quantitative measure of innovation outcomes, providing direct evidence that data is not just being consumed, but actively transformed into new products and knowledge. This metric directly operationalises the ‘innovation’ value-generating mechanism described by Jetzek et al. (2013), which posits that open data creates value through the generation of new services and businesses. A growing and diverse portfolio of reuse cases signals a healthy ecosystem where data reusers are successfully overcoming technical barriers and investment risks. Furthermore, a publicly maintained catalogue of these cases serves as a powerful collection of ‘signals’, as described by Washington (2014), demonstrating the viability and value of open data and thereby encouraging further innovation from other potential reusers.
Intervention logic
The causal pathway for this indicator begins after a reuser has accessed and consumed open data. The core activity is the reuser’s investment of their own resources, skills and capital to transform the raw data into a value-added product or service. The direct output of this process is the reuse case itself: a new mobile application, a business intelligence dashboard, a journalistic investigation or a scientific paper. This indicator measures the stock and thematic classification of these outputs. The immediate outcome is the creation of new economic and social value, which now exists in a tangible form. The existence of these reuse cases is the necessary precondition for generating any higher-level impacts, such as job creation within a new company, efficiency gains in a specific industry or improved public discourse resulting from data-driven journalism.
Measurement protocol: practical
The practical protocol involves a systematic audit of the national open data portal’s public reuse case repository or showcase. The measurement consists of two components. The first is total volume, calculated as the absolute count of unique and verified reuse cases listed. A case is considered ‘verified’ if it has a working link to the application or service and a clear description of its purpose. The second is thematic distribution, calculated as the percentage of total reuse cases that fall into each of the framework’s primary impact domains: economic, social and environmental. This requires a manual classification of each case based on its stated purpose. The primary data source is the national portal itself. The measurement should be conducted annually by the responsible authority.
Measurement protocol: extended
An extended protocol would establish a national, machine-readable reuse case registry, creating a dynamic and verifiable data asset in its own right. This would require a standardised submission process where reusers are mandated to provide structured metadata about their product, including a persistent link to the reuse case and, crucially, persistent links (such as digital object identifiers (DOIs)) to the specific open datasets it consumes. This enables automated, large-scale analysis. The extended metrics would then include not only volume but also data-source linkage, calculating the number of reuse cases per dataset, thus identifying the most impactful data assets. It would also enable automated verification, with scripts that periodically check the operational status of the reuse case. Finally, the registry could include structured, voluntary fields for reusers to provide their own first-order impact metrics, such as the number of active users or jobs supported by their service.
Analysis and interpretation
To enable meaningful comparisons, the absolute number of reuse cases should be normalised, for example per one million inhabitants or per one thousand datasets in the national catalogue. The thematic distribution provides critical insight into whether the open data ecosystem is aligned with national strategic priorities. The most significant caveat is that this indicator measures the quantity of innovation, not its quality or ultimate impact. A high number of reuse cases is a positive sign of a vibrant ecosystem, but one highly successful commercial application may generate more economic value than one hundred small-scale projects. Therefore, this indicator should be understood as a tool for identifying the breadth of reuse and for populating a pipeline of cases that warrant a more in-depth qualitative and quantitative impact assessment, following the methodologies of cost–benefit analysis demonstrated by Welle Donker et al. (2017) or as pursued by the Use Case Observatory.
Indicator 4.2 (application): explicit dataset references and citations
Intent and rationale
This indicator measures the number of formal citations and references to open datasets in external scientific literature, policy reports and open-source software. A citation is a powerful, verifiable signal that a dataset has not only been discovered but has been actively used as an input for the creation of new knowledge or a new technical product. It represents a much higher level of demonstrated value than a simple download. Tracking citations allows us to assess the integration of open data into the wider research and innovation ecosystem, providing a credible, third-party validated proxy for impact. As the work of Alderete (2020) demonstrates, linking open data policies to innovation outcomes is central to understanding economic impact and tracking citations provides a direct, micro-level evidence base for this linkage.
Please note and adhere to existing EU guidance: Data Citation – A guide to best practice.
Intervention logic
The causal pathway begins after a data reuser, such as a researcher, policy analyst or software developer, has consumed a dataset. The reuser’s activity involves incorporating the data into their work, performing analysis and generating new findings or building a new software feature. As a matter of academic or professional practice, they then formally credit the data source in their final output. The direct, measurable output is the published citation or reference itself, a permanent and verifiable link between the open dataset and the new creation. This indicator is the aggregated count of these outputs. The immediate outcome is the creation of an evidence base demonstrating that specific open datasets are considered reliable and valuable enough to be foundational components of new scientific and technical work.
Measurement protocol: practical
This protocol outlines a ‘best-effort’ approach using public search tools, acknowledging that without universal persistent identifiers (PIDs), measurement will be partial. The indicator is the simple count of verified citations found. The collection process, conducted annually by the responsible authority, involves a multi-pronged search strategy. First, for academic citations, automated search queries should be run on services like Google Scholar, Dimensions.ai and Scopus. Queries must combine the exact title of key datasets with the name of the publishing authority (e.g. ‘Annual Crop Survey’ AND ‘Ministry of Agriculture of [Member State]’). Second, for software references, the APIs of major code repositories, primarily GitHub, should be queried to search for direct URL links pointing to dataset resources on the national portal. Third, for policy citations, targeted keyword searches should be performed across national government publication archives and parliamentary records.
Measurement protocol: extended
An extended protocol creates a highly reliable and almost fully automated measurement system based on the systematic use of PIDs. This requires the national open data authority to adopt a strategy of assigning a DOI, managed by an agency like DataCite, to every published dataset. The measurement process then shifts from manual searching to a direct, automated API query. The extended indicator is the total number of registered citations for the national portal’s entire DOI prefix. The primary data source and aggregator is the DataCite API. The responsible authority would execute a scripted query against this API on a quarterly basis to retrieve a complete, machine-readable list of all academic papers and other datasets and software that have formally cited their open data assets. This provides a comprehensive, verifiable and low-effort census of data reuse in the research and innovation ecosystem.
Analysis and interpretation
The raw count of citations should be normalised for comparison, for instance by calculating ‘citations per 1 000 published datasets’. For actionable insights, the results must be disaggregated according to the individual dataset to identify the most valuable and impactful data assets, which can then inform prioritisation. It is crucial to acknowledge several significant limitations. First, there is a substantial time lag, as it can take years for research to be conducted, written and published. Second, this method has an inherent bias towards academic and public sector reuse, as much commercial reuse will not result in a public citation. Therefore, while a high citation count is a strong positive indicator of value, it likely represents an undercount of the total reuse. This metric is a powerful tool for demonstrating research and policy impact but should not be mistaken for a complete picture of all economic activity.
Economic impact indicators
The economic impact indicators are designed to estimate the contribution of open data to core national economic goals, specifically employment, gross value added (GVA), productivity, innovation and cost savings. These metrics address the fundamental question of how an open data policy translates into tangible economic growth and competitiveness. Acknowledging the significant challenge of direct attribution, the framework employs a robust, model-based estimation methodology. This approach establishes a clear division of labour: a central, EU-level research function is responsible for creating and maintaining a set of authoritative statistical coefficients, while the task for Member State teams is to apply these coefficients to their own, locally available administrative and commercial data. This hybrid method ensures that the final estimates are both methodologically consistent across the EU and grounded in national realities, providing a credible way to calculate the ‘open data slice’ of the broader data economy measured by the European Data Market Study.
Indicator Econ1: employment
Intent and rationale
This indicator provides an estimate of the number of full-time equivalent (FTE) jobs within the Member State that are directly supported by the reuse of open data. Job creation is a primary, tangible measure of economic impact and a core objective of policies aimed at fostering a data-driven economy. While the European Data Market Study measures the size of the broader ‘data professionals’ workforce, this indicator is designed to isolate and quantify the specific contribution that open data makes to this labour market. Academic research, such as the econometric model developed by Alderete (2020), provides evidence for a significant and positive effect of open data on economic activity, which includes innovation and business creation. This indicator operationalises that finding by measuring one of its most direct consequences: the employment of skilled individuals in roles that create value from public data assets.
Intervention logic
The causal pathway to employment is a multistage process that represents a significant part of the open data value chain. It begins with the availability of high-quality open data, which is then discovered and reused by entrepreneurs and existing firms to create new products and services, as measured by the output indicator on reuse cases. This innovation and business activity constitutes the primary outcome. This outcome, in turn, creates a derived demand for labour. Companies formed around open data-driven services, or new business units within established firms, must hire staff to build, maintain, market and sell their offerings. These roles, ranging from data scientists and software developers to sales and support staff, represent the final economic impact of job creation. This indicator aims to quantify that final step, acknowledging that it is the result of a complex chain of events where attribution can be challenging.
Measurement protocol: practical
The practical protocol uses a robust, model-based estimation that combines national data with a centrally provided EU-level coefficient, avoiding the need for new, resource-intensive national surveys. The indicator calculates the ‘estimated number of open data-related FTEs’. The measurement process follows a clear division of tasks.
1. At the EU level (periodic research). To avoid placing formal reporting obligations on NSOs or Eurostat, a policy directorate-general (DG) (such as DG Connect) or the central team supporting the European Data Portal (data.europa.eu) will conduct periodic, targeted pan-European micro-surveys (or self-declared ‘smart surveys’) of open data reusers. The purpose of this agile research is to establish and update a credible ‘open data employment coefficient’. This coefficient represents the average percentage of ‘data professionals’ within a known open data-reusing firm who are dedicated to working with public open data. This coefficient should be published and disaggregated into key sectors (e.g. mobility, finance, health).
2. At the Member State level (periodic calculation). National teams apply this central coefficient to their national context. The process is as follows.
- Identify the population. Compile the national list of known open data companies from the reuse case repository (Indicator 4.1).
- Source employee data. For each company on this list, use a commercial data provider (e.g. LinkedIn Sales Navigator, Dealroom.co) or the national business register to obtain the total number of employees and, where possible, the number of employees in ‘data professional’ roles.
- Apply the coefficient. Multiply the number of data professionals in each company by the relevant, centrally provided sectoral ‘open data employment coefficient’ to estimate the number of open data FTEs in that company. Sum these figures to produce the national estimate.
Measurement protocol: extended
An extended protocol provides a more robust, top-down statistical measure by integrating an open data module into official national surveys. This would require the NSO to include a set of standardised questions in its annual business or labour force surveys. These questions would ask firms to quantify their reliance on open data as a key production input (e.g. as a percentage of data used, or its perceived importance on a Likert scale). The NSO would then use econometric methods to model the correlation between a high dependency on open data and the number of ‘data professionals’ (using the official occupation codes and definitions aligned with the European Data Market Study) employed by those firms. The output would be a statistically derived estimate of the total national employment attributable to open data, providing a far more comprehensive and less subjective measure than a bottom-up survey.
Analysis and interpretation
The final employment estimate should be disaggregated according to economic sector to identify where open data is creating the most demand for data professionals. For cross-country comparison, the figure should be normalised, for instance as ‘open data-related jobs per one million inhabitants’ or as a percentage of the total national ‘data professionals’ workforce as defined by the European Data Market Study. The principal caveat is that this indicator provides a modelled estimate, not a direct census count of jobs. The accuracy of the estimate is directly dependent on two key inputs: the quality of the national reuse case repository, which forms the population frame and the validity of the centrally provided EU-level ‘open data employment coefficient’. Therefore, the results must be presented with full transparency about the methodology, acknowledging that it provides a robust estimate of the order of magnitude of open data’s contribution to employment, not a precise headcount.
Indicator Econ2: gross value added
Intent and rationale
This indicator estimates the portion of GVA within the national data economy that is attributable to the use of public open data. GVA is the primary measure of economic production, representing the value of goods and services produced minus the cost of intermediate inputs. This indicator is therefore the most direct and powerful metric for quantifying open data’s contribution to national economic growth. It is specifically designed to calculate the ‘open data slice’ of the total ‘data economy value’, which is already measured by the European Data Market Study, ensuring methodological coherence with the Commission’s flagship economic monitoring. Academic studies provide robust evidence that open data stimulates innovation and new business models; this indicator aims to capture the monetised value of that stimulus.
Intervention logic
The causal pathway to GVA represents the culmination of the economic value chain. It begins with the outputs measured by Indicator 4.1 (volume and thematic distribution of reuse cases), which documents the creation of new products and services. These products generate revenue in the marketplace, creating a new stream of economic activity (the outcome). GVA is the final impact derived from this outcome. It is calculated by taking the revenues generated by these open data-driven products and subtracting the value of intermediate goods and services consumed in their production. What remains is the ‘value added’ by the labour and capital employed in the open data firm or business unit, representing its direct contribution to the nation’s gross domestic product (GDP).
Measurement protocol: practical
The practical protocol mirrors the hybrid approach used for the Employment indicator. It uses a model-based estimation to calculate the ‘Estimated GVA attributable to open data’ by combining national administrative data with a centrally provided EU-level coefficient. The measurement process follows a clear division of tasks.
1. At the EU level (periodic research). Through the same agile, pan-European micro-surveys (or ‘smart surveys’) coordinated by a policy DG (such as DG Connect) or the European Data Portal (data.europa.eu) team for the employment indicator, firms will also be asked to estimate their ‘open data dependency ratio’ (the percentage of their revenue they attribute to using open data). Based on this research, the central team will establish and publish an authoritative set of ‘sectoral open data GVA coefficients’.
2. At the Member State level (periodic calculation). The national team’s task is to apply this coefficient to their national context. The process is as follows.
- Identify the population. Use the national list of open data companies from the reuse case repository (Indicator 4.1).
- Source financial data. For each company on this list, source its official annual revenue from the national business register.
- Calculate and apply. For each company, first estimate its total GVA by multiplying its revenue by the official GVA-to-revenue ratio for its sector (provided by the NSO). Then, multiply this estimated GVA by the relevant, centrally provided sectoral ‘open data GVA coefficient’ to arrive at the final estimate for that company. The national total is the sum of these individual estimates.
Measurement protocol: extended
The extended protocol provides a more robust, top-down statistical method that directly integrates with the sectoral accounts of the European Data Market Study. The indicator is calculated by multiplying the European Data Market Study’s GVA figure for each economic sector by a newly developed ‘sectoral open data intensity coefficient’. The formula is: national open data GVA = Σ (sectoral data economy GVA from the European Data Market Study * sectoral open data intensity coefficient). This coefficient, representing the proportion of a sector’s data-driven GVA attributable to open data, would be established and updated every two years through a dedicated research programme. Its creation would involve a two-stage process. First, conducting rigorous micro-level case studies and societal cost–benefit analyses (following the methodology of Welle Donker et al. (2017)) on the impact of key HVDs within that sector. Second, using the findings from these empirical cases as anchors for a structured expert elicitation process, such as the Delphi method, involving sectoral experts to arrive at a consensus-based, evidence-led coefficient for the sector as a whole. This creates a powerful, sector-specific multiplier that can be consistently applied to the high-level European Data Market Study data.
Analysis and interpretation
The final GVA estimate should be presented both as an absolute monetary value and as a percentage of the total ‘data economy value’ from the European Data Market Study, thereby clearly illustrating the size of the ‘open data slice’. It should also be expressed as a percentage of national GDP to communicate its macroeconomic significance. The most important disaggregation is by economic sector, which allows for an analysis of where open data is creating the most economic value. The primary caveat is attribution. This indicator provides a modelled estimate, not a direct accounting figure. Its quality is directly dependent on the comprehensiveness of the reuse case repository underpinning Indicator 4.1 (which provides the population frame) and the robustness of the centrally provided ‘sectoral open data GVA coefficients’. In all public communication, the results must be presented with transparency about the methodology and its limitations, framed as a ‘statistically-derived estimation of economic contribution’.
Indicator Econ3: productivity
Intent and rationale
This indicator estimates the contribution of open data to productivity growth within the national economy. Productivity, defined as the output generated per unit of input (typically labour), is the fundamental driver of long-term economic growth and improved living standards. Open data is theorised to enhance productivity through the ‘efficiency’ value-generating mechanism, described in academic models by Jetzek et al. (2013), by reducing search costs for information, enabling process automation and optimising resource allocation. This indicator’s purpose is to move beyond measuring the size of the open data economy (as in GVA) and instead quantify its impact on the efficiency of the broader economy, providing a powerful argument for open data as a strategic tool for enhancing national competitiveness.
Intervention logic
The causal pathway for productivity gains begins when firms and public bodies actively integrate open data into their core operational processes. This is a step beyond simply creating a new product; it involves using open data to make existing processes better. For example, a logistics company might use real-time open traffic data (output from a transport authority) to optimise delivery routes, or a financial services firm might automate compliance checks using open registers of companies. The direct outcome is a measurable gain in organisational efficiency, such as time saved on specific tasks, reduced operational costs or faster service delivery. The final impact, which this indicator seeks to measure, is the aggregation of these micro-level efficiency gains into a macro-level increase in sectoral or national labour productivity (output per employee).
Measurement protocol: practical
The practical protocol uses a survey-based approach to estimate a monetised efficiency gain, which serves as a robust proxy for the firm-level productivity impact. This method builds directly on the sampling frame of known open data reusers established for Indicator 4.1 (volume and thematic distribution of reuse cases). The process involves two steps. First, the annual survey sent to the stratified sample of open data companies will include a dedicated module on efficiency. This module will ask for quantifiable estimates on two primary effects: (1) time savings: ‘estimate the total hours per month your organisation saves due to the use of open data in specific business processes (e.g. logistics, compliance, market analysis)’; (2) cost savings: ‘estimate the annual direct cost savings your organisation achieves by substituting a previously paid data or software service with a public open data alternative’. Second, the responsible authority calculates the national monetised efficiency gain by extrapolating the survey results. The formula is: Σ [(hours saved * sectoral average hourly wage) + direct cost savings]. The sectoral average hourly wage is a standard statistical product available from the NSO.
The process is as follows.
- Distribute a targeted survey module to the stratified sample of open data companies identified in Indicator 4.1.
- Collect quantifiable estimates for two primary effects: time savings (hours per month saved in specific business processes) and direct cost savings (annual savings from substituting commercial data with open data).
- Monetise the time savings by multiplying the reported hours saved by the sectoral average hourly wage (sourced from the NSO).
- Sum the monetised time savings and the direct cost savings to calculate the national monetised efficiency gain.
Measurement protocol: extended
The extended protocol uses a top-down econometric approach to statistically estimate the contribution of open data to sectoral labour productivity. The indicator is the statistically estimated elasticity of sectoral labour productivity with respect to open data intensity. The process requires the NSO or a dedicated research partner to run a sectoral-level regression analysis. The dependent variable is ‘labour productivity’ (defined as sectoral GVA per employee, with data from Eurostat or national accounts). The key independent variable is a new composite index: the ‘sectoral open data intensity coefficient’. This coefficient is constructed by combining several of our framework’s other indicators: the thematic share of reuse cases from Indicator 4.1, the thematic share of dataset downloads from Indicator 3.1 and the thematic share of API calls from Indicator 3.2. The regression model would then estimate the impact of this intensity coefficient on productivity while statistically controlling for other key drivers like capital investment and the general skill level of the workforce.
Analysis and interpretation
The total monetised efficiency gain calculated through the practical protocol provides a powerful set of exemplars of productivity impact. The primary value lies not in the national total, which is a conservative undercount, but in the detailed case briefs that underpin it. The most critical point for interpretation is the relationship with the other economic indicators. The cost savings measured here should be understood as a component of the overall GVA measured in Econ2, not an additional, separate benefit. To avoid double-counting, these two indicators must not be summed. Instead, this indicator should be used to provide concrete, monetised explanations for a portion of the value added by open data. The extended method identifies a statistical correlation that is powerful evidence but does not prove definitive causation. Therefore, the results, from either protocol, must be communicated with a high degree of transparency about the methodology and framed as an evidence-based estimate of open data’s contribution to national productivity.
Indicator Econ4: innovation
Intent and rationale
This indicator estimates the contribution of open data to national innovation activity, focusing on high-potential entrepreneurship and new product development. Innovation is a fundamental driver of economic competitiveness and long-term growth. This indicator directly measures the ‘innovation’ value-generating mechanism from the model by Jetzek et al. (2013), which posits that open data creates value through the generation of new knowledge, processes and businesses. While GVA measures the current economic output, this indicator acts as a leading indicator of future economic growth by tracking investment in and the creation of novel, open data-driven ventures.
Intervention logic
The causal pathway for this indicator begins with the output captured by Indicator 4.1 (volume of reuse cases), which documents the creation of new applications and services. These reuse cases represent the raw stock of innovation. The most promising of these innovations, particularly those with a viable business model, then proceed to the next stage: seeking and attracting seed or venture capital funding. This investment is the critical outcome that transforms a project into a high-growth potential company. The final impact, which this indicator measures, is the aggregate level of this investment and the creation of formal intellectual property, such as patents, that result from this funded innovation activity.
Measurement protocol: practical
This protocol provides a qualitative but powerful evidence base by establishing a central, EU-level repository for high-impact case studies on cost savings, which Member States contribute to and draw from.
The measurement process is as follows.
- At the EU level (ongoing repository). The central body (e.g. European Data Portal (data.europa.eu)) will maintain a permanent, public ‘Open Data Cost Savings Case Study Hub’. This Hub will feature detailed, verified and monetised case studies from across the EU, following the methodology of the Use Case Observatory. The central team is responsible for verifying submissions and ensuring a common, high-quality standard for all published cases.
- At the Member State level (annual contribution and reporting). The practical task for the national team is twofold.
- Contribute evidence. On an annual basis, the national team is responsible for researching and submitting one to three of their nation’s best examples of open data-driven cost savings (either public or private sector) to the central EU hub. This is a manageable, qualitative research task.
- Contextualised reporting. In their national impact report, the team will present their own submitted case studies. They will then use the full EU-wide hub as a source of benchmarks to provide a qualitative assessment of the potential for similar savings in their own country, stating, for example: ‘Our national savings from the release of address data are estimated at EUR X million. Based on case studies from similar-sized countries in the EU cost savings hub, there is potential for further savings in the area of transport data optimisation.’
This revised approach transforms the practical protocols from aspirational surveys into a realistic, low-burden and methodologically sound process based on a clear division of labour between the EU and Member State levels.
Measurement protocol: extended
An extended protocol would create a more comprehensive ‘open data innovation index’ by combining multiple data streams in an automated or semi-automated fashion. This composite index would consist of three components. First, the venture capital (VC) investment metric from the practical protocol, but enhanced by using natural language processing to screen the business descriptions of all nationally registered start-ups (not just those in the reuse repository) for keywords indicating a dependency on open data. Second, a patent analysis metric, which involves a systematic, text-mining analysis of national and European patent filings (from the European Patent Office). This analysis would search for formal citations of datasets (relying on the PIDs from Indicator 4.2) or for keyword clusters linking the invention to specific public open data types. Third, an R & D expenditure metric, estimated by including a single, targeted question in the NSO’s official annual R & D business survey: ‘What percentage of your firm’s R & D expenditure is directly related to developing products or services that use public open data?’ This piggybacking approach avoids a new survey while capturing a vital data point.
Analysis and interpretation
The total VC funding figure should be disaggregated according to sector (e.g. fintech, healthtech, greentech) to identify where open data is catalysing the most investment. For comparison, the figure can be presented as a percentage of the total national VC investment for that year. The primary caveat is that VC investment is a leading indicator of innovation potential, not a final measure of market success or societal impact; many funded start-ups fail. The accuracy of the practical method is directly dependent on the comprehensiveness of the reuse case repository underpinning Indicator 4.1. A more complete repository provides a better starting list and thus a more accurate estimate. The indicator is also biased towards a specific type of innovation (venture-backed start-ups) and may not capture bootstrapped innovation or new service lines developed within large incumbent firms. The result should be presented as an ‘estimate of VC investment in open data-enabled innovation’.
Indicator Econ5: cost savings
Intent and rationale
This indicator estimates the direct cost savings realised by both public and private sector organisations through the use of open data. These savings are a direct, monetisable component of the ‘efficiency’ value-generating mechanism described by Jetzek et al. (2013) and represent one of the most tangible economic benefits of an open data policy. For businesses, savings are typically realised by substituting previously purchased commercial data with newly available, free-at-the-point-of-use open data. For public administrations, savings manifest as reduced administrative burdens, such as a decrease in the resources required to answer freedom of information (FOI) requests. Measuring these savings is critical because, fundamentally, they are a direct and measurable component of the productivity gains captured in Indicator Econ3. This indicator therefore serves to explain how and where some of those productivity gains are being achieved.
Intervention logic
The causal pathway for cost savings is triggered by the publication of an authoritative open dataset that is a direct substitute for either a costly commercial data product or an inefficient internal administrative process. For the private sector, the key activity is a firm’s decision to switch from a paid data provider to the new open data source, for example for geospatial, company or weather information. For the public sector, the activity is the proactive publication of frequently requested information. The direct outcome of these activities is the elimination of a cost: either a subscription fee is cancelled, or the time spent by civil servants on manual information provision is reduced. This indicator measures the aggregate value of these eliminated costs, which represents a direct economic impact as the saved resources can then be reallocated to more productive activities.
Measurement protocol: practical
This protocol uses a case-based, evidential approach that avoids new surveys by focusing on high-impact substitution effects, using data that is often publicly available or can be obtained from administrative records. The indicator is the sum of monetised cost savings from documented cases. The process involves two parallel streams.
- Public sector administrative savings. This is calculated by tracking the reduction in FOI or equivalent access to information requests for specific datasets after they have been proactively published as open data. The formula is: (annual number of requests pre-publication – annual number of requests post-publication) * (official standard cost per request). The data sources are the annual statistical reports from the national information commissioner or the internal administrative logs of individual ministries.
- Private sector substitution savings. This is estimated by identifying a small number of high-profile HVDs that have clear commercial equivalents (e.g. national address files, detailed mapping, company registers). The method, following the principles of societal cost–benefit analysis used by Welle Donker et al. (2017), estimates the saving as: (number of former commercial users) * (average historical price of the commercial alternative). The number of users can be estimated from market reports or stakeholder interviews conducted for the Use Case Observatory (Indicator 4.1). Historical pricing can be found in archived commercial price lists or news reports.
The total national estimate is the sum of savings calculated from these two streams for a selected number of well-documented cases.
The process is as follows.
- Calculate public sector administrative savings by comparing the annual number of FOI requests for specific datasets before and after their proactive publication.
- Multiply the reduction in FOI requests by the official standard cost per request.
- Calculate private sector substitution savings by identifying HVDs with clear commercial equivalents (e.g. national address files).
- Multiply the estimated number of former commercial users by the average historical price of the commercial alternative.
- Sum the savings from both the public and private streams to produce the total national estimate.
Measurement protocol: extended
The extended protocol creates a more systematic measure of public sector savings and introduces a scalable way to estimate private sector savings. For the public sector, all government departments would be required to implement a case management system that tags incoming queries against specific datasets, automatically generating a report on the reduction in queries for datasets that are published on the portal. For the private sector, the NSO would add one specific question to its existing annual Business Survey: ‘Please estimate your company’s total annual cost savings (EUR) resulting from the use of free, public open data as a substitute for previously purchased data or services’. By embedding this question in a mandatory statistical survey, the NSO can produce a statistically representative national estimate of private sector cost savings with minimal additional burden.
Analysis and interpretation
The final cost savings estimate should be disaggregated into ‘public sector administrative savings’ and ‘private sector substitution savings’. The most critical point for interpretation is the relationship with Indicator Econ3 (productivity). The cost savings measured here should be understood as a component of the overall productivity gain, not an additional, separate benefit. To avoid double-counting, these two indicators must not be summed. Instead, this indicator should be used to provide a concrete, monetised explanation for a portion of the efficiency gains observed in the broader economy. The main caveat of the practical method is that it is not a comprehensive census; it is an estimate based on a few, high-impact examples and therefore likely represents a conservative floor for the total national savings.
Social impact indicators
The social impact indicators assess the contribution of open data to societal well-being, democratic health and the quality of public services. These metrics capture the ‘public value’ of open data, demonstrating its role in fostering a more transparent, accountable and citizen-centric state. The measurement approach moves beyond attempting to quantify abstract concepts and instead focuses on practical, evidence-based proxies for social value. The protocols measure concrete and verifiable outputs, such as the systematic publication of key accountability datasets, the use of data as evidence in official policy documents, the user base of citizen-facing digital public services and the operational performance of emergency response systems. Together, these indicators provide a powerful, multifaceted evidence base to demonstrate that open data is not merely an economic asset, but a critical component of modern, effective and democratic governance.
Indicator Soc1: reuse in media, civil society and research
Intent and rationale
This indicator measures the documented use of national open data by journalists, civil society organisations (CSOs) and academic researchers. These actors are critical intermediaries in the data value chain; they transform raw data into accessible narratives, evidence-based analysis and tools for public accountability. This indicator serves as a direct, evidence-based proxy for open data’s contribution to a more informed and transparent society. It operationalises the ‘transparency’ and ‘participation’ value-generating mechanisms identified by Jetzek et al. (2013), which are fundamental to creating social and political value. The outputs from these actors – news articles, non-governmental organisation (NGO) reports and academic papers – are tangible signals of successful open data reuse and provide a measure of its integration into the fabric of public discourse and knowledge creation.
Intervention logic
The causal pathway begins when a member of media, civil society or academia discovers and accesses a relevant open dataset, as measured by uptake indicators like Indicator 3.1 (data consumption). They then invest their professional resources in analysing this data to generate new insights. The direct output of this activity is a new public-facing work: a data-driven news story, a policy report from a CSO, or a peer-reviewed academic paper. This indicator is the aggregated count of these specific, verifiable outputs. The immediate outcome is an increase in the availability of evidence-based information in the public sphere. This outcome is a direct precondition for higher-level social impacts, such as a more informed citizenry, greater government accountability and the development of evidence-based public policy.
Measurement protocol: practical
This protocol uses a ‘best-effort’ audit of public online sources, avoiding the need for new surveys. The indicator is the total count of verified instances of reuse by the three target groups. The process, conducted annually by the responsible authority, involves a structured search strategy that explicitly builds on and extends the work done for Indicator 4.2 (explicit dataset references).
- Media reuse. Systematically search the websites of the top ten national news organisations and the archives of the national public service broadcaster. Search queries should combine terms like ‘data’, ‘analysis’ and ‘statistics’ with the name of the national portal and key publishing ministries (e.g. ‘national statistics office’). A verified instance is an article that explicitly cites or links to a national open dataset.
- Civil society reuse. Systematically search the ‘publications’ or ‘reports’ sections of a curated list of twenty major national CSOs (e.g. the national chapters of Transparency International, major environmental NGOs and social welfare organisations). A verified instance is a published report or analysis that cites or links to a national open dataset.
- Research reuse. This is a direct application of the practical protocol for Indicator 4.2. Conduct systematic searches of Google Scholar and Dimensions.ai using the same search query logic to find academic papers that cite national open data.
The total national estimate is the sum of verified instances from these three streams.
The process is as follows.
- Measure media reuse by utilising professional media monitoring services to track mentions of key national data-publishing ministries in conjunction with terms such as ‘data analysis’ or ‘statistics’ across top national news organisations.
- Measure civil society reuse by systematically searching the publications and reports of major national NGOs for citations of national open data.
- Measure research reuse by executing structured queries in academic databases combining dataset titles with publishing authority names.
- Sum the verified instances across all three streams.
Measurement protocol: extended
The extended protocol establishes a semi-automated, comprehensive monitoring system that relies on the systematic adoption of PIDs. This is the same technical foundation required for the extended version of Indicator 4.2. First, all datasets on the national portal are assigned a DOI. The measurement process then becomes a set of targeted, recurring queries to existing, large-scale data aggregators.
- Research reuse. An automated API call to the DataCite or Crossref services to retrieve a full list of all academic publications citing the portal’s dataset DOIs.
- Media and policy reuse. Utilise a professional media and policy monitoring service (e.g. Meltwater, Altmetric.com) configured to continuously track mentions of the dataset DOIs across thousands of news outlets, blogs and policy documents.
- Civil society reuse. Develop a targeted web crawler that is configured to specifically scan the websites of a predefined list of hundreds of national CSOs, searching for the DOI patterns.
The combination of these automated feeds would provide a near real-time, comprehensive dashboard of open data uptake in public discourse.
Analysis and interpretation
The final count should be disaggregated according to the three actor types (media, civil society, research) to show which communities are most engaged. Further disaggregation according to the theme of the datasets being used (e.g. health, environment, budget data) provides critical intelligence on which data is driving public debate. The primary and most significant caveat is that this indicator measures the volume of public reuse, not its quality or influence. A single, in-depth investigative journalism series based on open data may have more social impact than one hundred minor mentions. This metric also represents a substantial undercount of total reuse, as many instances will not include a clear, machine-discoverable citation. Therefore, the results should be presented as an ‘index of public discourse uptake’ and used to identify high-impact qualitative case studies, rather than as a direct measure of societal change.
Indicator Soc2: transparency and accountability data provision
Intent and rationale
This indicator assesses the extent to which a Member State proactively publishes key datasets that are essential for public scrutiny and accountability. The core principle is that genuine transparency is a prerequisite for accountability. While Indicator Soc1 measures the use of data by accountability actors, this indicator measures the supply of the specific data assets they need most. This provides a structural, supply-side measure of a government’s commitment to transparency. Its design is based on internationally recognised categories of data that are fundamental for preventing corruption and ensuring the integrity of public decision-making, aligning with the goals of initiatives like the Open Government Partnership and the EU’s own anti-corruption directives.
Intervention logic
The causal pathway for this indicator is foundational. It begins with a government making a strategic decision to enhance transparency. The activity involves identifying and preparing key accountability datasets for publication as high-quality open data. The direct output is the availability of these specific datasets on a public portal in a machine-readable format. This indicator measures the completeness and quality of this output. The immediate outcome is the empowerment of journalists, CSOs and citizens with the raw material they need to perform scrutiny. This directly enables the accountability actions that Indicator Soc1 attempts to track, making this indicator a critical leading indicator for the entire transparency and accountability value chain.
Measurement protocol: practical
This protocol uses a straightforward audit of the national data portal to calculate a composite ‘national accountability data index’. The indicator is a score out of a possible 10 points. The score is calculated by assessing the availability and quality of five key accountability dataset categories. For each category, a score of 0, 1 or 2 is assigned:
- 0 points: the dataset is not available as open data;
- 1 point: the dataset is available, but only in a low-quality format (e.g. non-machine-readable PDFs, a web page without bulk download);
- 2 points: the dataset is available as high-quality, structured, machine-readable open data (e.g. CSV, JSON, API) and offers bulk download.
The five key accountability categories to be assessed are as follows.
- Public contracts. A searchable database of public tenders and awarded contracts, including supplier names and contract values (data source: national public procurement portal).
- Company and beneficial ownership register. A searchable database of registered companies, including their directors and, crucially, their ultimate beneficial owners (data source: national business register).
- Political party and campaign finance. A database of declared donations to political parties and election campaigns (data source: national electoral commission or equivalent).
- Lobbyist register. A public register of lobbyists, declaring whom they are lobbying for and on what topics (data source: national parliament or government ethics agency).
- Asset declarations of public officials. A database of the declared assets and financial interests of senior elected officials and ministers (data source: parliament or national ethics / anti-corruption agency).
The final score is the sum of the points for each of the five categories. This audit is to be conducted annually by the responsible authority.
The process is as follows.
- Audit the national data portal for the availability of five specific dataset categories: public contracts, company and beneficial ownership, political and campaign finance, lobbyist registers, and asset declarations of public officials.
- Assign a score of 0 if the dataset is unavailable, 1 if it is available only in a low-quality format (e.g. PDF), or 2 if it is available as structured, machine-readable open data offering bulk download.
- Sum the scores across the five categories to produce a final index score out of 10.
Measurement protocol: extended
The extended protocol enhances the practical method by automating the verification process and deepening the quality assessment. This would be enabled by an EU-level ‘accountability data schema’, a common metadata standard for these five key dataset types. Each Member State would be required to tag the relevant datasets on their national portal using this schema. The indicator would then be calculated automatically by a central harvesting service (e.g. European Data Portal) that would:
- verify the existence of a dataset tagged for each of the five categories;
- automatically assess the technical format of the linked data distributions to assign the 0–2 quality score;
- expand the assessment to include a timeliness score, automatically checking the ‘last modified’ date of the dataset to ensure the information is current and not just a historical snapshot.
The result would be a more dynamic, near real-time and fully comparable index of accountability data provision across the EU.
Analysis and interpretation
The final score (out of 10) provides a clear, comparable metric of a Member State’s structural commitment to transparency. The primary value for analysis lies in the component scores, which immediately reveal a country’s strengths and weaknesses (e.g. ‘strong on procurement transparency, but lagging on beneficial ownership data’). The key caveat remains that this is a supply-side indicator. It measures the potential for accountability, not the accountability itself. A country could publish all the required data, but if it is not used by media or CSOs, the impact is limited. Therefore, this indicator should be interpreted as a foundational measure and analysed alongside Indicator Soc1 to connect the supply of accountability data with the evidence of its actual use in public discourse.
Indicator Soc3: quality of decision-making by policymakers
Intent and rationale
This indicator assesses the statistical relationship between a Member State’s open data maturity and the perceived effectiveness of its governance. It addresses the challenge of measuring internal decision-making using a robust, externally validated proxy: the World Bank’s ‘government effectiveness’ indicator. This global metric captures expert and citizen perceptions of the quality of public services, policy formulation and the credibility of a government’s commitments. The core hypothesis is that as a country’s open data ecosystem matures, it enhances the analytical capacity, transparency and accountability of the state, which, over time, should be reflected in a higher score on this key governance indicator. This approach allows us to test the link between open data and better governance using existing, high-quality and internationally comparable data.
Intervention logic
The causal pathway for this indicator is systemic and long term. The intervention is not a single action but the cumulative effect of a mature national open data programme, encompassing policy, data quality, portal usability and the stimulation of reuse. A well-functioning open data ecosystem creates the enabling conditions for evidence-based policymaking to become embedded within the public administration. The outcome is a civil service that is more capable of using data for analysis, monitoring and evaluation. The final, measurable impact is an improvement in the overall quality of governance, as perceived by experts and citizens and captured by macro-level indicators like the worldwide governance indicators (WGIs). This indicator tests the strength of the association between the open data intervention and this high-level governance impact.
Measurement protocol: practical
The practical protocol is a straightforward correlational analysis that uses only two publicly available, pre-existing data points per Member State. The indicator is the ‘rank correlation between open data maturity and government effectiveness’. The process, conducted annually by the responsible authority, involves three simple steps:
- source the final, overall scores for all EU-27 Member States from the latest European Data Portal ODM report;
- source the corresponding percentile rank scores for the same 27 Member States from the latest World Bank WGIs, specifically for the ‘government effectiveness’ indicator;
- calculate the Spearman’s rank correlation coefficient between the two sets of national ranks.
This single statistical test, which can be run in any standard spreadsheet or statistics software, produces a coefficient between –1 and +1. A strong positive correlation (e.g. > 0.5) provides powerful, evidence-based and comparable support for the argument that more mature open data ecosystems are associated with more effective governments.
Measurement protocol: extended
The extended protocol moves from a simple correlation to a more sophisticated econometric model to better isolate the specific impact of open data. This approach is directly inspired by academic methodologies like those used by Alderete (2020). The indicator would be the ‘statistically estimated contribution of open data to government effectiveness’. This requires a dedicated research team (e.g. at a national university or the Commission’s Joint Research Centre) to maintain a multi-year panel data regression model. The model would be specified as follows.
- Dependent variable. The annual ‘Government Effectiveness’ score from the WGI.
- Key independent variable. A composite index of the ‘portal’ and ‘data quality’ dimensions of the ODM report, as these represent the most direct supply-side policy levers.
- Control variables. Other key determinants of government effectiveness must be included to isolate the effect of open data. These would include, at a minimum, GDP per capita, the WGI ‘rule of law’ indicator and national R & D expenditure as a percentage of GDP.
Running this model on a panel of EU-27 data over several years would allow for a much more robust estimation of the specific, independent contribution of open data maturity to governance quality.
Analysis and interpretation
The correlation coefficient from the practical method provides a clear, single figure for high-level communication. For deeper analysis, a scatter plot of the two variables should be produced to identify national outliers – countries with high open data maturity but lower-than-expected effectiveness, or vice-versa – which can be subjects for qualitative case study investigation. The most critical caveat, especially for the practical method, is that correlation does not prove causation. A positive association does not definitively mean open data causes better government; it could be that effective governments are simply more likely to implement good open data policies. However, it provides strong, quantitative and cross-nationally comparable evidence for the association between the two. It effectively shifts the burden of proof, making a powerful case that open data is a core characteristic of a modern, effective state.
Indicator Soc4: improved access to public services
Intent and rationale
This indicator measures the scale of citizen uptake of digital public services that are built upon open data. The core purpose is to quantify the reach of open data-driven tools that make it easier, faster or more effective for citizens to interact with the state. This directly assesses a key social impact: the contribution of open data to a more modern, accessible and user-centric public administration, which is a central goal of the EU’s Digital Decade policy programme. While Indicator 4.1 catalogues the existence of these services, this indicator goes a step further by estimating their user base, providing a tangible measure of their adoption and relevance to society.
Intervention logic
The causal pathway for this indicator begins with the output of a new, citizen-facing digital service built on open data (as documented in Indicator 4.1). This could be a public transport journey planner, a school finder application or a tool for locating public amenities. The key activity is a citizen’s decision to adopt and use this tool to meet a specific need. The direct outcome, which this indicator measures, is the aggregated user base of these services. The final, desired impact is a reduction in the administrative burden for citizens (e.g. time saved), improved equity of access to services and higher citizen satisfaction. The measured outcome (user base) serves as a powerful and practical proxy for the scale of this final impact.
Measurement protocol: practical
The practical protocol uses a bottom-up, evidence-based estimation of the ‘aggregate user base of key digital public service applications’. This method explicitly uses the output of Indicator 4.1 as its data collection frame and relies entirely on publicly available data, requiring no new surveys. The process, conducted annually by the responsible authority, has two steps.
- Identify key services. From the national reuse case repository (Indicator 4.1), identify the top 20 to 30 most significant, currently active, citizen-facing public service applications. Significance can be judged by the strategic importance of the service (e.g. health, education, transport) or if it is an officially promoted government application.
- Aggregate public metrics. For each identified service, collect its publicly available user metrics. For mobile applications, this is the number of installs as publicly displayed on the Google Play Store and Apple App Store (e.g. ‘100 000+ installs’). For web-based applications, this is the number of monthly or annual users, as often stated in the organisation’s own public annual reports, on their ‘About us’ page or in press releases.
The final indicator is the sum of the user/install numbers for these key services. This provides a conservative but evidence-based estimate of the minimum reach of open data-enabled public services.
The process is as follows.
- Identify the top 20 to 30 most significant, currently active citizen-facing public service applications from the national reuse case repository.
- Collect publicly available user adoption metrics for each identified service, such as the number of installs from mobile application stores or registered users reported on official websites.
- Sum the user and install numbers to produce a conservative aggregate user base for key digital public services.
Measurement protocol: extended
The extended protocol integrates this measurement directly into the EU’s existing, high-quality data collection on digital government, specifically the eGovernment Benchmark. This avoids creating a new data collection burden and ensures methodological consistency and comparability. The method involves augmenting the eGovernment Benchmark’s assessment of national digital public services. When a Member State’s service (e.g. its online tax declaration portal or unemployment service) is evaluated, a new binary question would be added: ‘Is this service powered by one or more publicly available open datasets or APIs?’ The final indicator would then be the ‘percentage of national eGovernment Benchmark services that are open data-enabled’, weighted by the usage rates for those services, which are already estimated as part of the benchmark. This would provide a highly robust, comparable and authoritative measure of the systemic integration of open data into core public service delivery.
Analysis and interpretation
The aggregate user base figure from the practical method should be presented with a clear list of the services included in the calculation. For cross-country comparison, it can be normalised per capita. Disaggregation of the user base by service type (e.g. transport, health, civic participation) is crucial for identifying where open data is having the most significant citizen-facing impact. The most important caveat is that this indicator measures reach and adoption, not the quality of experience or the ultimate societal impact. A download is not the same as active use or satisfaction. Therefore, the indicator should be presented as an ‘estimate of the user base for open data-enabled public services’ and used in conjunction with qualitative case studies (like those in the Use Case Observatory) to provide a richer narrative of how these services are improving citizens’ lives.
Indicator Soc5: public safety and emergency response
Intent and rationale
This indicator measures the tangible contribution of open data to improving the speed and effectiveness of emergency response services. Its purpose is to quantify some of the most profound social impacts of open data, such as faster medical assistance or more efficient emergency management. This indicator provides evidence for the ‘efficiency’ value-generating mechanism, but in a social, rather than purely economic, context. The Use Case Observatory provides powerful real-world examples, such as the EVapp in Belgium, which uses open data on defibrillator locations to enable citizen responders. This indicator seeks to build a systematic method for measuring the outcomes of such initiatives, providing a compelling, evidence-based argument for the role of open data in enhancing societal resilience and saving lives.
Intervention logic
The causal pathway begins with a public authority, such as an emergency service or health ministry, publishing a critical, often real-time, open dataset. Examples include the geographic coordinates of public-access defibrillators or live data on traffic incidents. This output enables the creation of a new tool or service (a reuse case, as per Indicator 4.1), such as a citizen-responder mobile application or an optimised routing algorithm for ambulances. The key activity is the use of this tool during a real emergency. The direct outcome is a measurable improvement in operational performance. The final, critical impact is a reduction in average response times, which is a key determinant of survival rates for incidents like cardiac arrest. This indicator measures that final impact on response time.
Measurement protocol: practical
The practical protocol is a before-and-after impact assessment focused on a single, high-impact, open data-driven intervention. This method is designed to be a targeted deep dive, not a national survey, using administrative data that emergency services already collect for their own performance management. The process, conducted by the responsible authority in collaboration with the relevant service, involves three steps.
- Identify an intervention. From the national reuse case repository (Indicator 4.1), select a single, significant public safety application and identify its precise date of implementation or large-scale rollout in a specific geographic area (e.g. the capital city region).
- Request administrative data. Formally request anonymised, aggregated performance data from the relevant emergency service (e.g. national ambulance service, fire department). The required data is the average response time for a specific, relevant incident type (e.g. ‘Category 1 cardiac arrest calls’) within the defined geography. Data is required for the 12-month period before the intervention and the 12-month period after.
- Calculate the impact. The indicator is the percentage change in average response time.
This event-based methodology provides a robust, evidence-based and highly practical measure of impact for a specific, transformative project.
Measurement protocol: extended
The extended protocol moves from measuring response time to measuring the ultimate health outcome: lives saved. This requires a more complex, but far more powerful, data linkage project between different public authorities. The indicator would be the ‘statistically estimated number of additional lives saved per year attributable to the open data intervention’. This would require a formal, privacy-compliant data-sharing agreement between the emergency service and the national health statistics authority. An econometric analysis would then be conducted on incident-level data, linking the response time for each specific incident to the final patient outcome (e.g. survival to hospital discharge) from a national patient registry. By modelling the relationship between response time and survival and combining this with the measured reduction in response times from the practical protocol, a statistically robust estimate of additional lives saved can be calculated. This can even be monetised using the official, nationally adjusted ‘value of a statistical life’ figures used in public health policy, creating a direct link to the economic value of social outcomes.
Analysis and interpretation
The result of this indicator is not a national average but a specific, case-based impact assessment (e.g. ‘The introduction of the CitySafe app correlated with a 7 % reduction in average ambulance response times for cardiac arrests in the capital region’). The primary caveat is causality. In the practical method, other factors could have influenced response times. While a strong temporal correlation is powerful evidence, it is not definitive proof. The extended method gets much closer to demonstrating causality by linking individual-level data. The findings should be presented as a case study, not a national statistic, but provide a powerful and compelling narrative. It demonstrates, with concrete data, that the reuse cases catalogued in Indicator 4.1 are not just applications, but interventions that can have a profound impact on citizens’ well-being.
Environmental impact indicators
The environmental impact indicators measure the contribution of open data to the goals of the European Green Deal and national environmental protection policies. They provide evidence for how data-driven tools and better governance can support climate action, sustainable resource management and the protection of biodiversity. The measurement protocol for these indicators addresses the challenge of attributing micro-level interventions to macro-level environmental changes. It does so through a dual approach. First, it uses practical, low-burden methods to measure the adoption of open data-driven tools by citizens and businesses, providing a verifiable proxy for the scale of engagement. Second, for the extended protocols, it combines this adoption data with established scientific and engineering models to produce credible, modelled estimates of the final environmental impact, such as tonnes of greenhouse gas (GHG) emissions saved. This provides a scientifically grounded method for connecting the publication of open data to a tangible contribution to a more sustainable future.
Indicator Env1: climate action and emissions reduction
Intent and rationale
This indicator estimates the contribution of open data to national and EU climate goals, such as those outlined in the European Green Deal, by measuring the scale and potential impact of data-driven tools that enable pro-environmental behaviours. Open data can empower businesses and citizens to make more sustainable decisions, for example in transport choices or energy consumption. This indicator aims to quantify the adoption of these tools as a primary proxy for their collective impact on reducing GHG emissions. It provides tangible evidence for how the open data ecosystem is contributing to one of the EU’s most critical policy priorities.
Intervention logic
The causal pathway begins with a public authority publishing relevant open datasets, such as building energy performance certificates, real-time public transport data or data on industrial emissions. This output enables the creation of reuse cases (as documented in Indicator 4.1), for example a mobile app helping commuters find the lowest-carbon route, or a web tool for businesses to benchmark their energy efficiency. The key activity is the adoption and use of these tools by citizens and businesses to inform their decisions. The direct outcome of this adoption is a change in behaviour at scale (e.g. a modal shift in transport, or investment in energy retrofitting). The final, desired impact is a measurable reduction in GHG emissions. This indicator provides a practical measure of the outcome (adoption) and a modelled estimate of the final impact (emissions reduction).
Measurement protocol: practical
The practical protocol is a bottom-up estimation of the ‘aggregate user base of climate action applications’. This method avoids dedicated surveys by using publicly available data and builds directly on the outputs of Indicator 4.1. The process, conducted annually by the responsible authority, involves two steps.
- Identify climate-action reuse cases. From the national reuse case repository (Indicator 4.1), create a specific list of all applications, tools and services for which the primary stated purpose is to help users reduce their carbon footprint or energy consumption.
- Aggregate public adoption metrics. For each identified reuse case, collect its publicly available adoption data. For mobile apps, this is the number of installs displayed on the Google Play Store and Apple App Store. For web-based tools and platforms, this is the number of registered users or clients as stated on their official website or in their public reports.
The final indicator is the sum of these user and install numbers. This provides a simple, verifiable and conservative estimate of the minimum scale of citizen and business engagement with open data-driven climate tools.
Measurement protocol: extended
The extended protocol moves from measuring adoption to estimating the actual environmental impact by creating a ‘modelled GHG emissions reduction estimate’. This method combines the user numbers from the practical protocol with existing, authoritative scientific models, avoiding the need for new citizen surveys. The formula is: estimated GHG reduction = Σ (number of active users for each service * modelled GHG impact per user action). The process is as follows.
- For each major reuse case identified in the practical step, identify the specific behavioural change it encourages (e.g. ‘shifting one 10-km journey per week from a car to a train’, or ‘insulating a home’).
- Source a credible, existing impact factor for that specific action from an authoritative source, such as the national environmental agency, a university research paper, or an official EU-level model. For example, the emissions saving per passenger-kilometre of a modal shift from car to rail.
- Multiply the number of active users by the relevant impact factor to estimate the total GHG saving attributable to that service.
- The final indicator is the sum of the estimated savings across all major identified services.
This approach provides a scientifically grounded estimate of the order of magnitude of the impact, without the impracticality of surveying every individual user.
Analysis and interpretation
The estimated GHG reduction should be disaggregated according to the sector of activity (e.g. transport, buildings, industry) to identify where open data is proving most effective. The primary and most critical caveat is that this is a modelled estimate, not a direct measurement of atmospheric GHG concentrations. Its accuracy is entirely dependent on the quality of the user numbers and the validity of the scientific models used for the impact factors. Therefore, the results must always be presented with full transparency about the assumptions made (e.g. ‘assuming 20 % of installed app users are active monthly’). This indicator does not prove causality in a strict sense, but it provides a powerful, evidence-based estimation that connects the dots from open data publication to a tangible contribution to efforts to adapt to climate change.
Indicator Env2: sustainable resource management
Intent and rationale
This indicator estimates the contribution of open data to more sustainable resource management, particularly in the domains of energy, water and the circular economy. The purpose is to measure how open data enables efficiency gains and behavioural changes that lead to reduced consumption of finite resources and a decrease in waste. This provides direct evidence for the role of open data in supporting key objectives of the European Green Deal beyond just GHG emissions, such as the circular economy action plan. The availability of granular, real-time open data on resource use (e.g. electricity grid load, water consumption levels) allows for the creation of innovative tools that empower both utility providers and consumers to optimise their behaviour and reduce waste.
Intervention logic
The causal pathway begins with a public or regulated private utility publishing open data on resource status or consumption. This could be real-time data from an electricity grid operator, water level data from a water authority, or data on municipal waste collection. This output enables the creation of new tools and services (reuse cases, as per Indicator 4.1). Examples include smart home applications that advise users on when to run appliances to use off-peak, renewable energy, or platforms that help businesses optimise their waste management and participate in the circular economy. The key activity is the use of these tools by citizens and businesses. The direct outcome is a measurable improvement in resource efficiency at the micro-level (e.g. a household shifting its energy load, a business reducing its waste to landfill). The final, desired impact is an aggregate reduction in national resource consumption or waste generation.
Measurement protocol: practical
The practical protocol, analogous to Env1, uses a bottom-up estimation of the ‘aggregate user base of resource management applications’. This method leverages Indicator 4.1 as its starting point and relies on publicly available data. The process, conducted annually by the responsible authority, has two steps.
- Identify resource management reuse cases. From the national reuse case repository (Indicator 4.1), create a specific list of all applications and services for which the primary purpose is to help users manage energy, water or waste more efficiently.
- Aggregate public adoption metrics. For each identified service, collect its publicly available adoption data, such as the number of installs from the Google Play Store and Apple App Store for mobile apps, or the number of registered users or clients as stated on the company’s website or in public reports.
The final indicator is the sum of these user and install numbers, disaggregated according to resource type (energy, water, circular economy). This provides a verifiable, conservative estimate of the scale of citizen and business engagement.
Measurement protocol: extended
The extended protocol creates a ‘modelled resource savings estimate’ by combining the adoption data from the practical protocol with established engineering or environmental models. The formula is: estimated resource saving = Σ (number of active users for each service * modelled resource saving per user). The process mirrors the extended approach for Env1.
- For a sample of high-impact reuse cases, identify the specific behavioural change or efficiency gain enabled by the tool (e.g. ‘a 5 % average reduction in household electricity use’, or ‘a 10 % diversion of commercial waste from landfill to recycling’).
- Source a credible impact factor for this gain from an authoritative source. This is crucial: instead of surveying users, this method relies on existing data. For example, a national energy agency may have already published studies on the average savings from smart meter feedback, or a waste authority may have data on the effectiveness of certain recycling schemes. These existing, officially validated figures are used as the multiplier.
- Multiply the number of active users of the tool by this pre-existing impact factor to estimate the total resource saving.
- The final indicator is the sum of estimated savings across the major identified services, expressed in physical units (e.g. tonnes of waste diverted, kWh of electricity saved).
Analysis and interpretation
The estimated resource savings should be disaggregated by resource type to align with specific policy goals. The primary caveat is that this is a modelled estimate, not a direct physical measurement. The quality of the estimate is entirely dependent on the accuracy of the user numbers and the robustness of the pre-existing impact factors used. All assumptions must be stated transparently (e.g. ‘This estimate assumes that the efficiency gains observed in the national energy agency’s 2023 smart meter pilot study are applicable to the user base of this application’). It is also crucial to avoid double-counting; an energy saving that reduces GHG emissions should not be counted separately here and in Indicator Env1’s final impact assessment without clear acknowledgement of the overlap. The indicator provides a powerful, evidence-based estimation of how the open data ecosystem contributes to the tangible goals of a more sustainable, circular economy.
Indicator Env3: biodiversity and ecosystem health
Intent and rationale
This indicator measures the extent to which open data is used to monitor and protect biodiversity and ecosystem health. The purpose is to provide evidence for the role of open data in supporting national and EU-level environmental protection goals, such as the EU biodiversity strategy. Open data, particularly geospatial and earth observation data from sources like Copernicus, provides a powerful tool for conservation organisations, researchers and public authorities to track land use change, monitor protected areas and identify threats to biodiversity. This
Indicator Env4: timeliness and quality of core environmental reporting
Intent and rationale
This indicator assesses the performance of the national environmental governance system by measuring the timeliness, granularity and accessibility of legally mandated public environmental datasets. The purpose is to use the quality of the data output itself as a direct, evidence-based proxy for the capability of the underlying governance system. A regulatory body that can publish detailed, machine-readable data on time is demonstrating a high level of operational capacity. This aligns with the principles of the Aarhus Convention, which establishes that access to high-quality and timely environmental information is a prerequisite for public participation and access to justice. This indicator, therefore, provides a tangible and comparable measure of a Member State’s capacity for transparent and data-driven environmental management.
Intervention logic
The causal pathway for this indicator is foundational. It begins with the legally mandated activity of environmental monitoring and reporting by regulatory agencies. The direct output is the published dataset. This indicator measures the core qualities of this output: was it published on time, is it detailed enough to be useful for scrutiny and is it in a format that allows for analysis? The immediate outcome is the empowerment of civil society, researchers and the public with the specific, timely data needed to hold polluters and government to account. This directly enables the accountability actions that other indicators attempt to capture, making this indicator a critical leading indicator for the entire environmental governance value chain.
Measurement protocol: practical
The practical protocol uses a targeted audit of a small number of critical, legally mandated environmental datasets to calculate a composite ‘core environmental governance data index’. The indicator is a score out of a possible 6 points, calculated by assessing three key dataset categories. For each category, a score of 0, 1 or 2 is assigned:
- 0 points: the dataset is not available as open data, or its latest version is more than 12 months out of date relative to its official reporting period;
- 1 point: the dataset is available, but is either significantly delayed (6–12 months late) or is only published in a low-quality, non-machine-readable format (e.g. an aggregated PDF report);
- 2 points: the dataset is published in a timely manner (within 6 months of the end of the reporting period), is machine-readable (e.g. CSV, API) and provides granular, facility-level or location-specific data.
The three core accountability categories to be assessed are as follows.
- Industrial emissions. Data from the national pollutant release and transfer register (data source: national environmental agency portal).
- Air quality. Historical monitoring data for key pollutants (e.g. PM2.5, NO2) from the national reference monitoring network (data source: national environmental agency or air quality portal).
- Water quality. Monitoring data on the ecological and chemical status of water bodies under the Water Framework Directive (data source: national environmental agency or water portal).
This annual audit, conducted by the responsible authority, is highly practical as it requires checking only three specific, well-known datasets for two clear criteria.
Measurement protocol: extended
The extended protocol automates the measurement and creates a more dynamic metric. The indicator becomes the ‘average publication lag for mandated environmental datasets’, measured in days. This requires a central EU registry (e.g. maintained by the European Environment Agency) where each Member State registers the URL for its national publications for the three core datasets. An automated script would then run monthly, checking each URL to programmatically read the ‘last modified’ date and the ‘reporting period’ from the dataset’s metadata. The script would automatically calculate the time difference in days between the end of the reporting period and the publication date. This would generate a fully automated, objective and comparable metric of the administrative efficiency and transparency of each Member State’s environmental reporting system.
Analysis and interpretation
The final score (out of 6) provides a clear, comparable metric of a government’s operational capacity for environmental governance. The primary value for analysis lies in the component scores, which immediately reveal a country’s strengths and weaknesses. For a more comprehensive national self-assessment, Member States with greater capacity may wish to expand this audit to include other legally mandated datasets, such as data on bathing water quality, Natura 2000 protected areas or municipal waste management, applying the same 0–2 scoring methodology. The key caveat is that this is an indicator of process capability, not a direct measure of enforcement effectiveness or of the ultimate quality of the environment itself. A poor score on this indicator, however, is a clear signal of a fundamental weakness in the national environmental governance system.
Strategic impact indicators
The strategic impact indicators provide a high-level, geopolitical perspective on a Member State’s open data ecosystem. Their purpose is to assess the contribution of the national open data programme to the Union’s overarching strategic objectives of international competitiveness, digital sovereignty and leadership in key technologies like artificial intelligence. These are not operational metrics, but macro-level indicators designed for a senior policy audience. The measurement protocols leverage existing, authoritative international benchmarks, such as the Organisation for Economic Co-operation and Development’s (OECD) OURdata Index and supplement them with targeted analysis of national data to assess the global position of the Member State’s ecosystem. They provide a crucial link between the detailed, ground-level performance of the open data programme and the high-level strategic priorities of the EU.
Indicator Strat1: international competitiveness
Intent and rationale
This indicator measures the international standing of the EU’s collective open data ecosystem by benchmarking Member State performance against global peers using established, third-party indices. The purpose is to provide an external, objective assessment of the EU’s progress towards its strategic goal of leadership in the data-driven economy. A strong performance in global rankings acts as a powerful signal of a mature, well-governed and innovative data environment. This can attract foreign investment, foster cross-border research collaboration and strengthen the EU’s position as a global standard-setter in digital policy. This indicator aggregates individual Member State performance to provide a composite view of the EU’s collective competitive strength.
Intervention logic
The causal pathway for this indicator operates at the macro level, aggregating the outputs of the entire framework. The combined activities of all 27 Member States in implementing open data policies, publishing high-quality datasets (especially HVDs) and ensuring technical accessibility (as measured by the supply and quality indicators) result in the creation of a mature, pan-European open data ecosystem. This ecosystem is then periodically assessed by independent, international organisations. The direct, measurable outcome is the set of scores and rankings assigned to Member States in these global reports. This indicator is the synthesis of that outcome. The final, desired impact is an enhanced strategic and economic position for the EU in the global data economy, making it a more attractive and competitive location for data-driven innovation.
Measurement protocol: practical
The practical protocol is a straightforward compilation of existing, publicly available data from an authoritative international source. The indicator is the ‘average EU-27 score and rank in the OECD OURdata Index’. The process, to be conducted upon each new release of the index by the responsible authority, involves two simple steps.
- Source the official scores and ranks for all 27 EU Member States from the latest edition of the OECD’s OURdata (open–useful–reusable government data) Index.
- Calculate the simple arithmetic mean of these scores to produce an ‘EU-27 average score’. For context, the median rank of the EU-27 Member States should also be reported.
This method is highly practical as it requires no new data collection and relies on a credible, methodologically transparent and internationally recognised benchmark. It provides a direct comparison against other major economies such as the United States, United Kingdom and South Korea.
Measurement protocol: extended
The extended protocol would move beyond a policy-input-based index to a more dynamic, outcome-focused measure of the EU’s global innovation share. The indicator would be a composite ‘global open data innovation share index’, combining two key metrics derived from the methodologies of Indicators Econ4 and 4.2.
- Share of global investment. Using global data from sources like Dealroom.co, calculate the total venture capital invested in identified open data companies worldwide. The metric is the EU-27’s percentage share of this global total.
- Share of global knowledge creation. Using global data from bibliometric services like DataCite and Scopus, calculate the total number of academic publications worldwide that formally cite open government datasets. The metric is the EU-27’s percentage share of these global citations.
This approach would measure the EU’s actual output and performance in the global race for data-driven innovation, providing a much stronger signal of true competitiveness than a policy-based index.
Analysis and interpretation
The average score from the practical method provides a clear, high-level benchmark. For actionable policy insights, the analysis must be disaggregated. A table should be produced showing the scores for each of the OURdata Index’s three pillars (data availability, data accessibility and government support for reuse) for each Member State. This allows for the identification of systemic strengths and weaknesses across the EU (e.g. ‘The EU excels in data availability but lags in government support for reuse’). The primary caveat of the practical method is that the OURdata Index, while excellent, primarily measures government policies and self-reported actions, not their on-the-ground impact. It is a measure of effort more than effect. A high ranking is a positive achievement but does not automatically equate to a larger open data economy. The indicator is a strategic benchmark that should be used to inform high-level policy, not as a direct measure of economic value.
Indicator Strat2: digital sovereignty and strategic risk
Intent and rationale
This indicator provides a measure of the EU’s strategic autonomy in the open data ecosystem by analysing the geographic patterns of data consumption. It assesses two complementary aspects: first, the share of data demand originating from within the EU, which serves as a proxy for the vibrancy of the domestic digital single market; and second, the identification of large-scale, concentrated data harvesting by non-EU actors, which can signal a strategic risk. The purpose is to provide policymakers with a data-driven view of who is consuming their national data assets, enabling a more informed approach to digital sovereignty that balances the goal of fostering a strong internal market with the need to manage external dependencies and vulnerabilities.
Intervention logic
This indicator directly measures the ‘uptake’ phase of the value chain, disaggregated according to geography. The causal pathway begins with the publication of open datasets and APIs. These are then discovered and consumed by users from around the world. The direct, measurable output is a download or an API call, which is logged by the portal’s servers along with its geographic origin (derived from the user’s IP address). This indicator is the analysis of these logs. The outcome is a clear picture of the global demand for a Member State’s data. This allows for two distinct interpretations: a high share of intra-EU data flows suggests a well-functioning digital single market, while highly concentrated extra-EU data flows may represent a strategic risk that warrants further investigation.
Measurement protocol: practical
The practical protocol uses standard web and API analytics that most portals already have in place. It produces two distinct metrics on a quarterly basis, using data from the responsible authority’s portal analytics platform.
- Intra-EU consumption share (%). This metric measures the proportion of data consumption originating from within the EU. The formula is: ((total downloads + API calls from EU IP addresses) divided by (total downloads + API calls from all IP addresses)) multiplied by one hundred. This requires the portal’s analytics to be configured with a standard GeoIP look-up service to determine the country of origin for each request.
- Anomalous harvesting index. This is a qualitative assessment based on a review of the portal’s traffic logs. The portal’s technical team will conduct a quarterly review to identify anomalous patterns. The key signal to look for is high-volume, concentrated harvesting from a single, non-EU corporate or state-level entity. This is identified by a very large number of downloads or API calls originating from a small, contiguous block of IP addresses registered to a single non-EU organisation. The indicator is a simple qualitative score: green (no such activity detected); amber (some concentrated harvesting detected, requires monitoring); or red (significant, potentially strategic harvesting detected, requiring policy-level review by the national cybersecurity agency).
Measurement protocol: extended
The extended protocol provides a more sophisticated, real-time and automated assessment of strategic risks. It would involve integrating the national portal with an AI-driven web application firewall and threat intelligence platform. This platform would move beyond simple IP address look-ups to provide in-depth traffic analysis. The metrics would become automated and dynamic.
- Automated bot and crawler detection. The system would automatically distinguish between human-driven consumption and large-scale, automated harvesting by bots and crawlers, providing a much clearer picture of strategic versus casual use.
- Real-time threat intelligence feed. The platform would cross-reference the IP addresses of high-volume harvesters against global threat intelligence feeds, automatically identifying if the activity originates from known state-sponsored actors or commercial data brokers.
- Dynamic alerting system. The system would be configured with dynamic thresholds to automatically generate a ‘red’ alert and notify the national cybersecurity agency in real time when a predefined level of strategic harvesting from a high-risk source is detected.
Analysis and interpretation
The ‘intra-EU consumption share’ provides a key performance indicator for the digital single market. A high and growing share is a positive sign of a healthy internal data ecosystem. The ‘anomalous harvesting index’ is a risk signal for policymakers. It is critical to interpret these metrics with nuance. A high level of consumption from a non-EU country is not inherently negative; it may signal the global value of the data for international research or legitimate business. The purpose of the indicator is not to discourage international use, but to identify concentrated, large-scale and potentially strategic harvesting that warrants a specific policy and security review. The results should be used to inform a sophisticated discussion about the balance between openness and strategic autonomy, not to justify simplistic data localisation policies.
Indicator Strat3: leadership in AI
Intent and rationale
This indicator measures the extent to which a Member State’s open data assets are being used to develop and train AI models. Its purpose is to assess the contribution of the national open data programme to the AI ecosystem, a critical driver of future economic growth and technological sovereignty under the EU’s AI Act and data strategy. High-quality, large-scale and machine-readable public datasets, particularly the legally mandated HVDs, are a fundamental sovereign resource for training and validating AI. This indicator provides a tangible measure of whether this potential is being realised, providing evidence of a ‘home-grown’ AI innovation ecosystem that leverages public assets.
Intervention logic
The causal pathway for this indicator begins with the strategic publication of ‘AI-ready’ open data. This specifically refers to large, well-structured, machine-readable datasets and real-time data streams via APIs. This output enables reuse by AI developers and data scientists. The key activity is the use of this data as a primary training, testing or validation set for a new AI / machine learning (ML) model. The direct outcome is a new AI-powered application, a piece of academic research or a commercial service, which are documented as reuse cases (as per Indicator 4.1). This indicator measures the volume and nature of these specific AI-related outcomes, which are the essential building blocks of the AI economy.
Measurement protocol: practical
The practical protocol leverages the existing data collection work of this framework, focusing on a qualitative analysis of the national reuse case repository. The indicator is the ‘Annual count and analysis of documented AI/ML reuse cases’. This method builds directly on Indicator 4.1 (Volume and thematic distribution of reuse cases). The process, conducted annually by the responsible authority, involves the following two steps.
- Identification. Systematically audit the national reuse case repository established for Indicator 4.1. Using a standardised list of keywords (‘artificial intelligence’, ‘AI’, ‘machine learning’, ‘ML’, ‘neural network’, ‘computer vision’, ‘LLM’, ‘generative AI’), identify all reuse cases that self-declare as being AI-driven.
- Classification. For each identified AI reuse case, perform a brief analysis based on its description to classify it by its primary function (e.g. predictive analytics, computer vision, natural language processing) and by the type of open data it consumes (e.g. transport, health, geospatial).
The output is not just a single number, but a concise annual report detailing the number of AI reuse cases, their primary applications and the key open datasets that are fuelling them. This provides rich, actionable intelligence.
Measurement protocol: extended
The extended protocol moves beyond self-reported cases to a strategic, supply-side assessment of the nation’s most critical data assets. The indicator is an ‘AI-readiness score for high-value datasets’. This measures the fitness-for-purpose of the datasets that are legally mandated to be most important for the EU economy. The responsible authority, in collaboration with data science experts, would conduct an annual audit of the national HVDs against a common rubric, assigning a score (e.g. 0–3) for each of the following criteria.
- Volume and granularity. Is the dataset sufficiently large and detailed for meaningful model training? (e.g. millions of rows, not just aggregated summaries).
- Machine readability and API access. Is the data provided in bulk-downloadable, structured formats and, crucially, via a stable, well-documented API? (Directly links to Indicator 2.4).
- Data quality and standardisation. Does the metadata include a data dictionary? Are data fields standardised and using controlled vocabularies where appropriate?
- Permissive licensing. Is the licence explicitly clear that the data can be used for training commercial AI systems without ambiguity?
The final output is a score for each HVD, creating a national dashboard that highlights which strategic data assets are truly ‘AI-ready’ and which require further investment.
Analysis and interpretation
The practical method’s output provides a direct list of ‘success stories’ and identifies the most valuable datasets for the current AI ecosystem. The extended method’s output provides a strategic roadmap, identifying which HVDs need technical or legal improvements to unlock their AI potential. The primary caveat is that both methods will undercount the full extent of commercial AI development, much of which is proprietary. However, they provide a strong, evidence-based measure of the public and research-facing AI ecosystem. A growing number of AI reuse cases, or a rising AI-readiness score for the nation’s HVDs, serves as a powerful leading indicator of the country’s future competitiveness and leadership in the AI domain.
[1] See, for example, the 2025 Open Data Maturity Report, https://data.europa.eu/en/open-data-maturity/2025.
[2] Directive (EU) 2019/1024 of the European Parliament and of the Council of 20 June 2019 on open data and the re-use of public sector information (OJ L 172, 26.6.2019, p. 56, ELI: http://data.europa.eu/eli/dir/2019/1024/oj).
[3] Commission Implementing Regulation (EU) 2023/138 of 21 December 2022 laying down a list of specific high-value datasets and the arrangements for their publication and re-use (OJ L 19, 20.1.2023, p. 43, ELI: http://data.europa.eu/eli/reg_impl/2023/138/oj) (‘HVD Implementing Regulation’).
[4] Data collection dates: Estonia (21.1.2026), Italy (21.1.2026), Netherlands (21.1.2026), Poland (21.1.2026).
[5] data.europa.eu values of publication volume of national open data portals collected on 21.1.2026.
[6] data.europa.eu publication growth reflects the change between January 2025 and January 2026; values include all catalogues of Member States, not primarily the national open data portals, https://data.europa.eu/catalogue-statistics/evolution/countries?locale=en. For Estonia, the observed growth is driven by the recent harvesting from the national catalogue into data.europa.eu and therefore does not provide a meaningful representation of actual publication growth.
[7] National portal publication growth for Italy reflects the change between December 2024 and December 2025.
[8] National portal publication growth for Poland reflects the change between December 2024 and December 2025.
[9] Data comes from the latest official reporting of HVDs on 9.2.2025 in accordance with Article 5 of the HVD Implementing Regulation.
[10] The MQA scores were directly retrieved from data.europa.eu; however, the current MQA methodology has known limitations and is under revision. As a result, the scores should be interpreted with caution, as they may not fully reflect metadata quality in a precise or comparable manner across Member States.
[11] Data was retrieved on 21.1.2026 from https://data.europa.eu/mqa/?locale=en.
[12] https://andmed.eesti.ee/usage-stories.
[13] https://data.overheid.nl/impact.
[14] https://dane.gov.pl/pl/showcase?page=2&per_page=50&q=&ate.
[15] You can access this information at https://data.europa.eu/en/publications/open-data-impact.
[16] Commission staff working document, Impact assessment report accompanying the document Commission Implementing Regulation laying down a list of specific high-value datasets and the arrangements for their publication and re-use, SWD(2022) 433 final, 21 December 2022.
[17] Commission staff working document, Impact assessment report accompanying the document Commission Implementing Regulation laying down a list of specific high-value datasets and the arrangements for their publication and re-use, SWD(2022) 433 final, 21 December 2022.
[18] Commission staff working document, Impact assessment report accompanying the document Commission Implementing Regulation laying down a list of specific high-value datasets and the arrangements for their publication and re-use, SWD(2022) 433 final, 21 December 2022.
[19] https://riigihanked.riik.ee/rhr-web/#/.
[20] https://ariregister.rik.ee/eng.
[21] https://www.erjk.ee/et/aruanded/erakondade-tulud-ja-laekumised.
[23] https://maasikas.emta.ee/v1/login?authst=HTtZHFd0Iu; https://www.emta.ee/eraklient/e-teenused-maksutarkus/registrid-paringud/huvide-deklaratsioon.
[24] https://dati.anticorruzione.it/opendata/dataset.
[25] https://hvdataset.infocamere.it/#/home.
[26] https://parlamento18.camera.it/199.
[27] https://rappresentantidiinteressi.camera.it/sito/registro.html.
[28] https://www.parlamento.it/1233.
[29] https://www.tenderned.nl/cms/nl.
[30] https://www.kvk.nl/en/.
[32] https://www.rijksoverheid.nl/regering/bewindspersonen; https://www.tweedekamer.nl/kamerleden_en_commissies/openbare_registers.
[33] https://andmed.eesti.ee/datasets/ettevotete-jaatmete-aastaaruandlus.
[34] https://andmed.eesti.ee/datasets/inspire-%28pf%29-eesti-heiteallikad-ohku-%28wfs%29.
[35] https://andmed.eesti.ee/datasets/loodusliku-mineraalvee-ja-allikavee-allikate-veeproovid.
[37] https://www.snpambiente.it/notizie/snpa/qualita-dellaria-nel-2024/.
[38] https://sinacloud.isprambiente.it/portal/apps/dashboards/3474e8845159409394fa22231b862add.
[39] https://www.emissieregistratie.nl/.
[40] https://data.rivm.nl/data/luchtmeetnet/.
[41] https://www.clo.nl/indicatoren/nl143809-waterkwaliteit-krw-2022.