Some concepts used in cognitive load theory for education can be translated very well into concepts to use in data visualisation. Here are some examples.
Pre-teaching is a teaching strategy that involves teaching students a vocabulary before the actual lesson starts. In this way the content of a lesson can build on top of the now-familiar new vocabulary, and the intrinsic cognitive load of the new content is not added to the one from the vocabulary.
In data visualisation this can translate into making sure that people understand how to read a chart before filling the chart with the actual data the story is about.
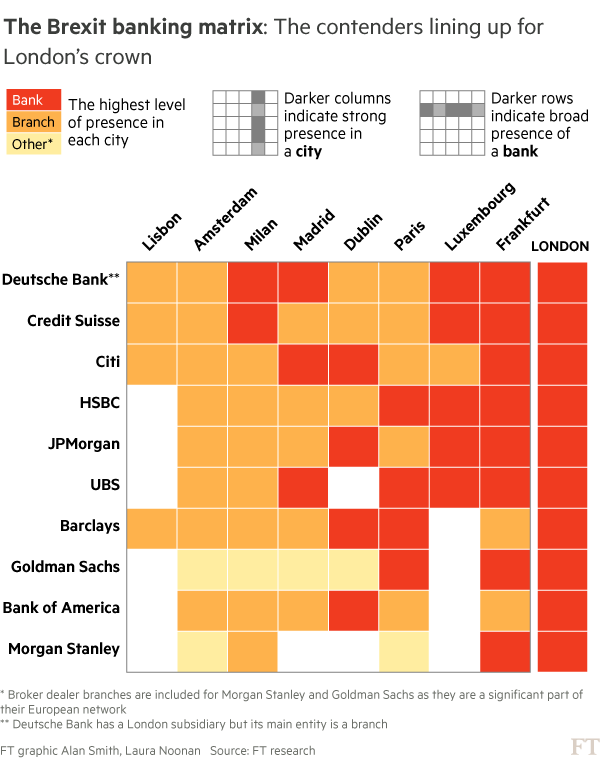
An example of pre-teaching in data visualisation: before the graphic is shown, the colours, rows and columns are explained. Source: Frankfurt vies for UK banking jobs post-Brexit, ft.com
Pre-teaching can work well in combination with chunking. Chunking means splitting up a bigger piece of complex content into smaller bits that are more easily understood on their own. Later on, all the chunks of information are combined again to show how they are related and what the bigger picture looks like. Instead of showing a bubble chart in one go, you could “chunk it up” and first explain what the x and y axes means, then what the colours mean, and finally what the size of the bubbles mean.
The split attention effect occurs when readers are required to split their attention between two or more mutually dependent sources of information. This can be a piece of text and a visualisation, which have been separated either spatially (on a page) or temporally (in a video or animation). In order to be effective, the separate sources of information should be integrated into a single, stand alone piece of information. This means that units and other contextual information should be integrated into a visualisation (see higher), and that direct labelling is preferred over using separate colour legends.
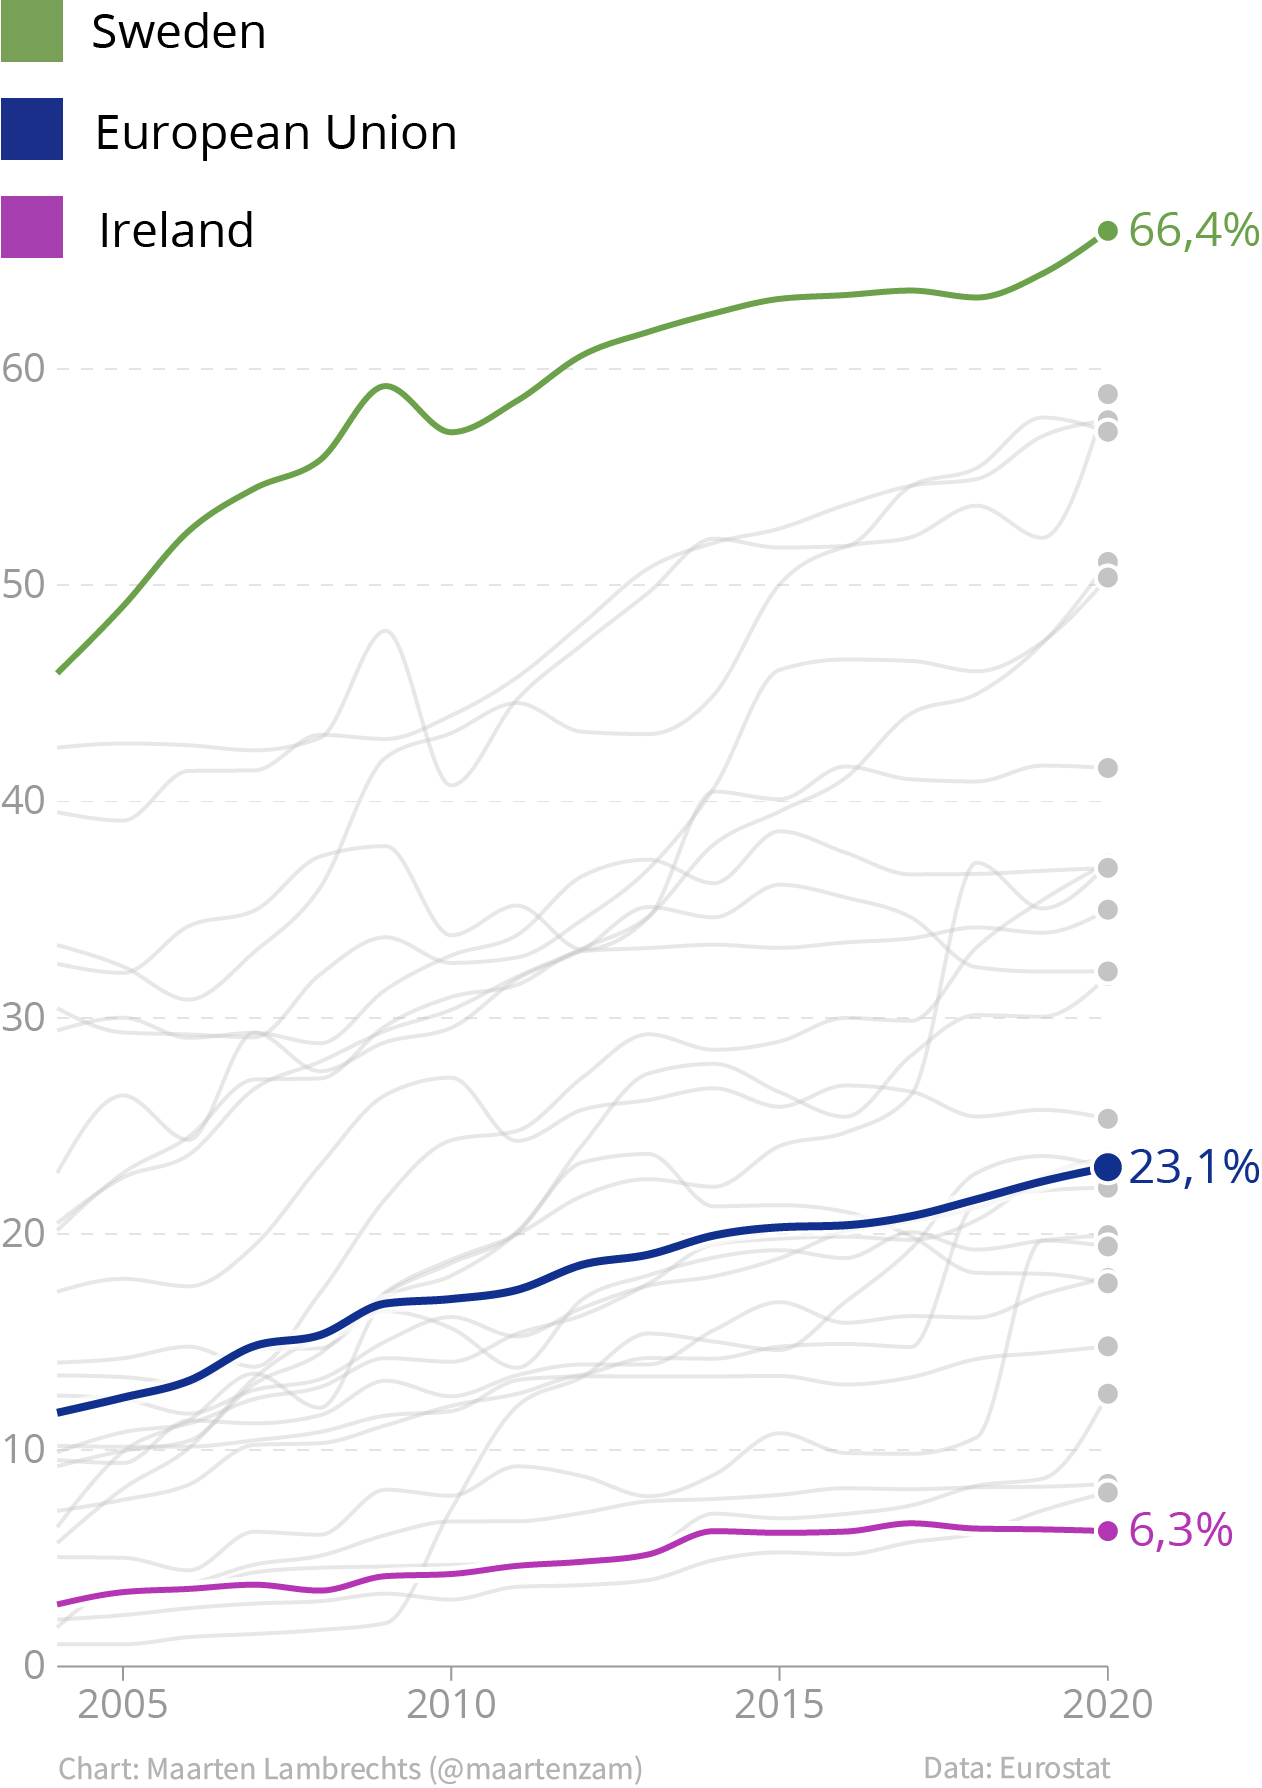
A separate colour legend vs directly labelled lines. Source: Maarten Lambrechts, CC-BY 4.0
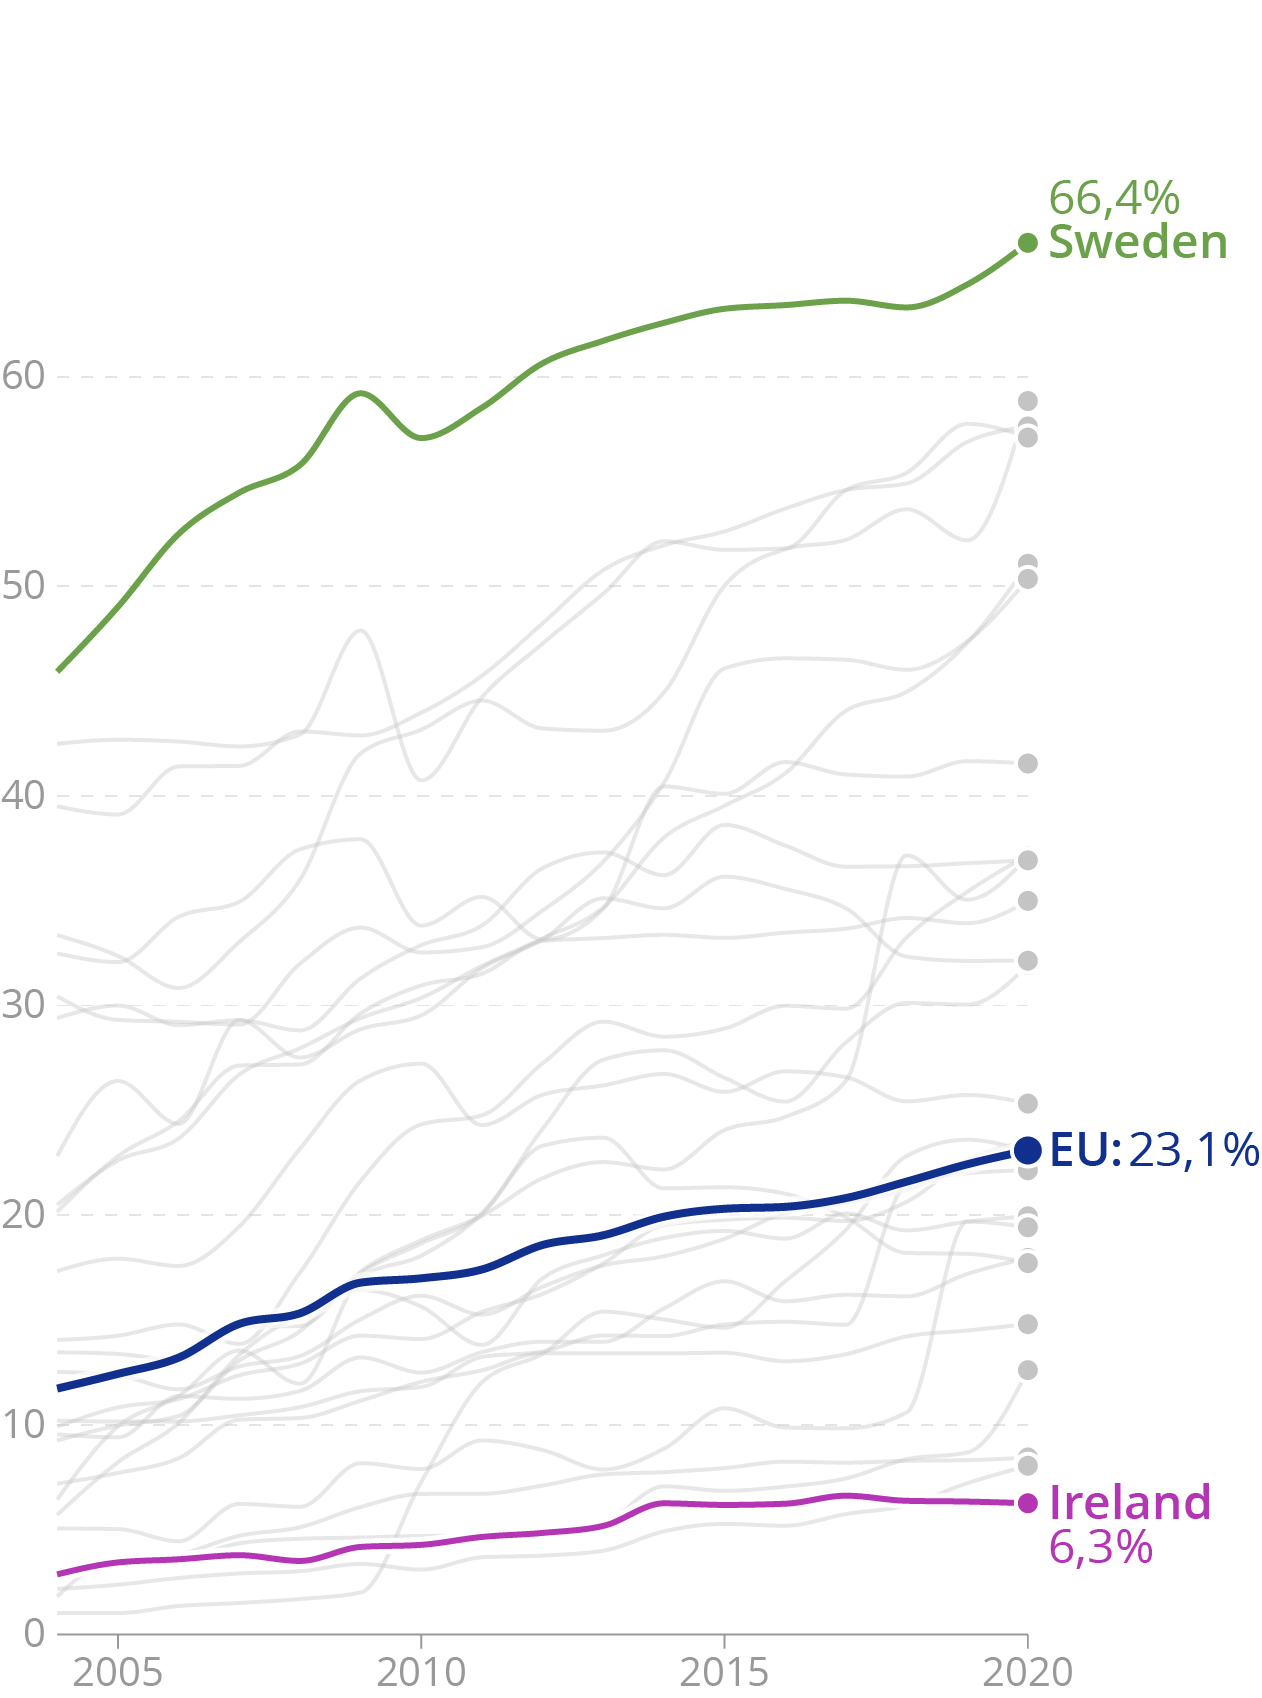
Source: Maarten Lambrechts, CC-BY 4.0