Extraneous cognitive load is the cognitive load that results from the way the new information is presented. In contrast to intrinsic load, extraneous load is under the control of the designer of the educational material, or of the data visualisation.
In most cases you want to minimise total cognitive load, to make it as easy as possible for your audience. This implies that extraneous load needs to be minimised.
One important aspect to realise here is that data visualisation itself is a very powerful tool to minimise extraneous load. Data presented in a visual form has a much lower extraneous load than data presented in the form of a data table, a list or a description of the data in the form of text. Lowering the extraneous load is the raison d’être of data visualisation.
But within data visualisation, there are a lot of degrees of freedom that can be optimised for a lower extraneous load.
The low hanging fruit here is horizontal versus vertical text. Text is meant to be read horizontally (at least in left-to-right scripts like the roman script), so any non-horizontal text introduces extraneous load, and should be avoided.
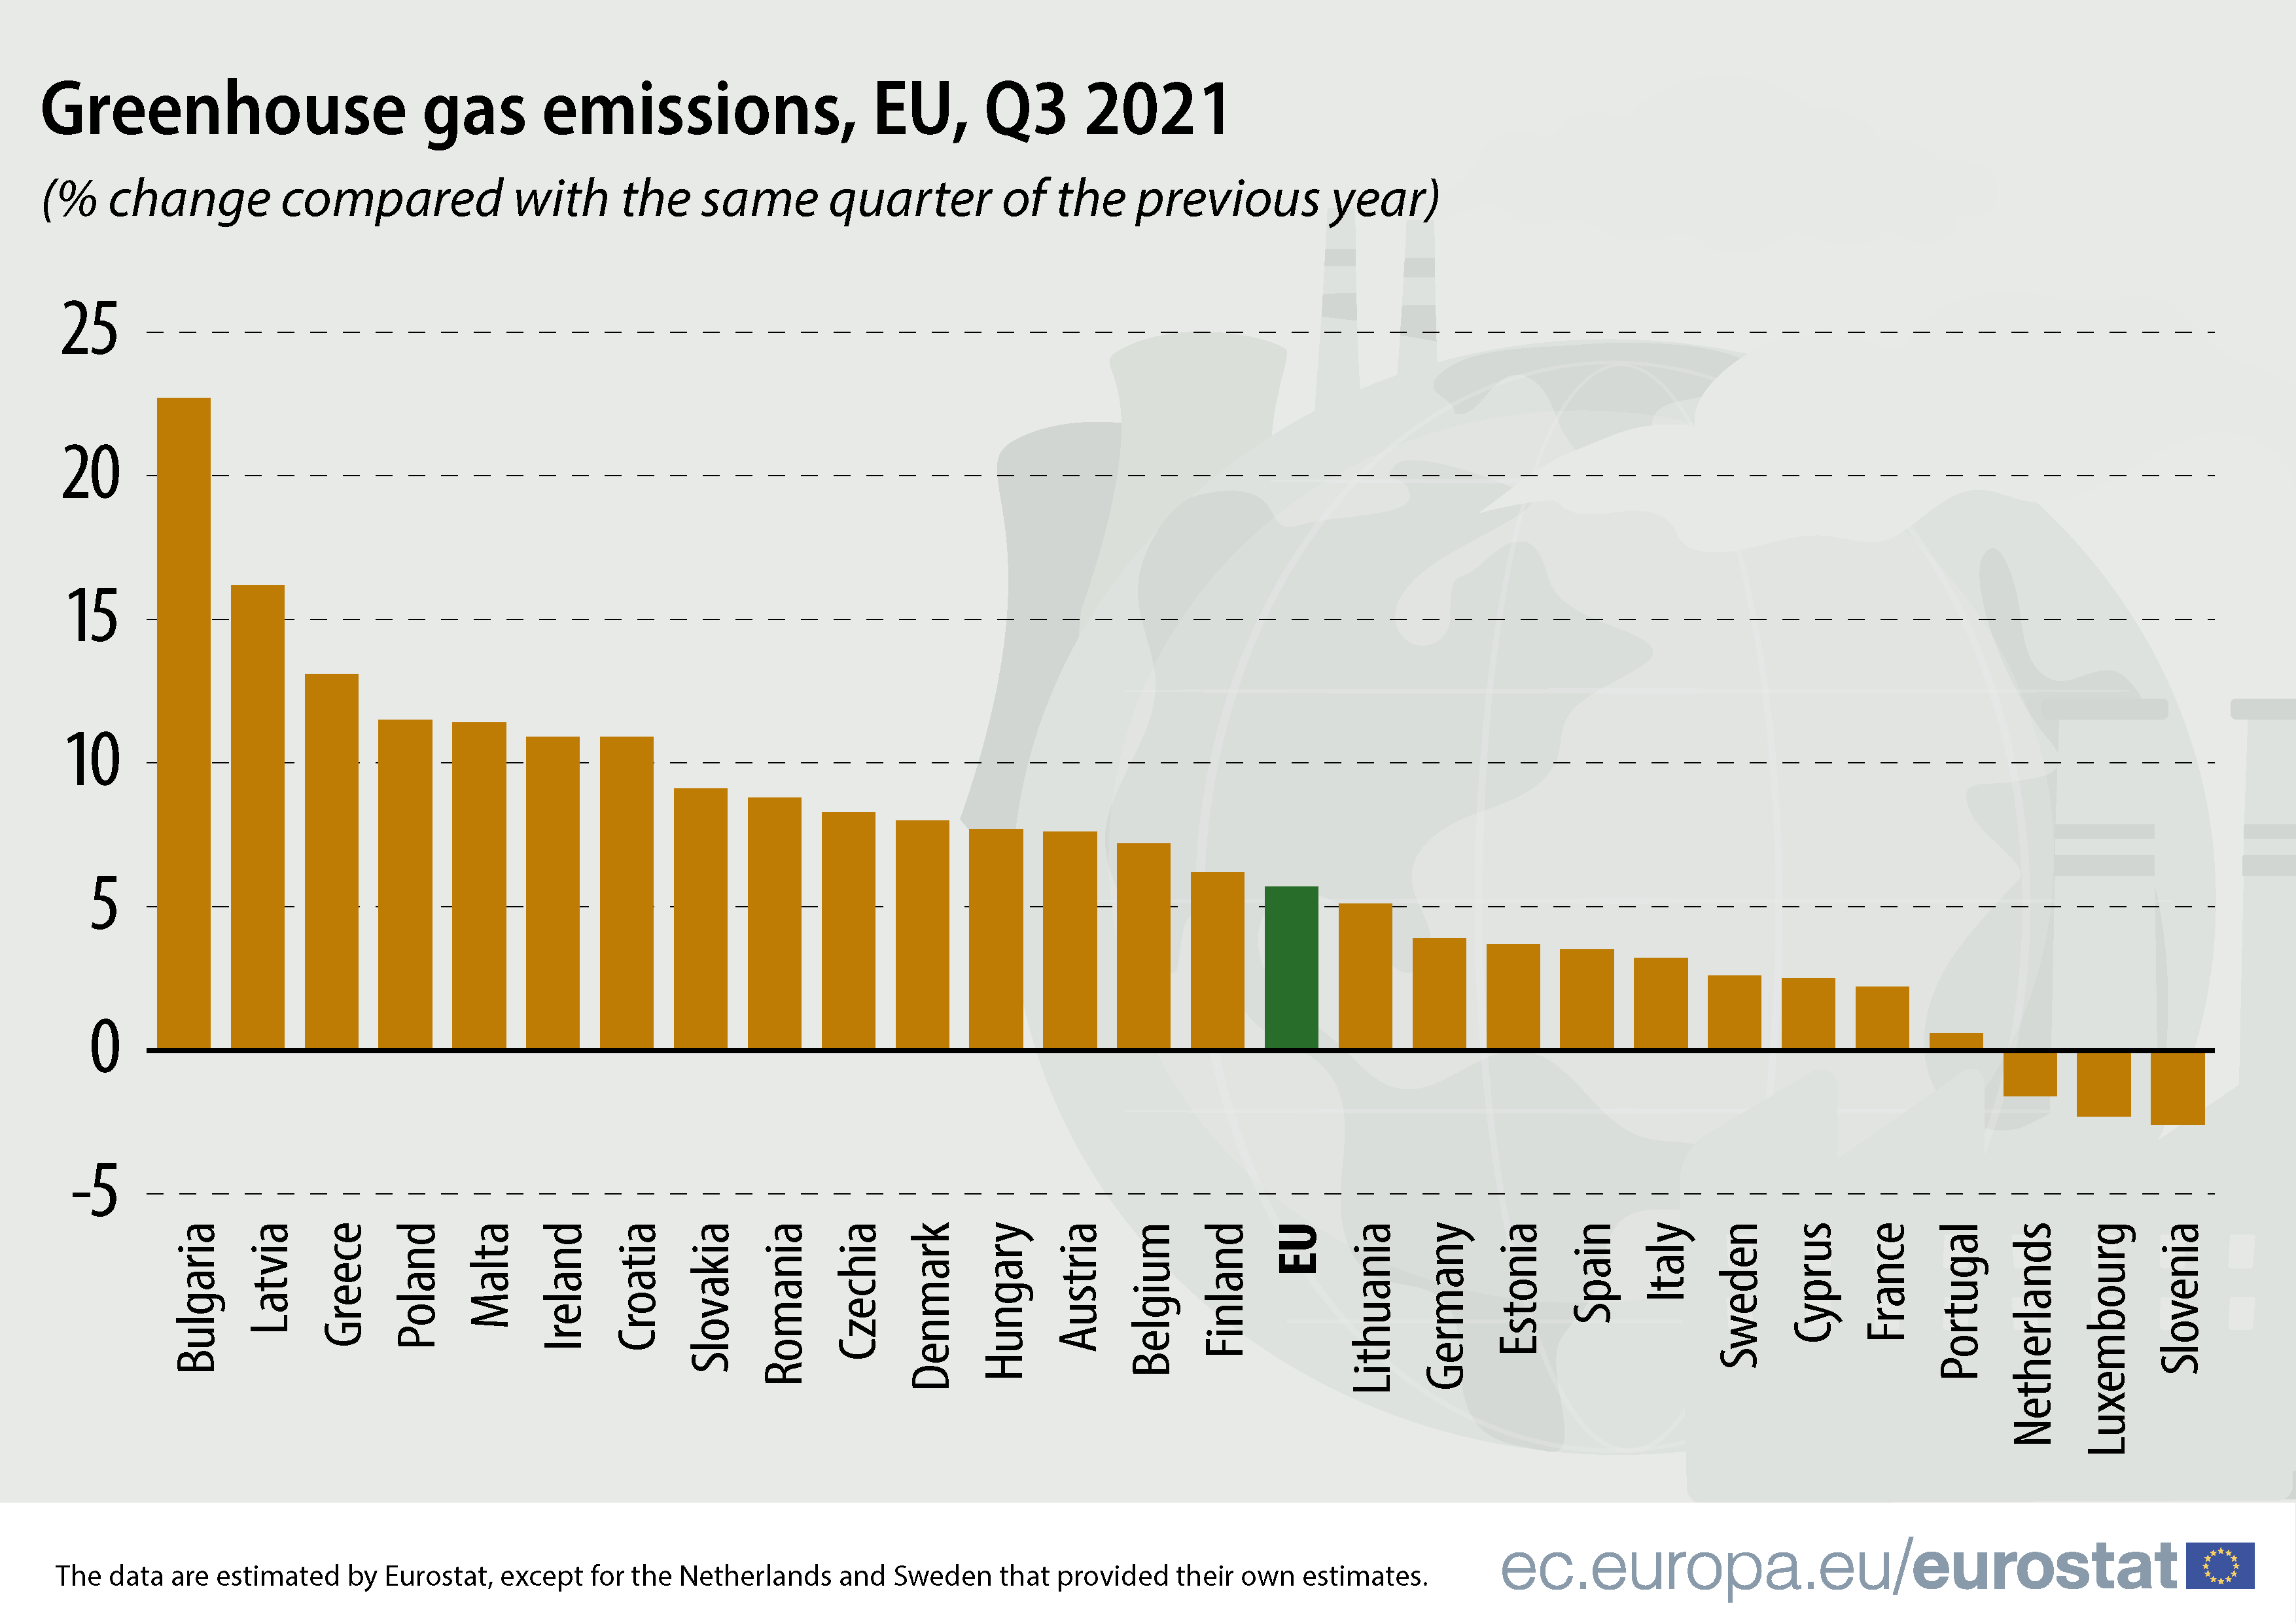
Source: Eurostat
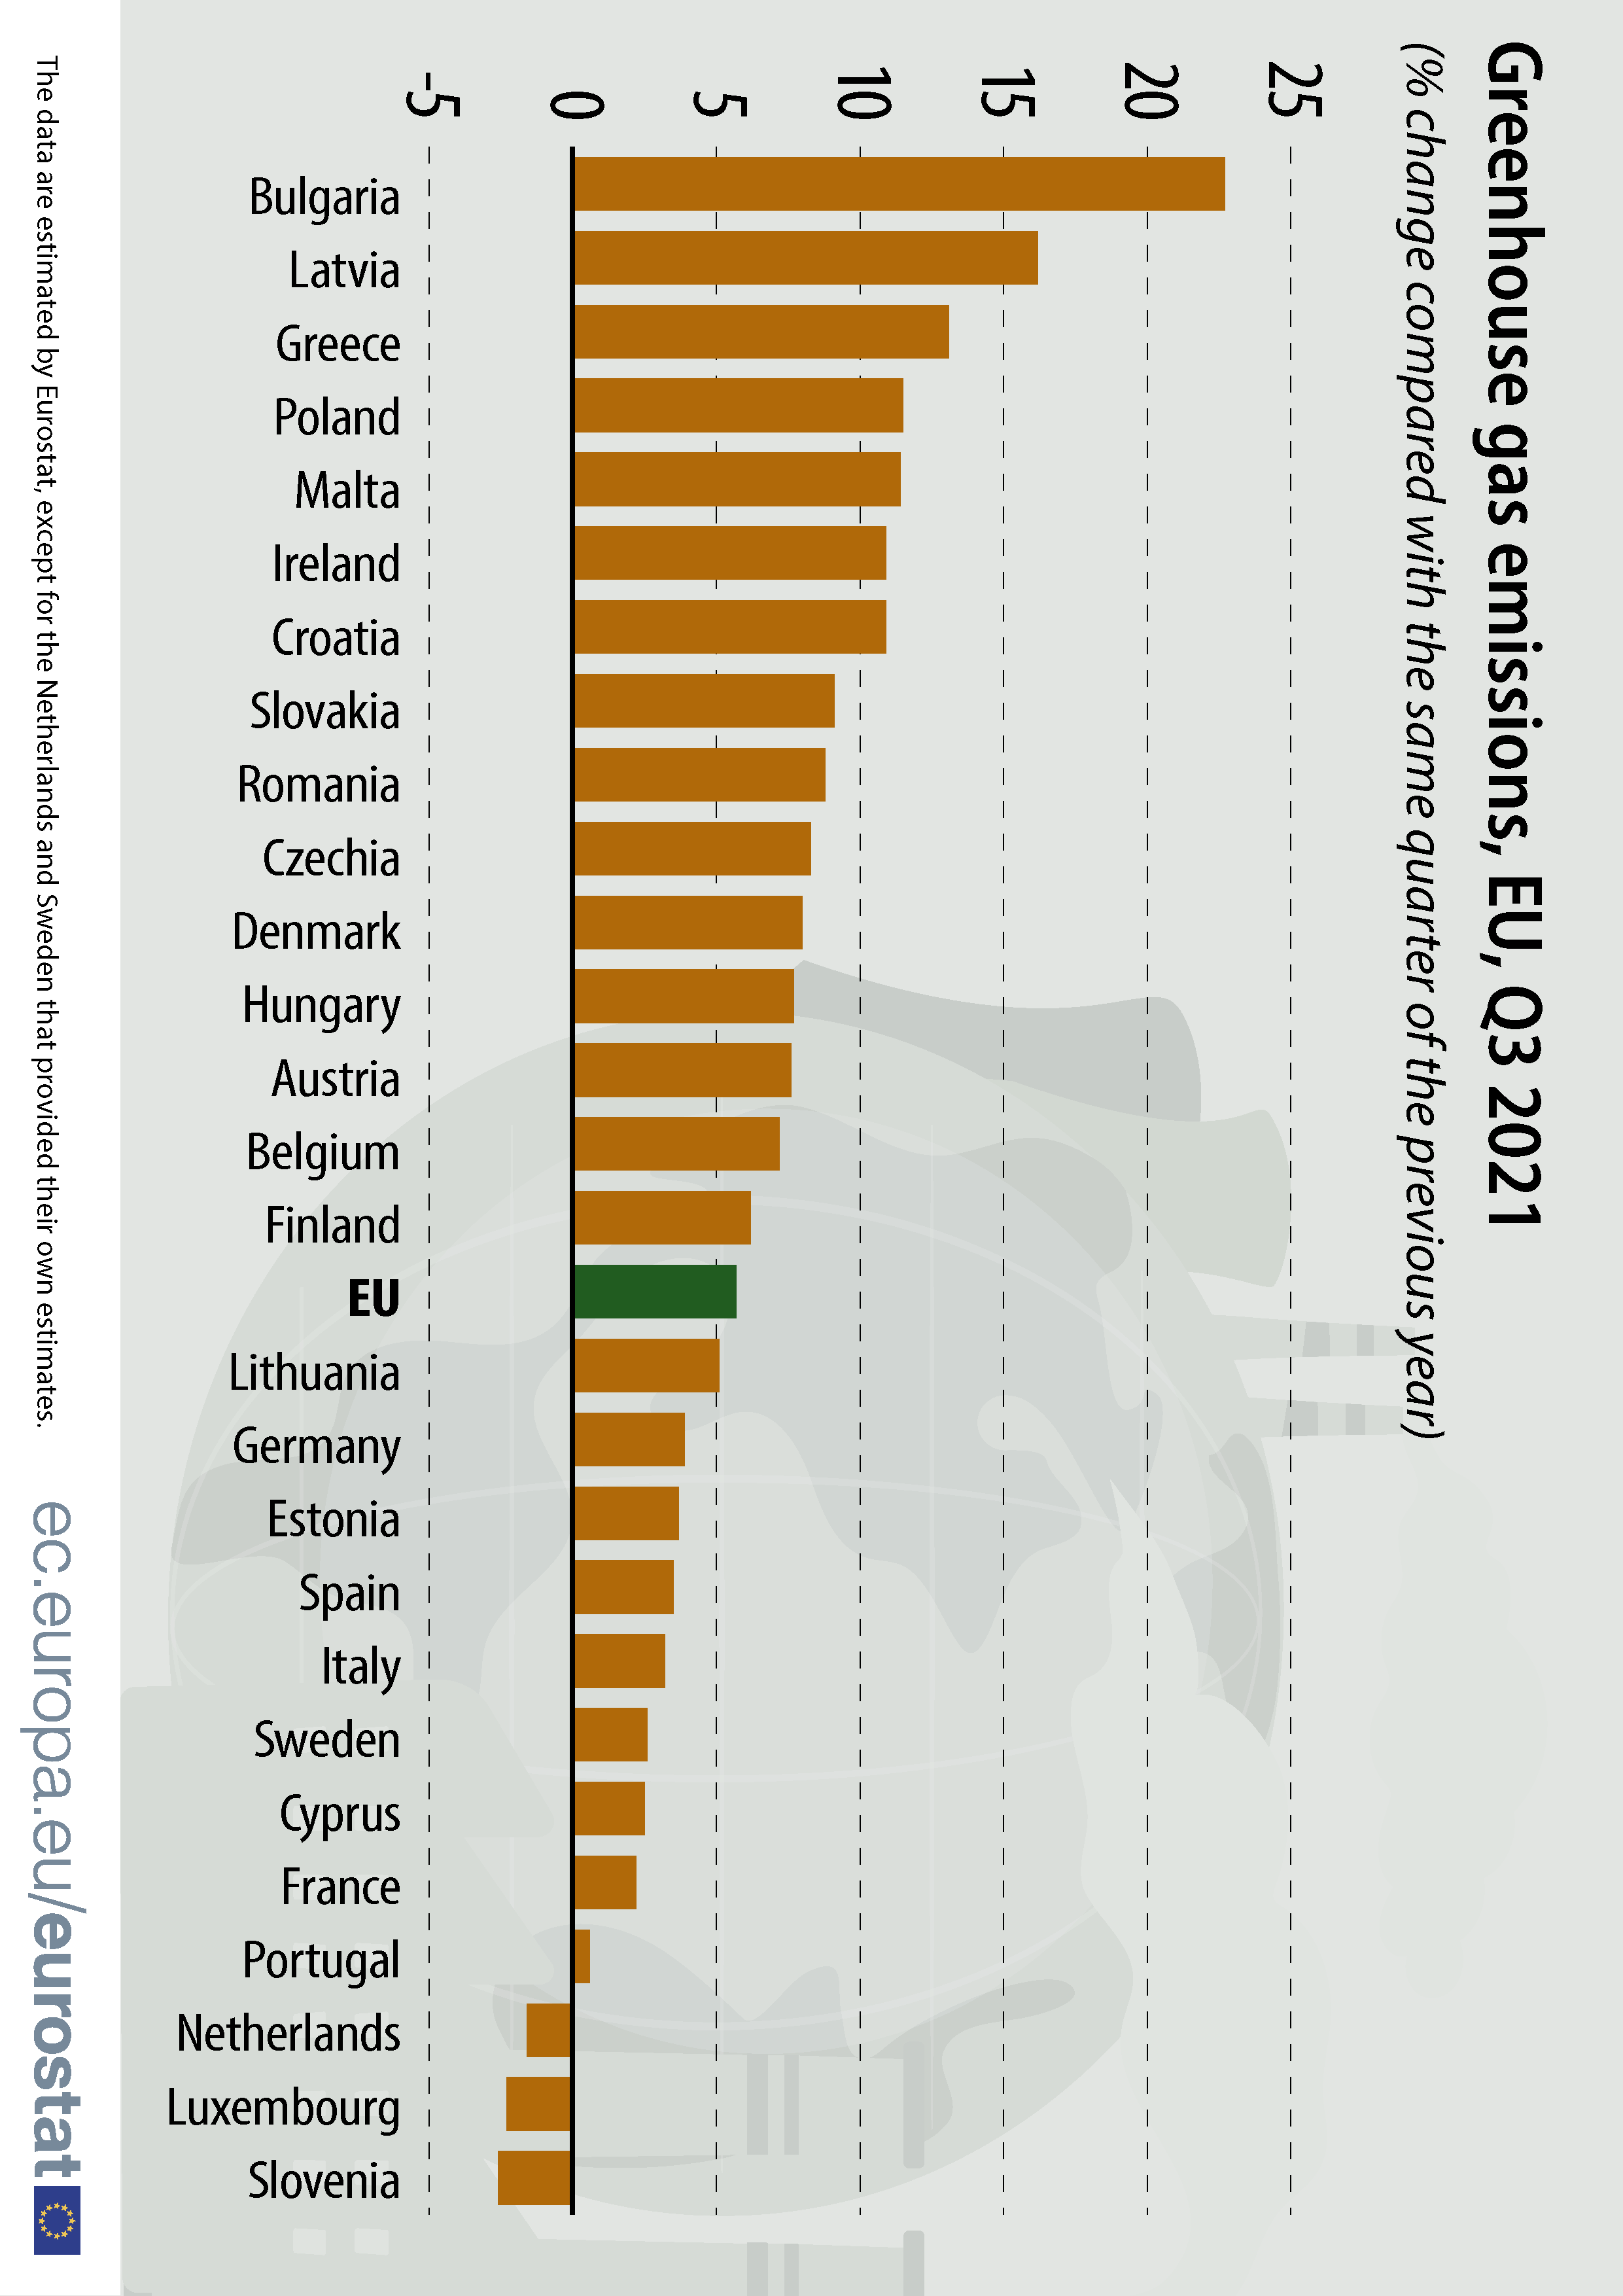
Source: Eurostat
Unless you are using data visualisation as a mean to just publish data that would otherwise be presented in a table, the goal of a visualisation is to deliver a message. For the delivery of this message, some data points will be more important than others, and it might be helpful to include additional information like aggregate values, (the average or median value, threshold values, …) and text elements explaining how the chart should be read or how certain values on the chart can be explained. So, annotating your visualisation is a very important mechanism to lower extraneous cognitive load. This include the use of good understandable chart titles, visual annotations and text annotations.
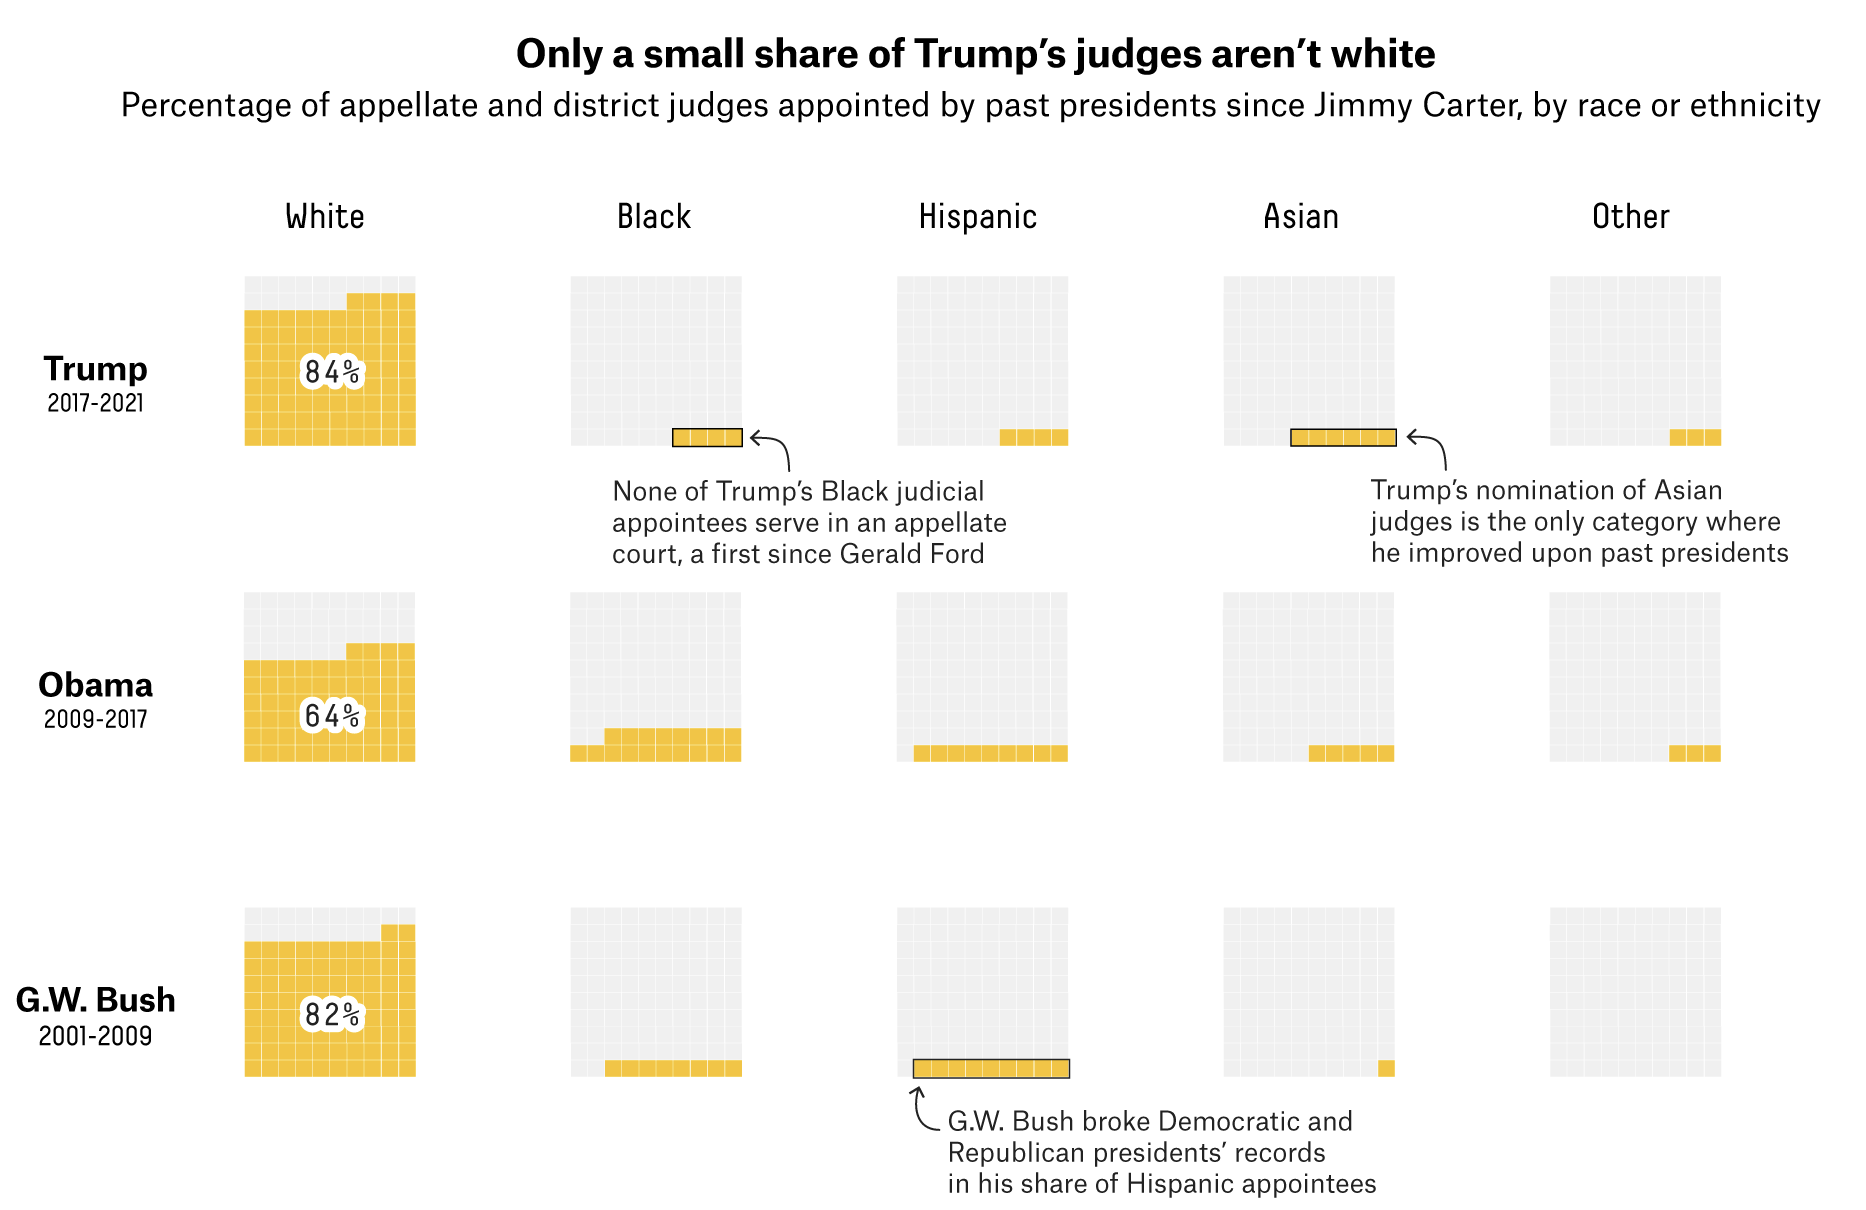
An example of a chart with a very clear message and integrated text annotations. Source: fivethirtyeight.com
Clutter, defined as the visual elements in a visualisation that take attention away from the data and the pattern that it is showing, is an obvious multiplicator of extraneous load. Examples of clutter are the use of background images, the use of too many and saturated colours and the presence of very thick and dark axis and grid lines.
Clutter being removed from a chart. Source: darkhorseanalytics.com
Unnecessary extraneous load is also generated when the chosen chart type does not fit the message that is to be delivered. For example, a choropleth map is not the best option if the main objective is to highlight the countries with the highest and lowest value or to show the distribution of values.
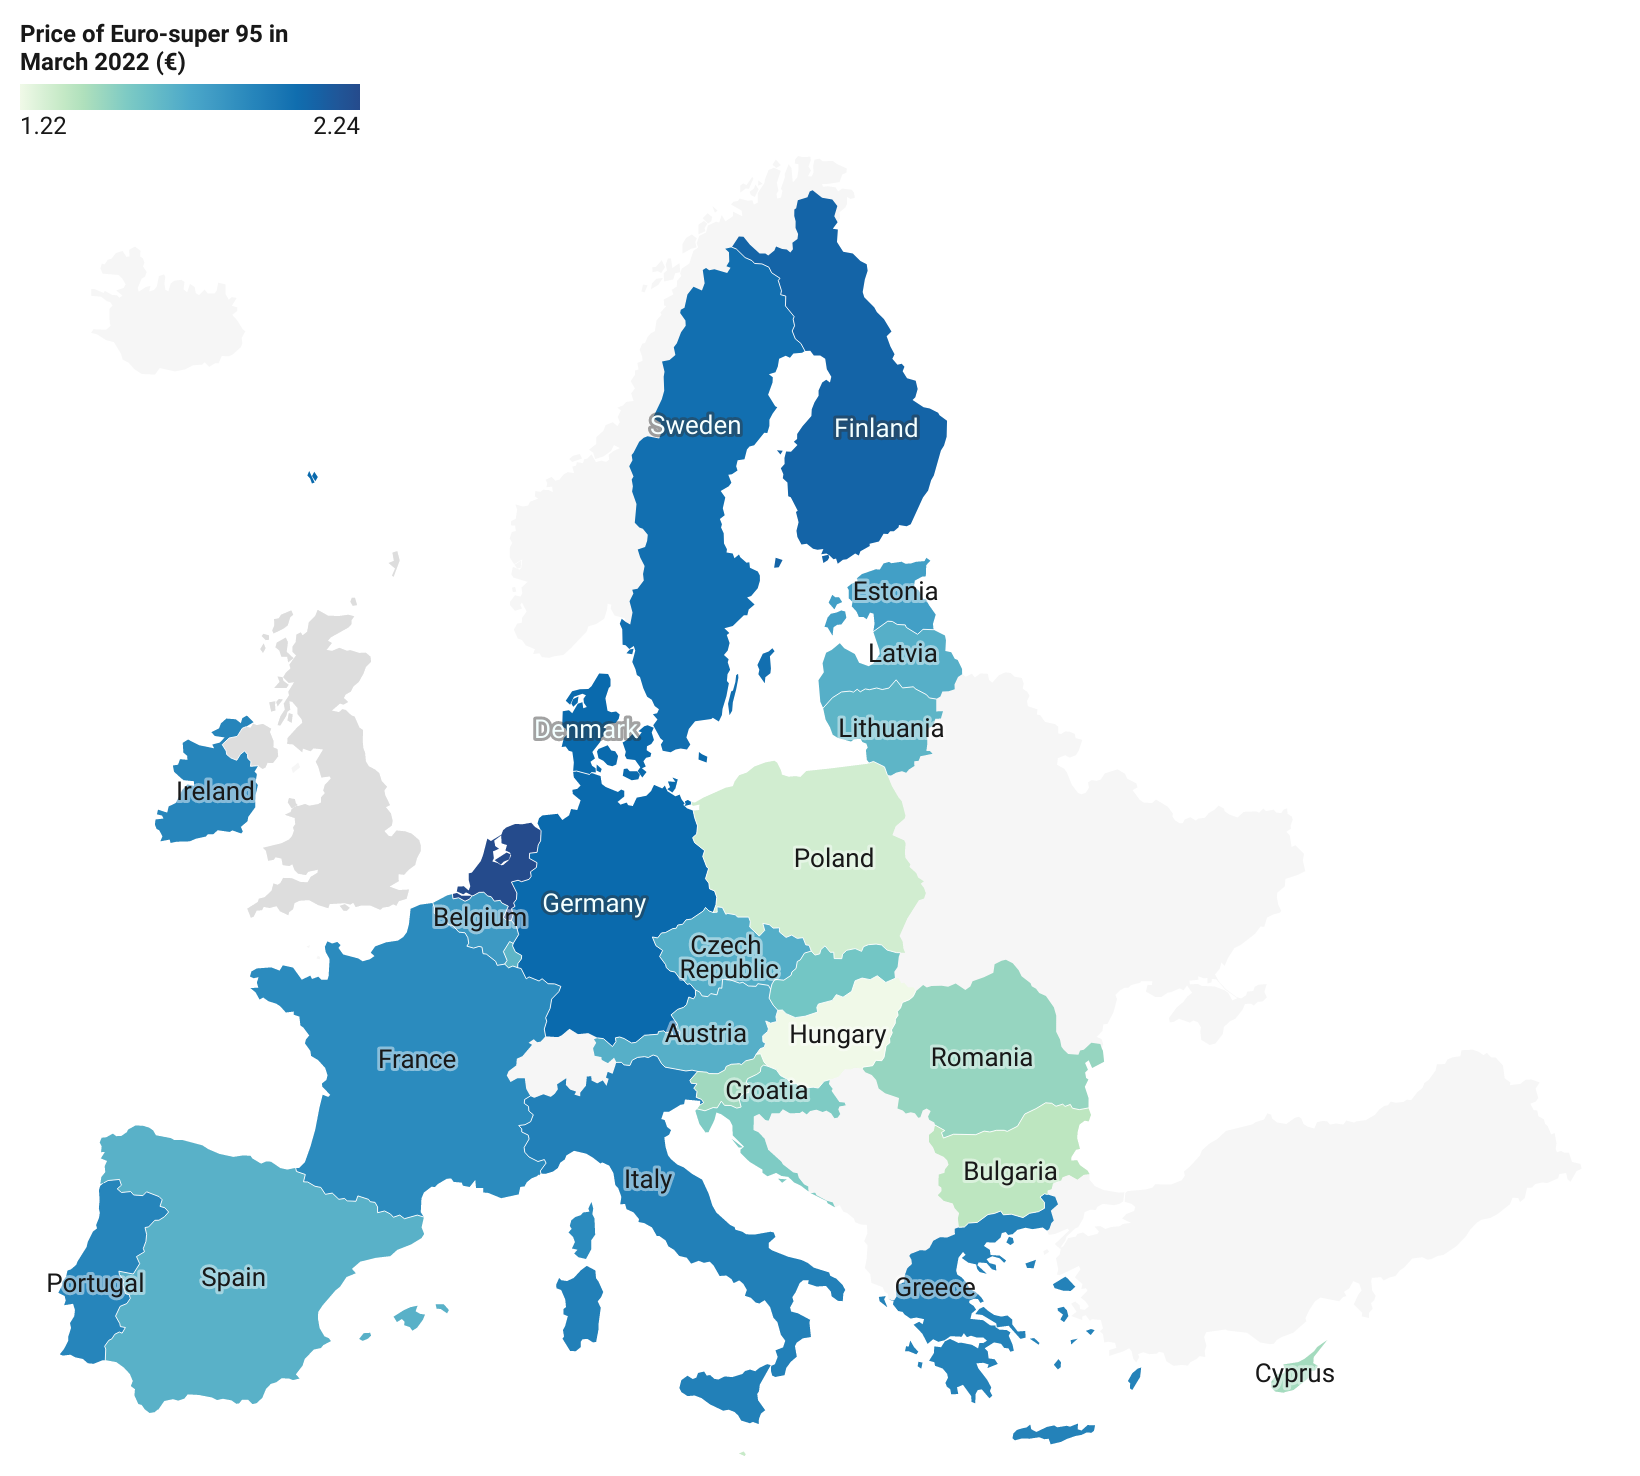
Source: datawrapper.de/river
![A horizontal bar chart showing the price of gasoline in the countries of the EU]](Reducing%20the%20cognitive%20load%2070a9cb0c4c8c4f45b66f63a749d9f40e/gdcWi-price-of-euro-super-95-in-march-2022.png)
Source: Maarten Lambrechts, CC-BY 4.0
When contextual information is missing from a visualisation, its extraneous load is higher than needed. The lack of units for numerical data can even render a chart completely useless. All information needed to correctly interpret a chart should be contained in the chart itself. If readers need to go look for this information in the surrounding text somewhere else on the page (or worse: on another page), the extraneous load becomes too high. Self contained charts have the lowest extraneous load.