Not relying on colour alone as a channel to communicate information makes your visualisations more accessible. This assures that the visualisation can survive printing in black and white, and is accessible to fully colour blind people.
Double encoding is not unique to data visualisation. For example, in interface design, required fields in a form can be single encoded by giving them a red background colour, or outline. But because some users might not see the red, it is better to double encode the required fields by also marking them with an asterisk, for example.
In data visualisation, double encoding is not very common yet, and it is still the subject of research. One example of double encoding for colours is to use the shape of the marks in a scatter plot.
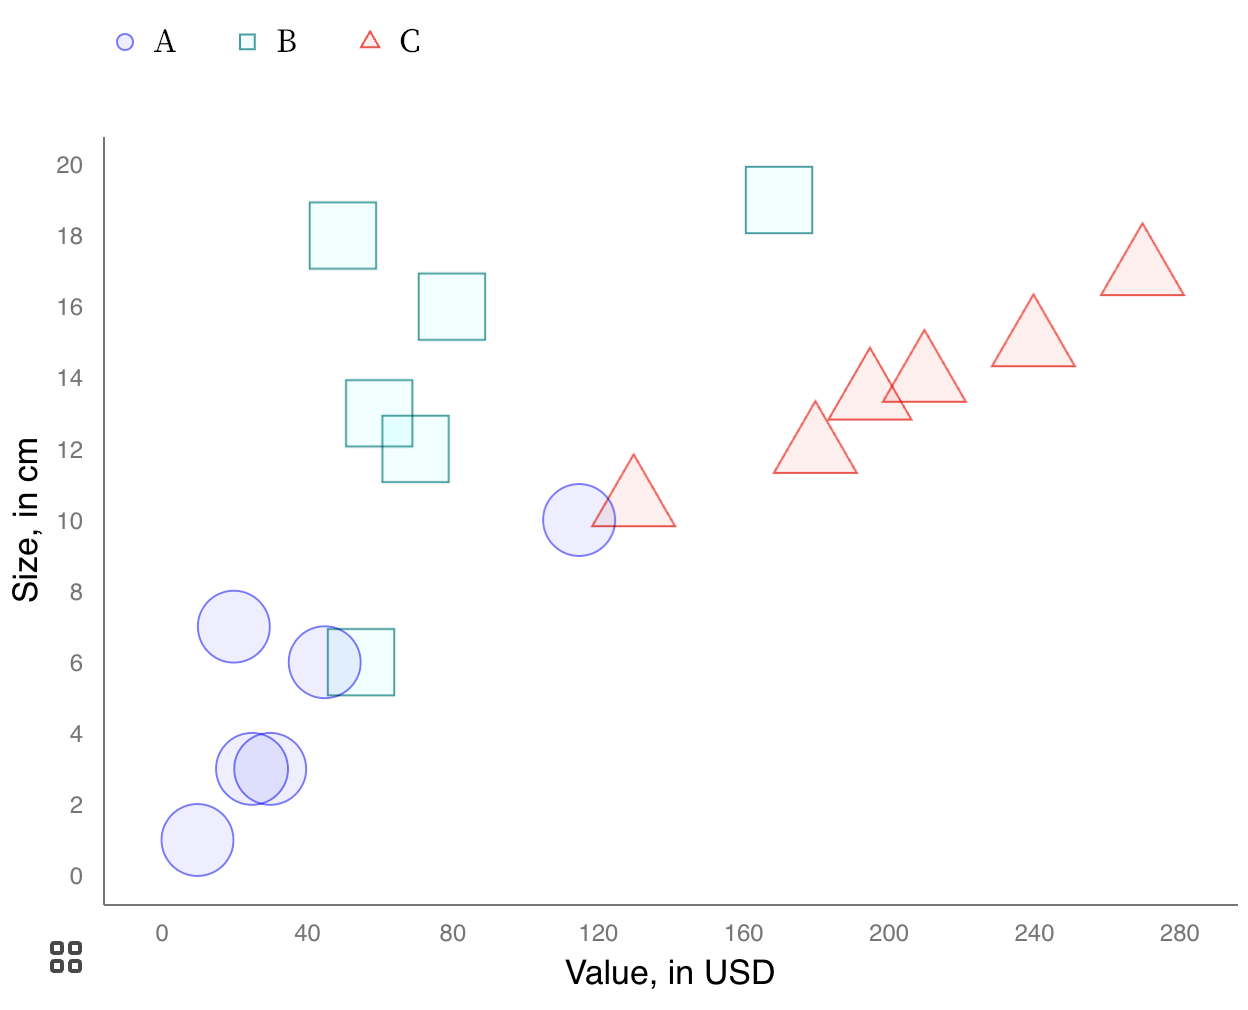
Source: Frank Elavsky
In line charts, the dash pattern of the lines can be used for double encoding.
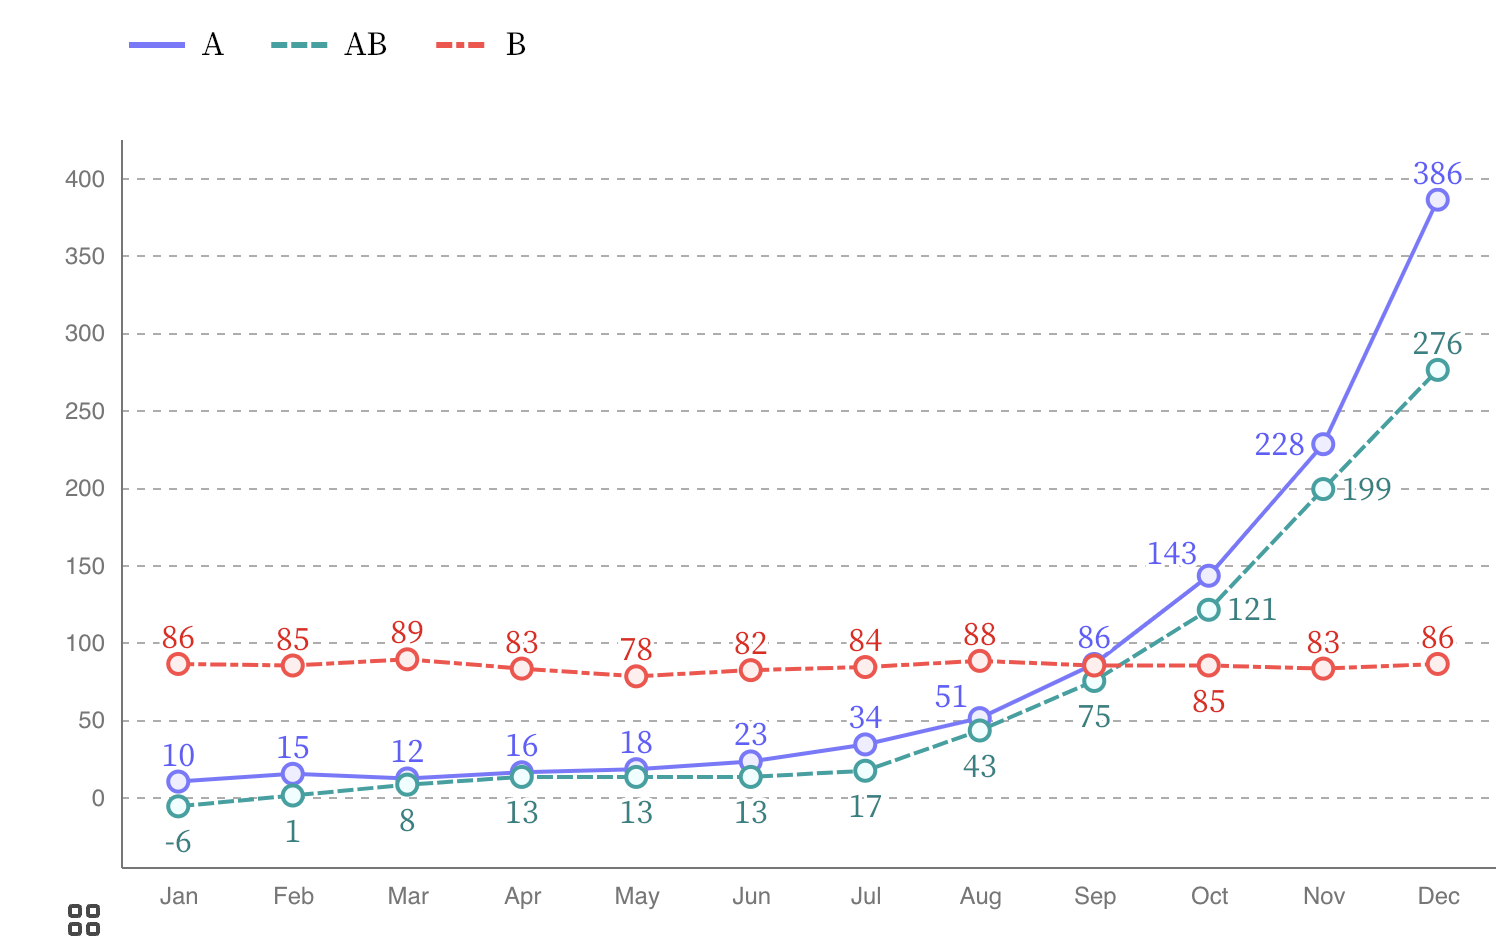
Source: Frank Elavsky
And for geometrical elements that have fill colour, textures can be used for double encoding.
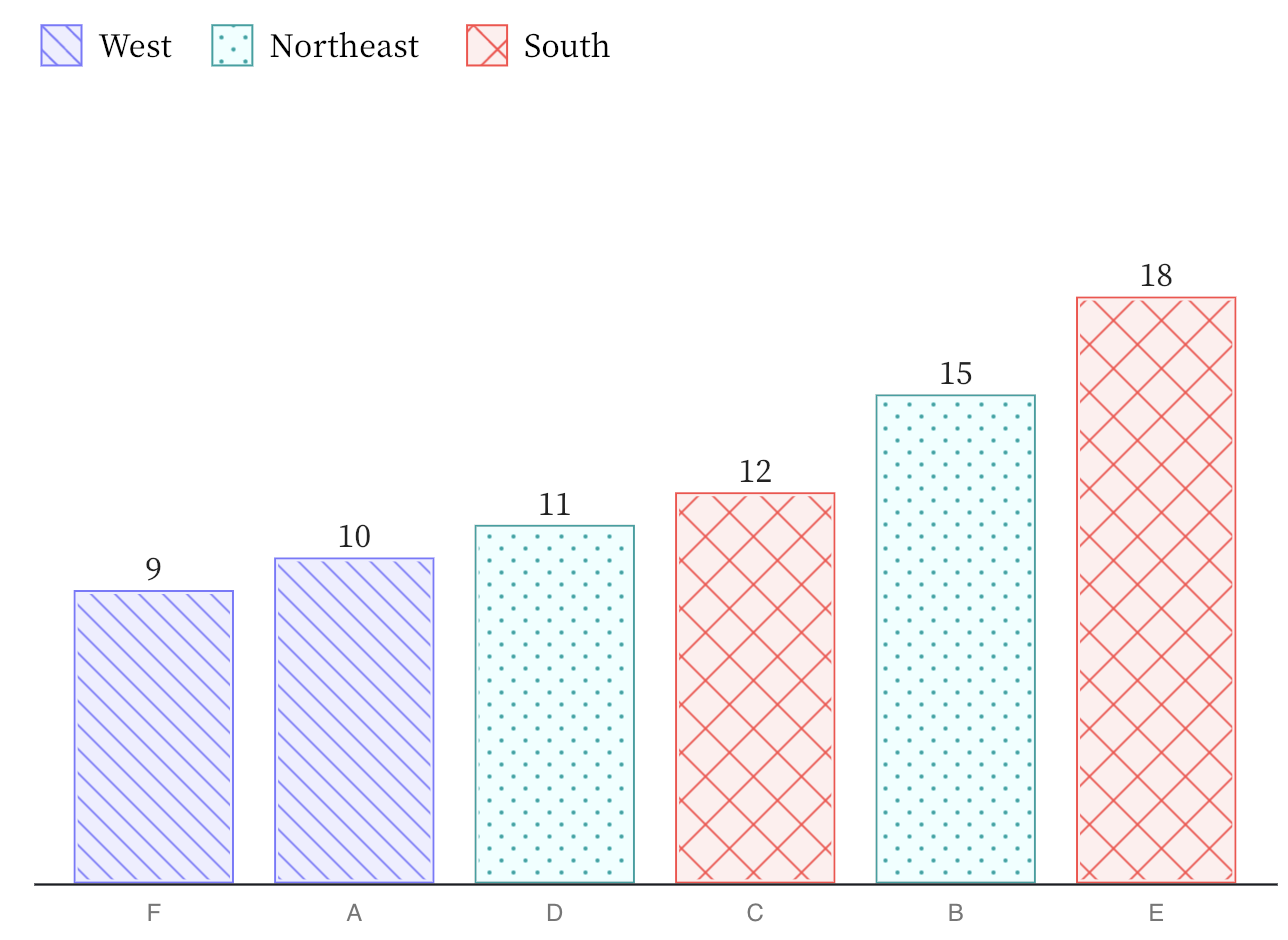
Source: Frank Elavsky
It is clear that these double encoding techniques have their limitations: with more than 5 categories in the data, a double encoded chart will start to look busy, and some of the symbols and patterns might start to look similar. But then again, it is also good practice to limit the amount of categories shown on a chart anyway, and also limit the number of different colours used.
One specific double encoding that can work really well is direct labelling. Instead of using a separate colour legend to indicate different categories, positioned above or next to the visualisation, the names of the category can be placed directly next to the geometric elements they represent. In this way the labels are using position as the second encoding, on top of colour. Direct labelling can work really well in line charts, for example.
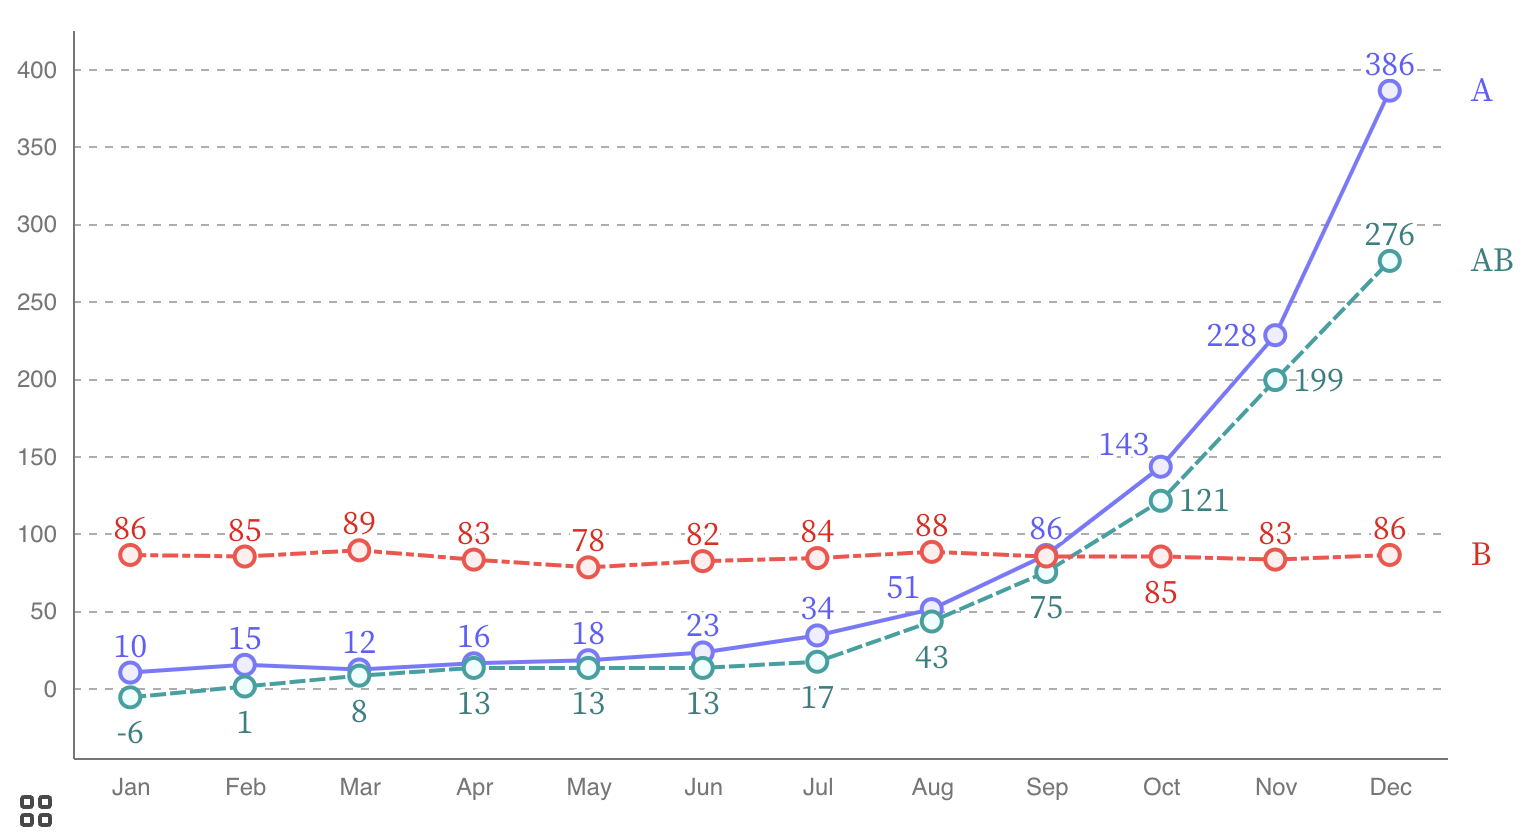
In this chart, the names of the lines share the same colour as the lines, and their position is used to double encode them: they are positioned next to the lines they represent. Source: Frank Elavsky