Operating systems, websites and web browsers and their plugins are increasingly supporting dark mode styling. In dark mode, content is shown with light text on a dark background, instead of the standard dark text on a white or light background. Dark mode is more suited for use in low-light settings, and it reduces blue light exposure and fatigue from long screen times.
Data visualisation tool Datawrapper started to offer dark mode for its embedded visualisations to their users. When the “automatic dark mode” option is enabled on a Datawrapper visualisation, the styling of the embedded visualisation will switch to dark mode whenever users have selected to prefer dark colour schemes in their browser or operating system. Note that for this to work properly, the website the visualisation is embedded in should also support dark mode.
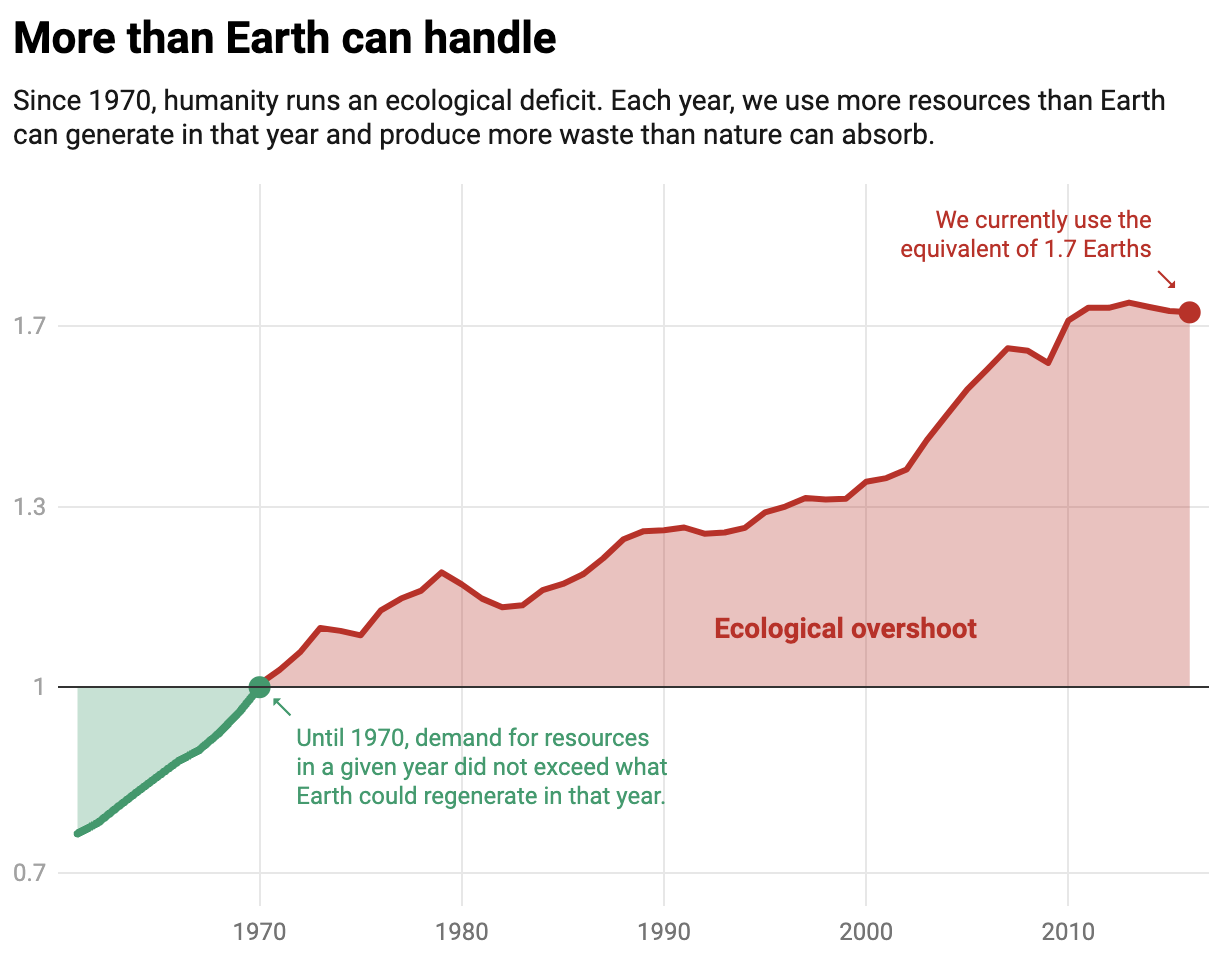
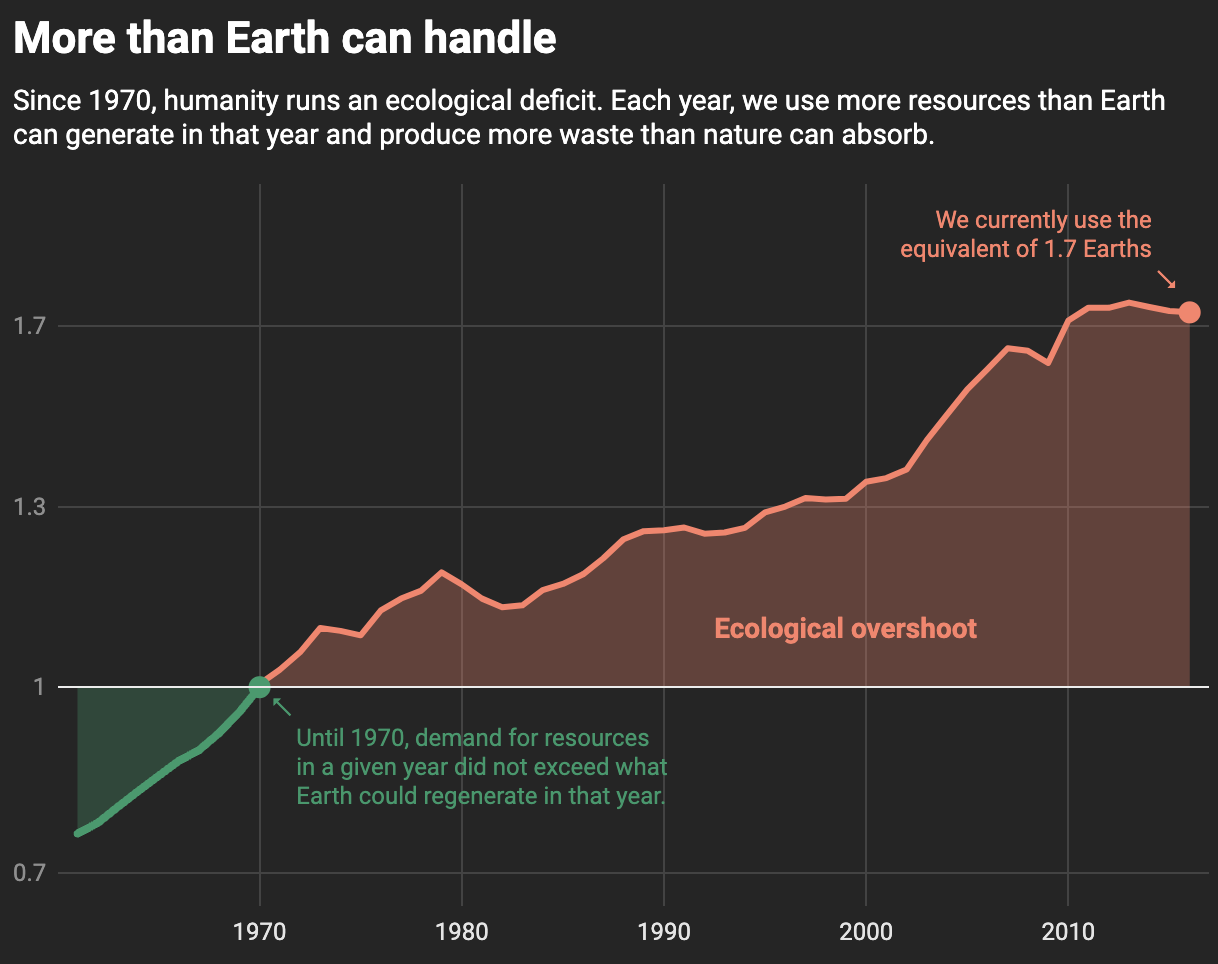
The same chart in standard and in dark mode. Source: Datawrapper
Notice that the red and green colours (which are not optimal for colour weak and colour blind users, by the way) are not the same colours in both modes. Datawrapper changes the colours of all elements on the chart in dark mode to ensure a high enough contrast ratio with the dark background.