Home icon
Data Visualisation Guide

Flow chart narrative visualisation

1 minute read

Narrative visualisation genres

Source: A small illustration showing a drawing with a lot of different arrows

Flow charts visualise processes, sequences of events and relationships between features. They might not be driven by (numerical) data, but they can tell stories that are hard to tell using only text in a visual way.

A schematic drawing explaining how the Covid-19 pandemic caused labor shortage, component shortages, shortage of durable goods and strained supply chains. Prepandemic situations are labelled in red, and the drawing has a lot of arrows

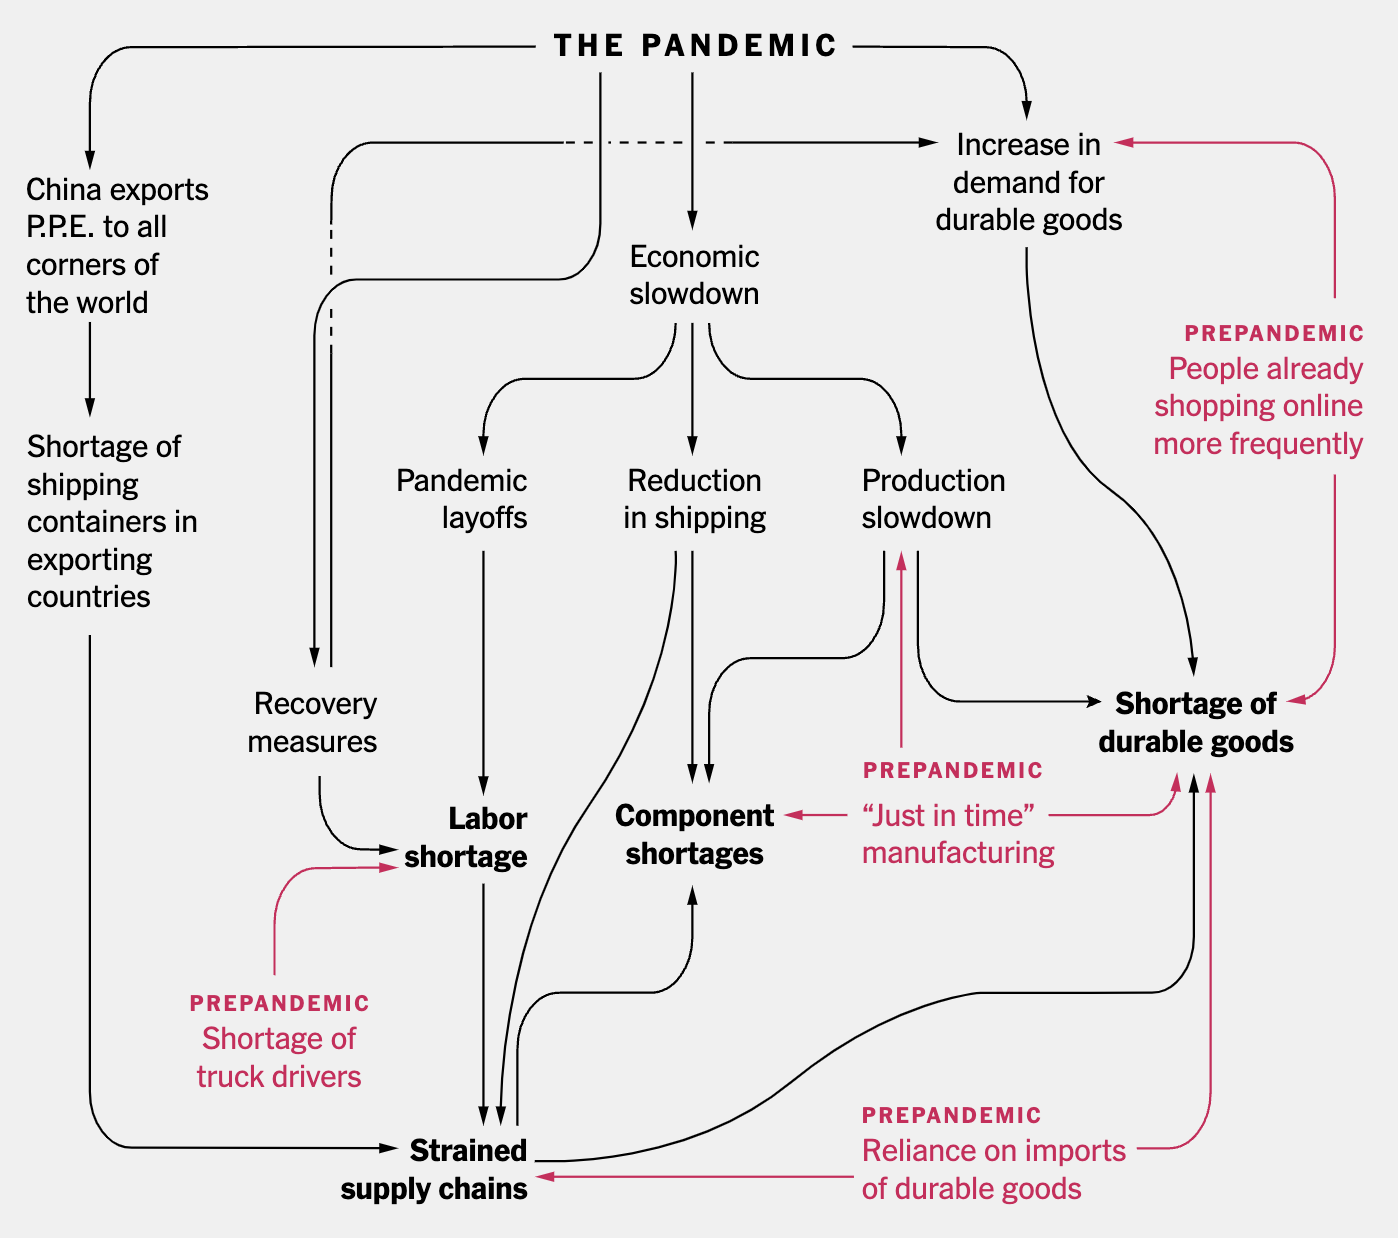
Source: How the Supply Chain Crisis Unfolded, nytimes.com

Related pages

Annotated chart narrative visualisation

Narrative visualisation genres: introduction

Film, video and animation

Magazine style narrative visualisation

Partitioned poster narrative visualisation

Comic strip narrative visualisation

Narrative visualisation genres