Source: Narrative Visualization: Telling Stories with Data
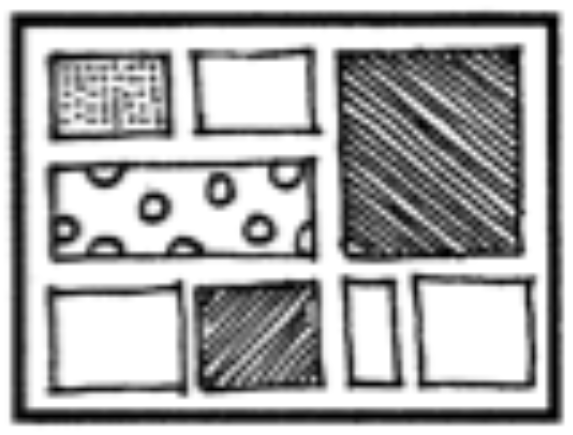
A comic strip is related to a partitioned poster, but the panels have a much stricter layout, so that the reading order is much more linear.
Recently, the genre of the data comics has emerged as a study area in visualisation research. Publications on the topic as well as a gallery with examples can be found at datacomics.github.io. See also the Combining with other media: data comics page.
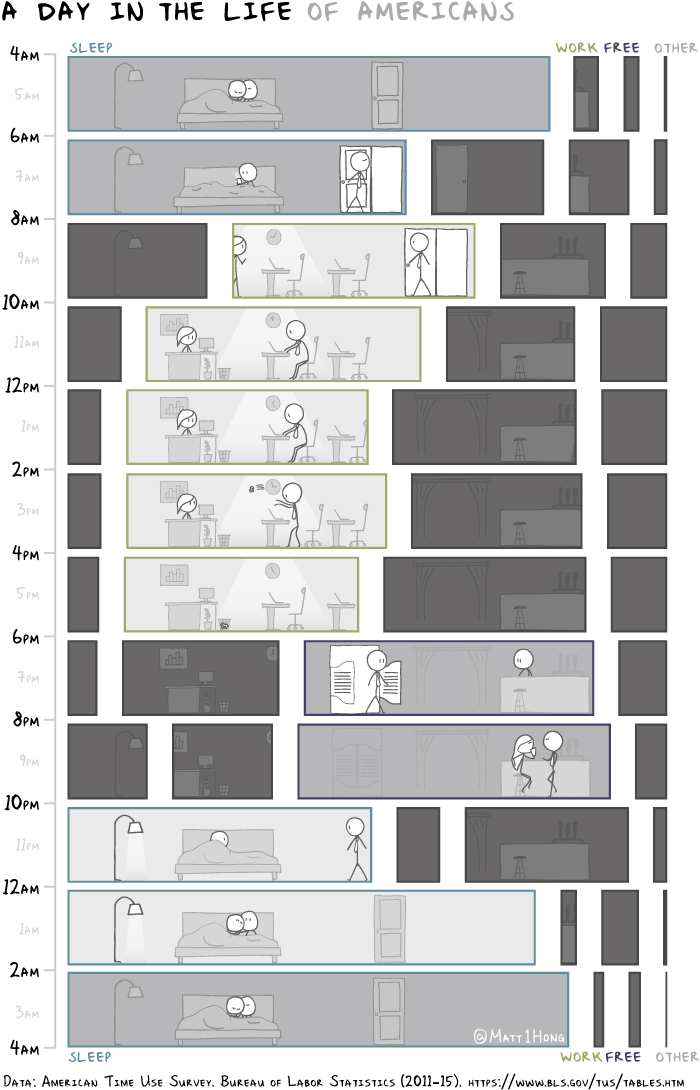
A data comic on the average time use of Americans. Source: Matt Hong