High-value datasets – measuring inequality in the EU
Exploring data sources to measure income inequality in Europe
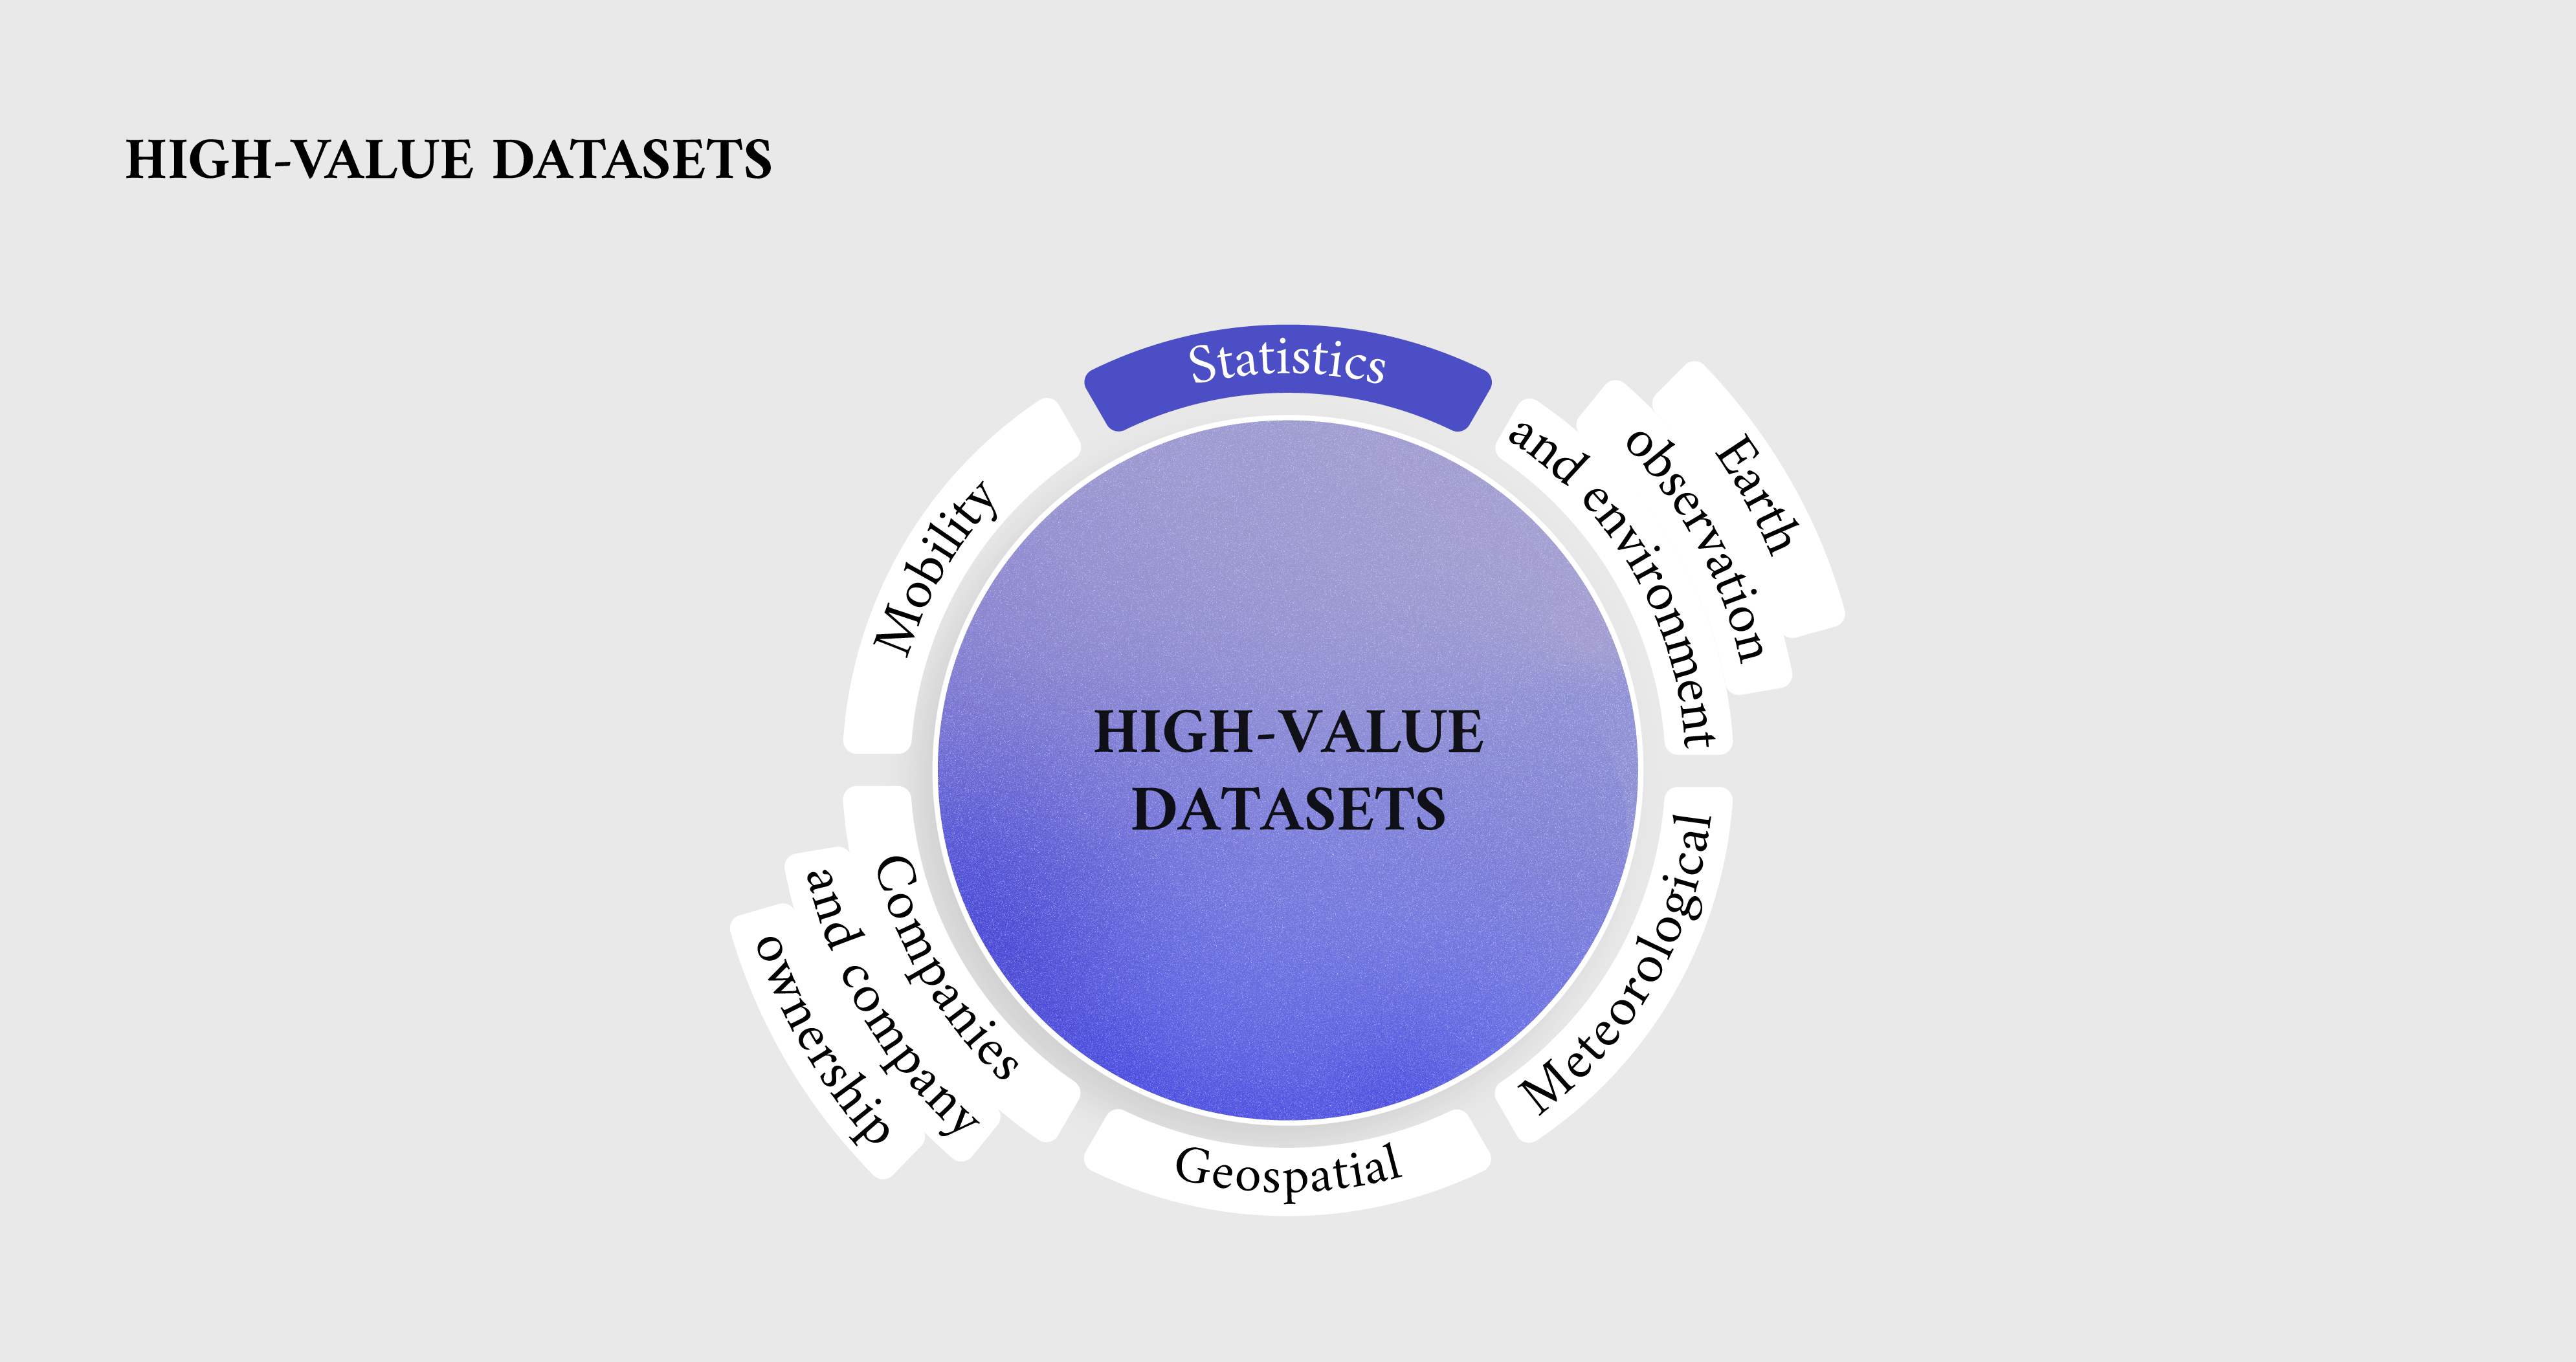
This is part of a series of articles showcasing examples of high-value datasets from their different thematic categories. High-value datasets are defined by EU law based on their potential to provide essential benefits to society, the environment and the economy. This series aims to help readers find reliable and accurate information from official sources relating to the availability of various high-value datasets, and to present this information through data visualisation. You can check out the article providing an overview of high-value datasets here.
Only datasets specifically defined by law can be considered high-value datasets, and as such the data presented in the articles does not necessarily fall under that definition. Instead, the data has been chosen to be thematically adjacent to high-value datasets and to showcase what can be done with information made available by official EU bodies and EU Member States. The official list of high-value datasets adopted on 12 December 2022 can be found in the legal documents that define them and their characteristics.
Income inequality and high-value datasets
EU institutions acknowledge the significance of income inequality indicators, which are considered highly valuable measurements. Some of these measurements have been proposed as high-value datasets. The ‘statistics’ category includes datasets relating to inequality, as outlined in Regulation 2019/1700 and Implementing Regulations 2019/2180, 2019/2181 and 2019/2242.
Specifically, the high-value dataset measurements include ‘yearly inequality rate’ which has two key variables. The first variable is the 80/20 ratio of total income received by the 20 % of the population with the highest income (top quintile) to that received by the 20 % of the population with the lowest income (lowest quintile). The second variable is the Gini coefficient of equivalised disposable income, which measures the extent to which the distribution of disposable income after social transfers, adjusted for family size, deviates from a perfectly equal distribution.
For the 80/20 income ratio, sex and age breakdowns are mandatory, while regional breakdowns are only required for Member States when possible, as outlined in the relevant regulation. The Gini coefficient is a more comprehensive measure, and no specific breakdowns are required.
Income inequality data from Eurostat
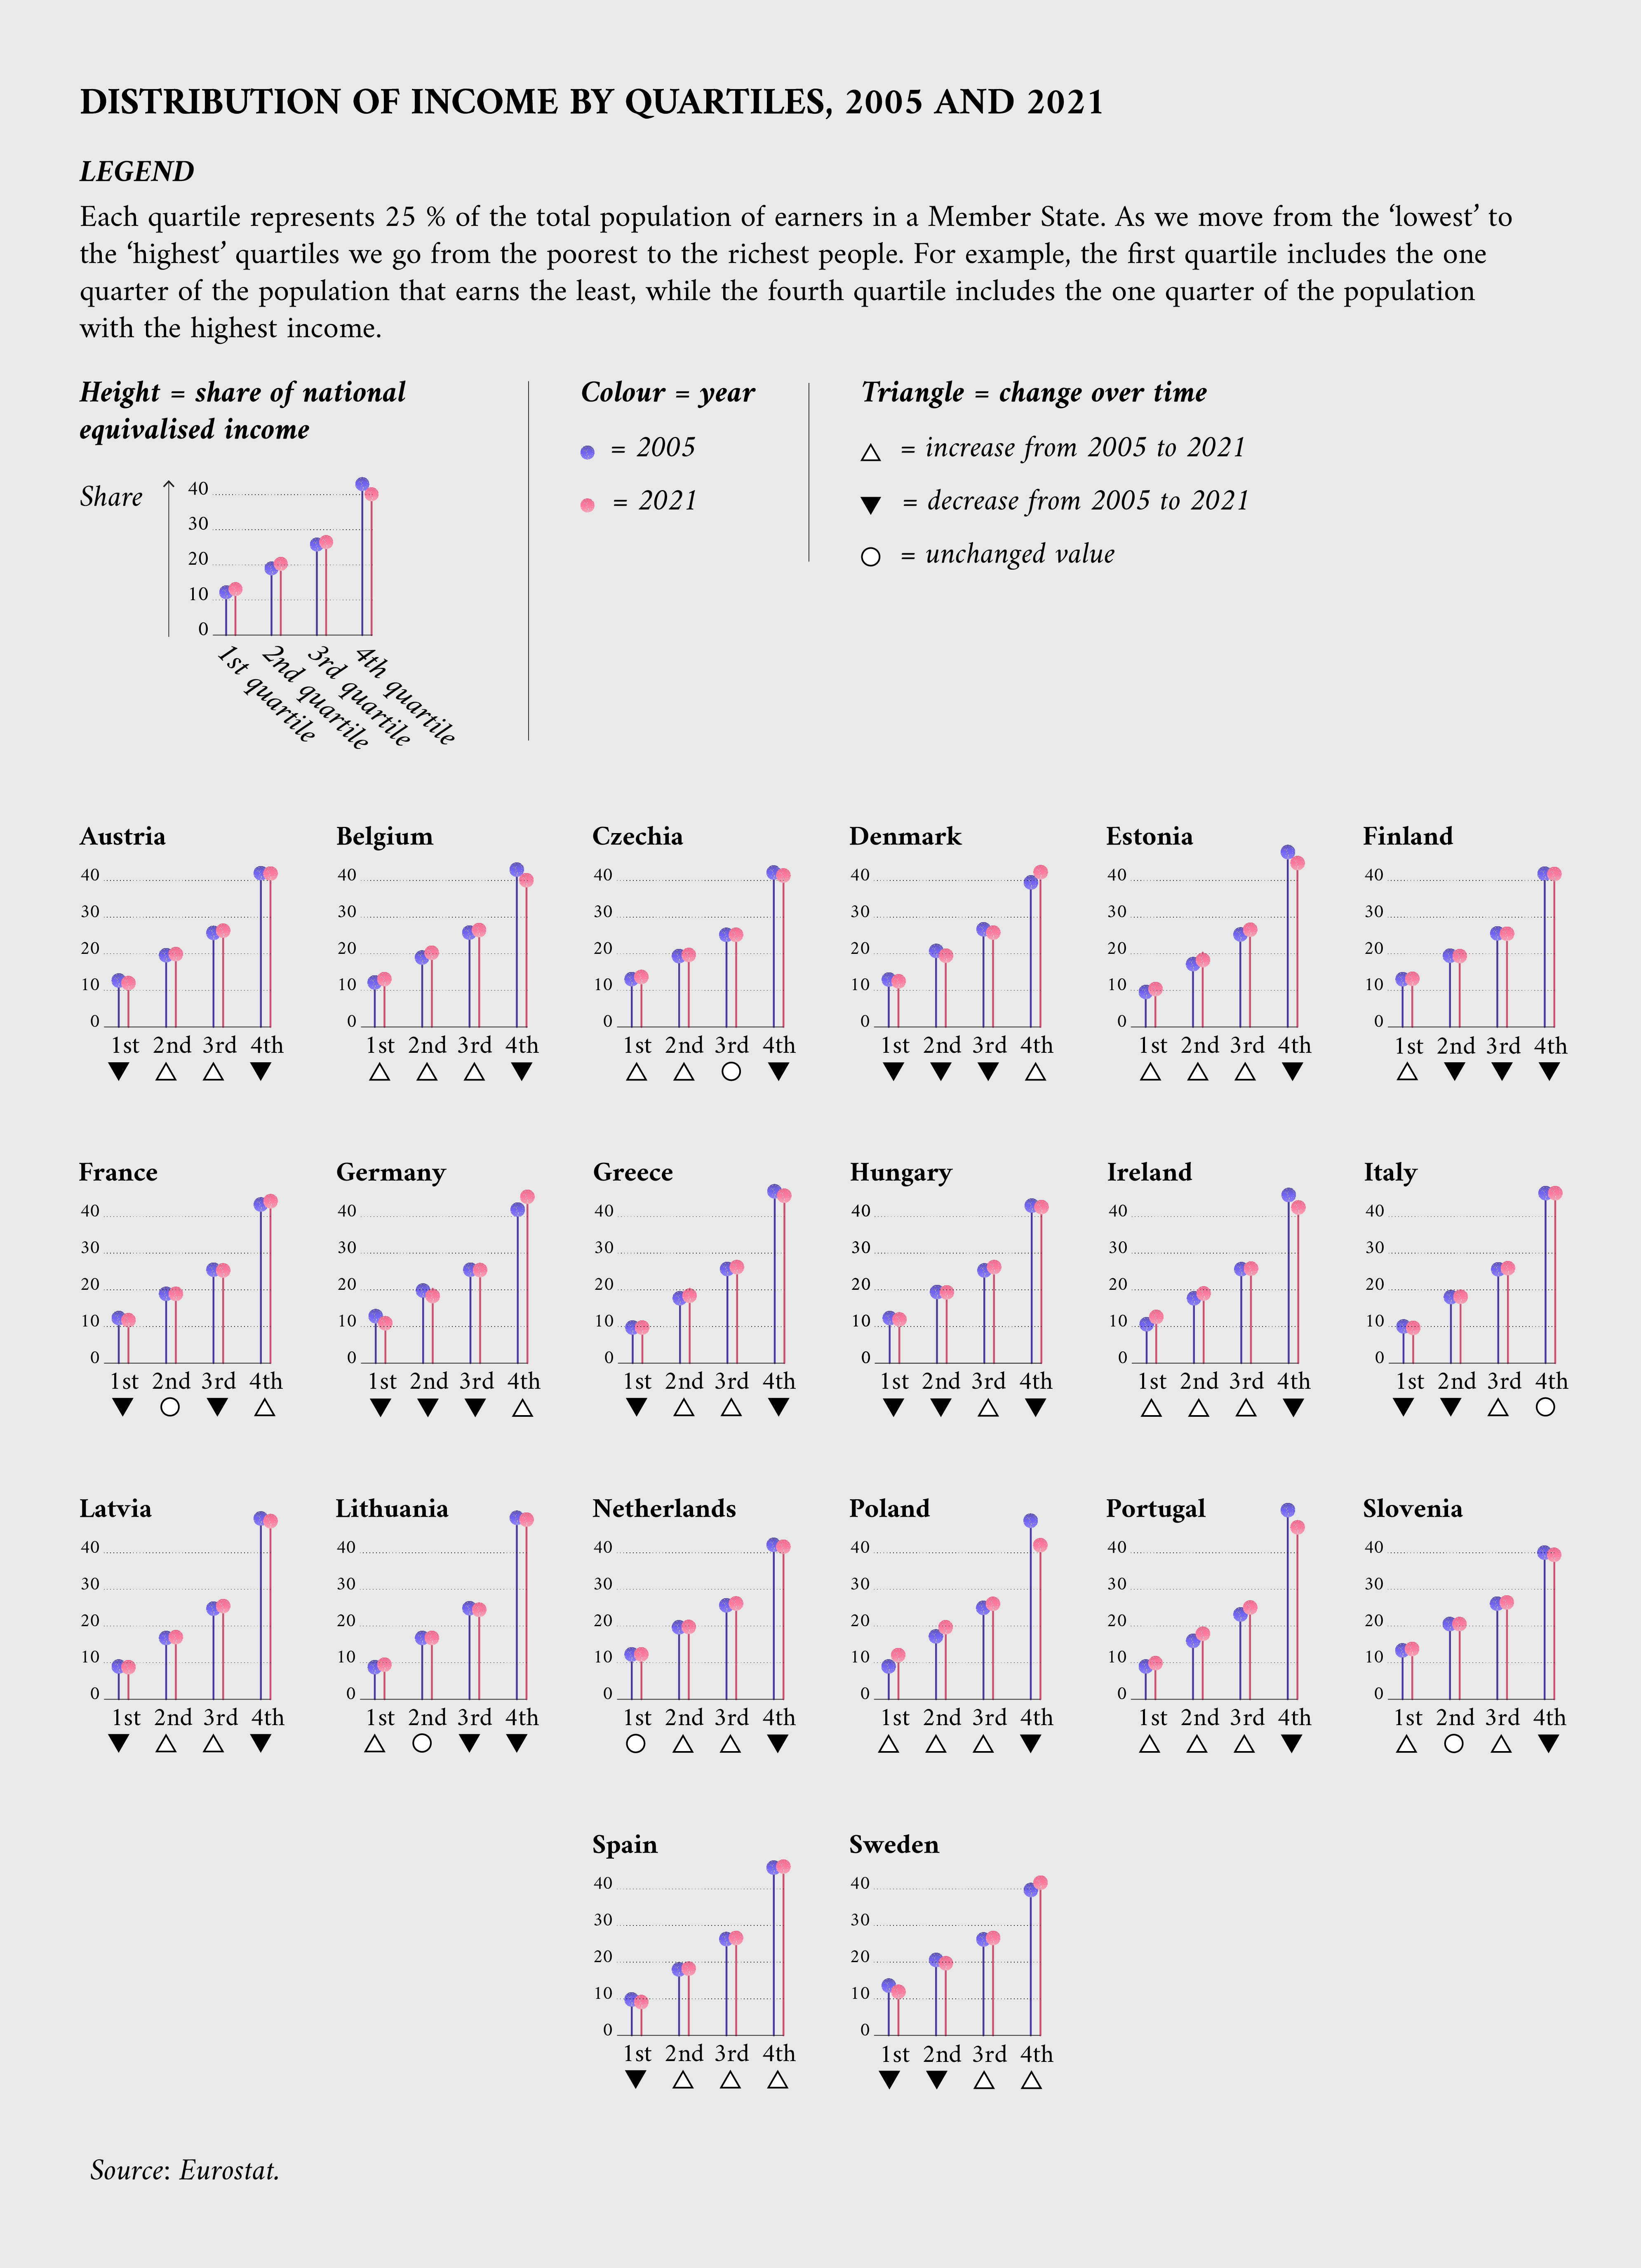
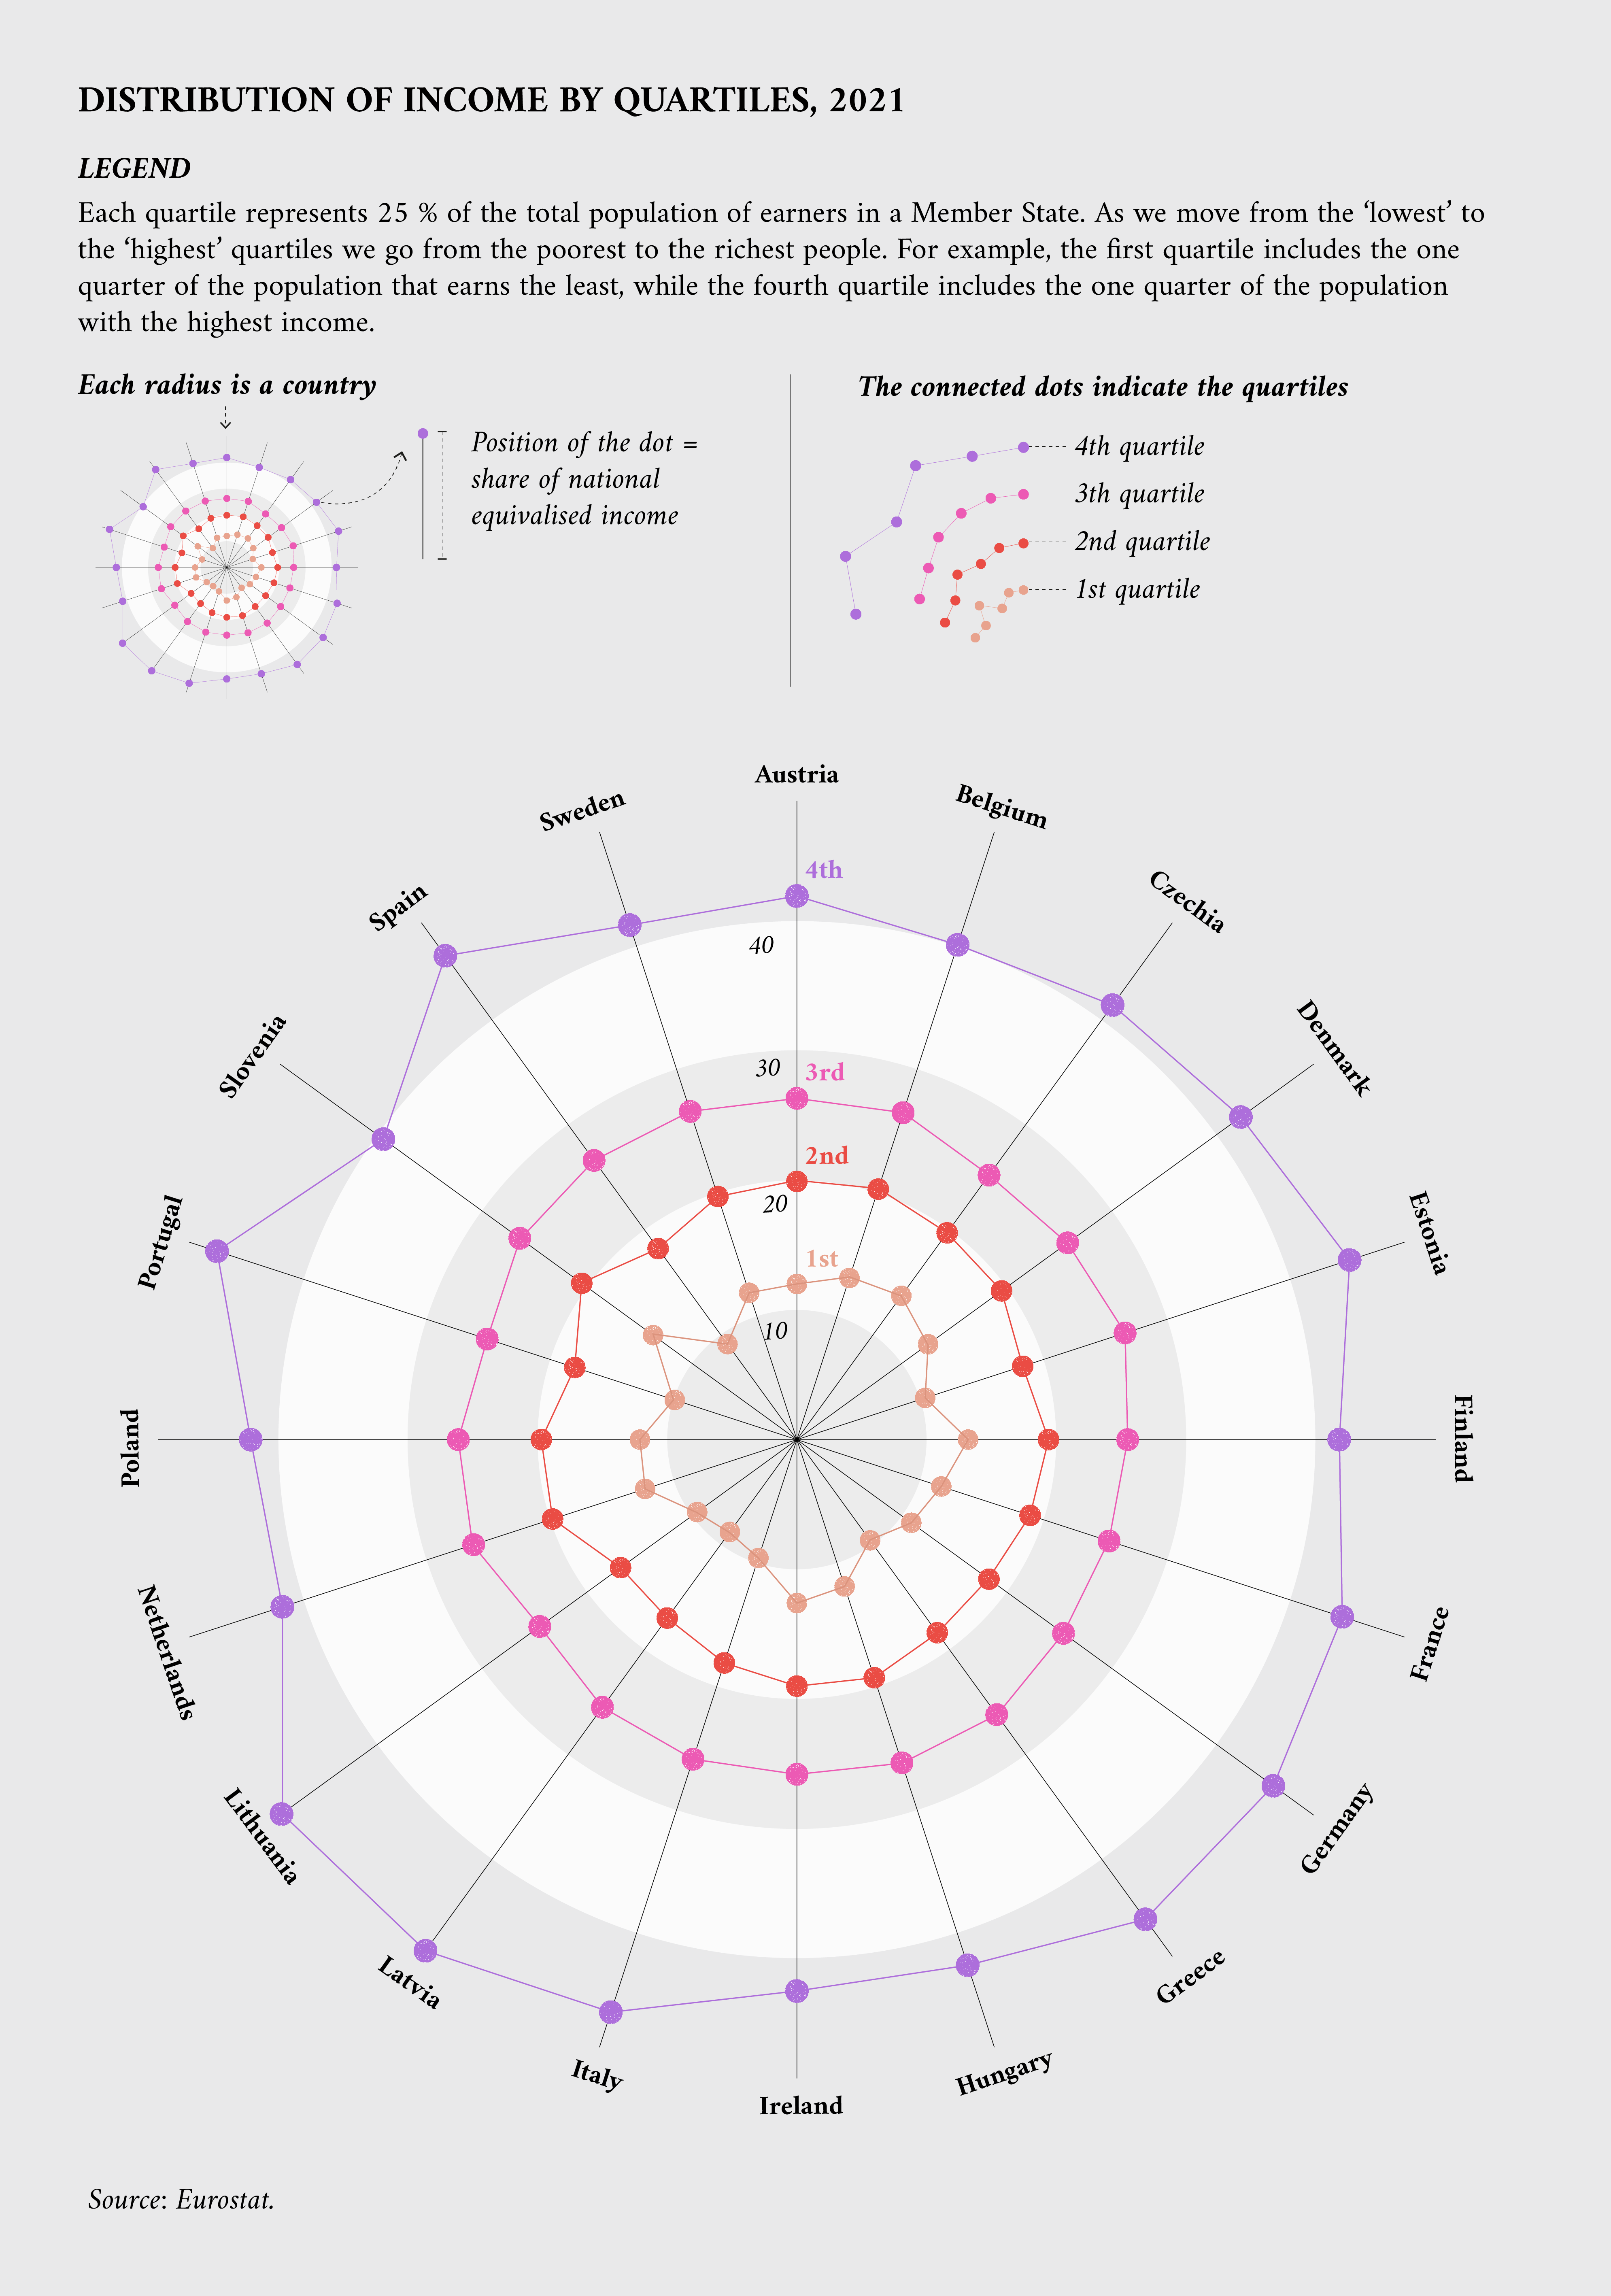
Eurostat produces one of the most comprehensive datasets about the distribution of income in EU Member States. It is based on the European Union Statistics on Income and Living Conditions (EU-SILC) and the European Community Household Panel (ECHP) surveys. This dataset assesses the distribution of income among individuals by ranking them from lowest to highest earners, and subsequently dividing the population into various sized ‘segments’. For example, this dataset can be used to see what share of a Member State’s total income goes to the richest or poorest 1 % of the population – the first and last ‘percentiles’ of income distribution. To gain a comprehensive understanding of income distribution, the population can be split into four equal groups, known as quartiles, each comprising 25 % of the total population. By analysing the distribution of income among these groups, we can gain insight into the living conditions of both the wealthy and the less fortunate.
The following visualisation shows the distribution of income among the top and bottom 1 % of earners in several EU Member States, along with the general distribution of income in all four quartiles of the population. The data displayed in the first visualisation presents 2 years (2005 and 2021) to provide an understanding of how income distribution has evolved over time. These particular years were selected as they offer the most extensive coverage, as data for all Member States and years was not available. The second visualisation focuses on 2021 data and allows for better comparison between EU Member States. The graphic also includes some information about the actual earnings in euro for certain groups.
Income inequality datasets from data.europa.eu
The data.europa.eu portal hosts several datasets on income inequality, including data on income inequality rates in Ireland, household earnings in the Caribbean Netherlands – three municipalities of the Netherlands in the Caribbean Sea – and more. One particularly interesting dataset, also originally produced by Eurostat, examines the ratio between the top and bottom 20 % of earners in EU Member States. When the ratio increases, it indicates that the top 20 % of individuals are receiving a larger share of income compared to the bottom 20 %. The dataset also includes breakdowns by gender and age, which are illustrated in the following graphic.
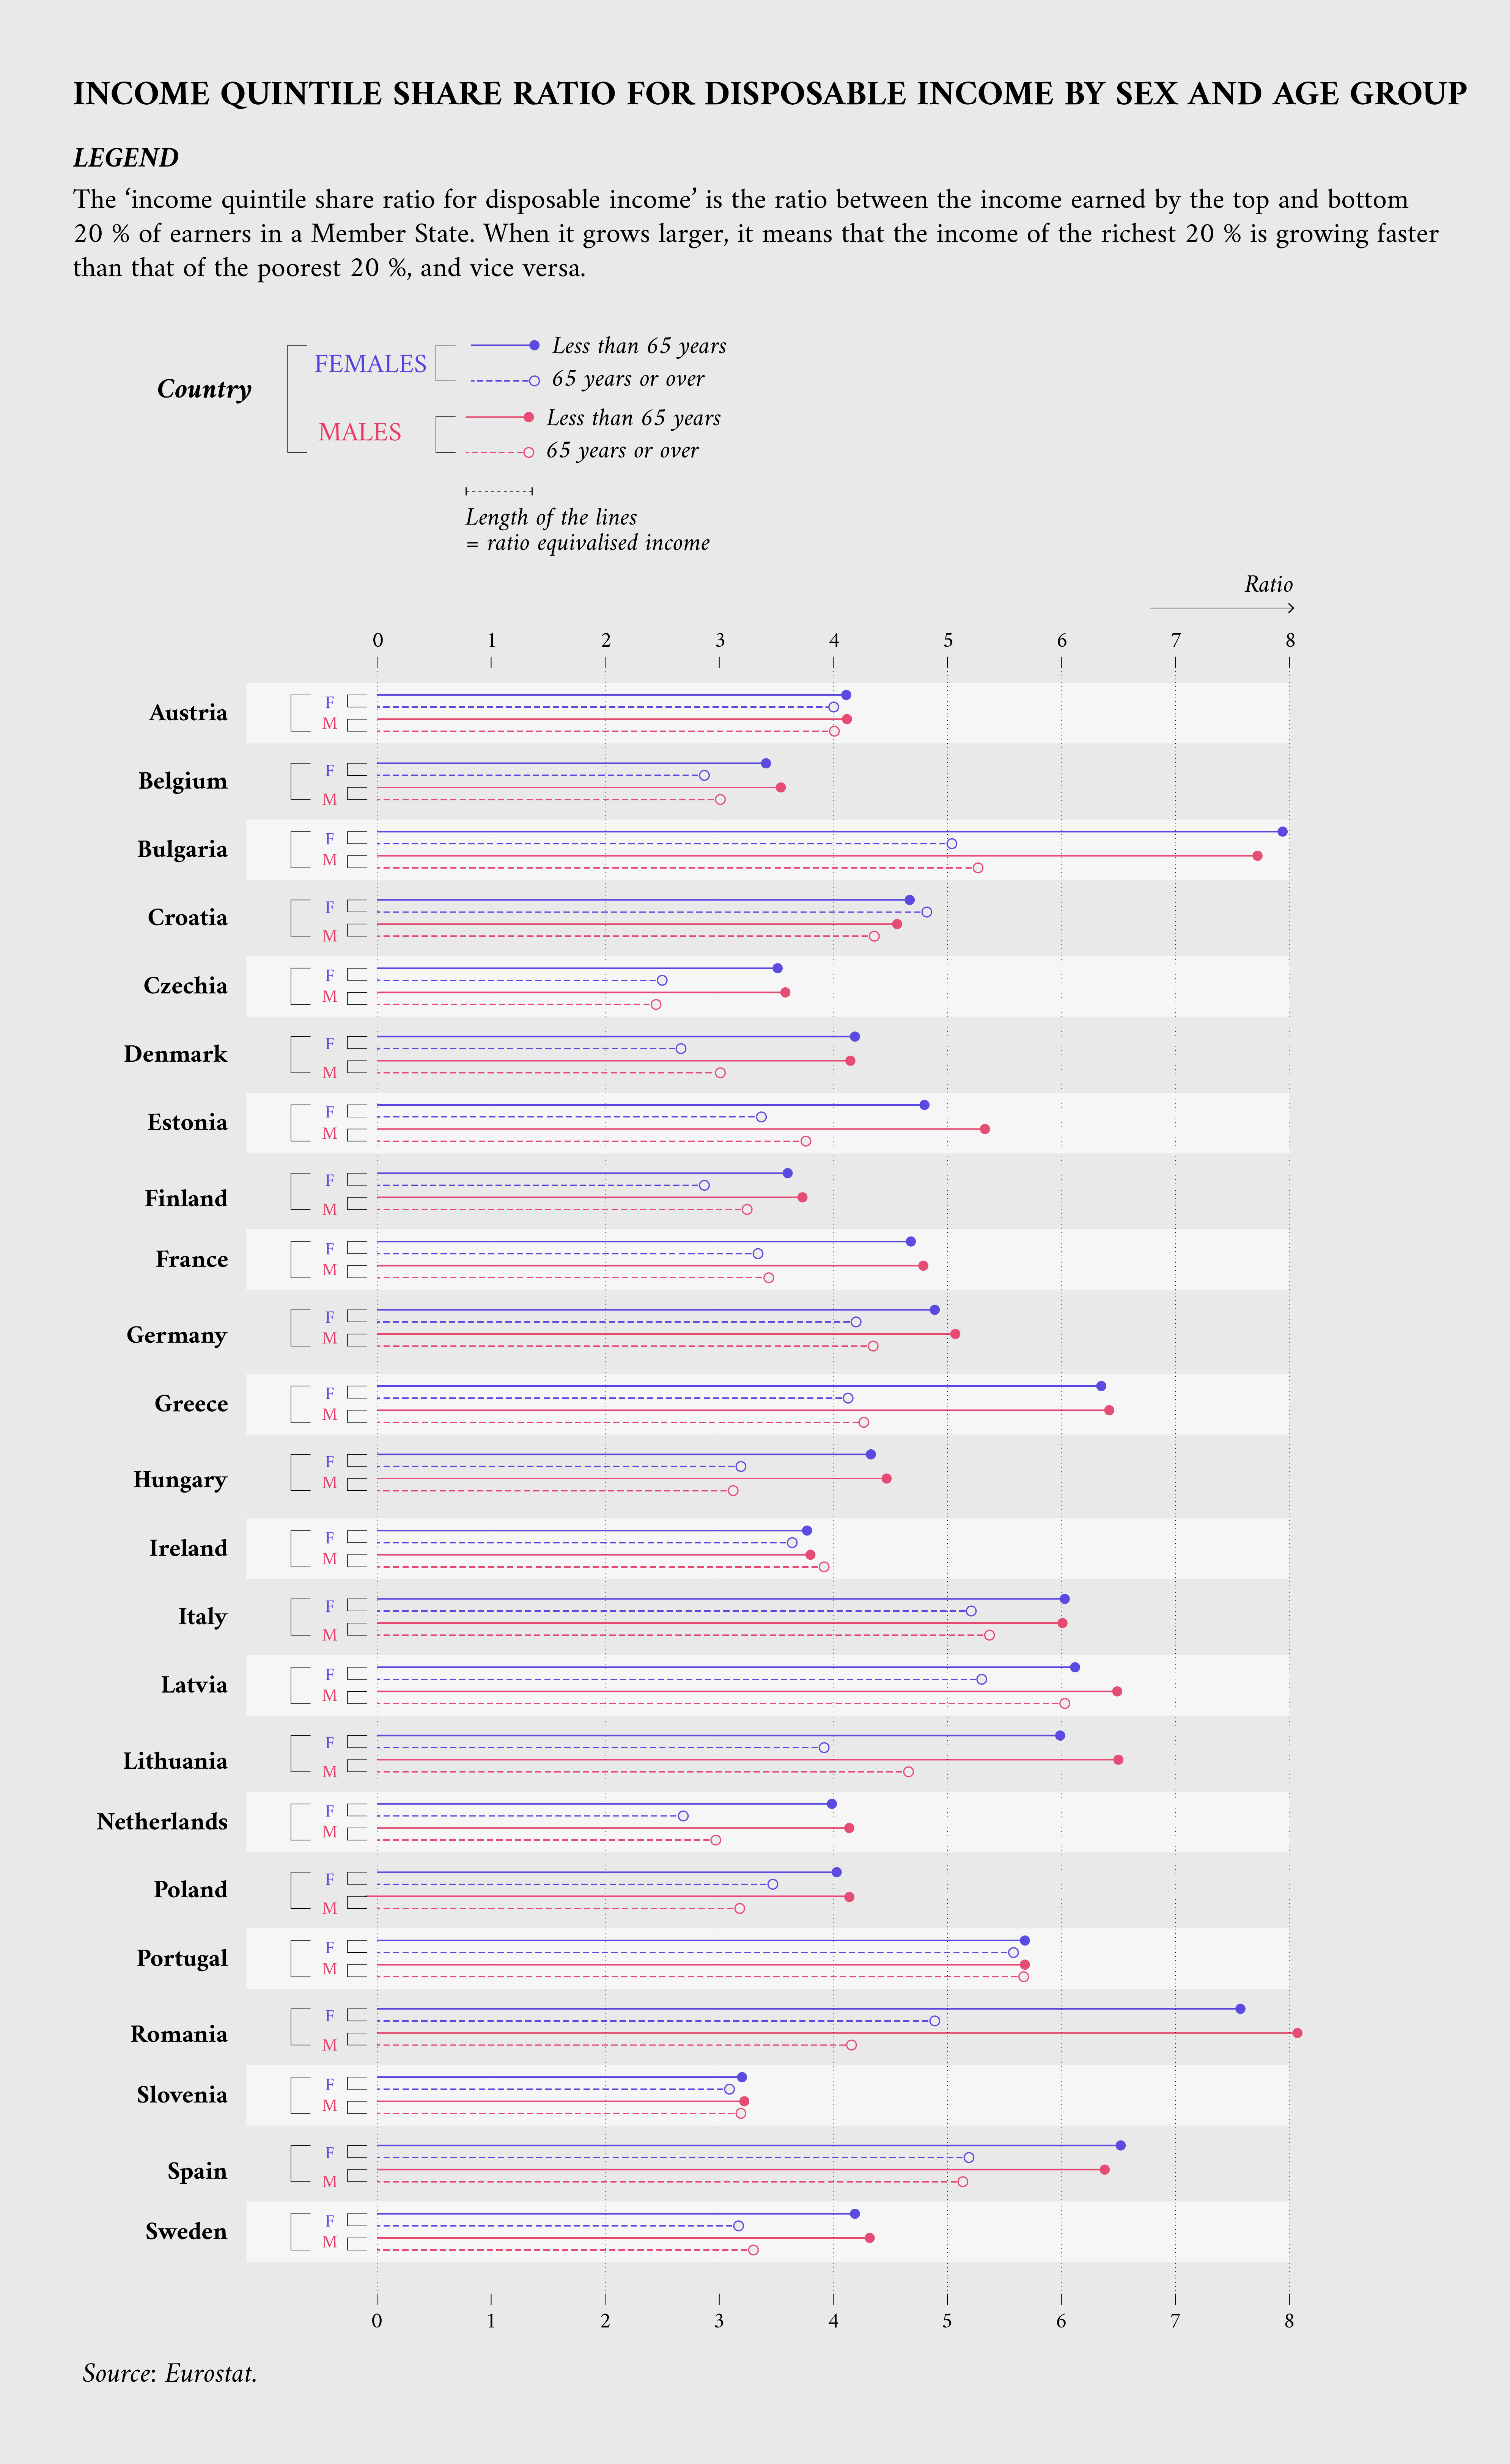
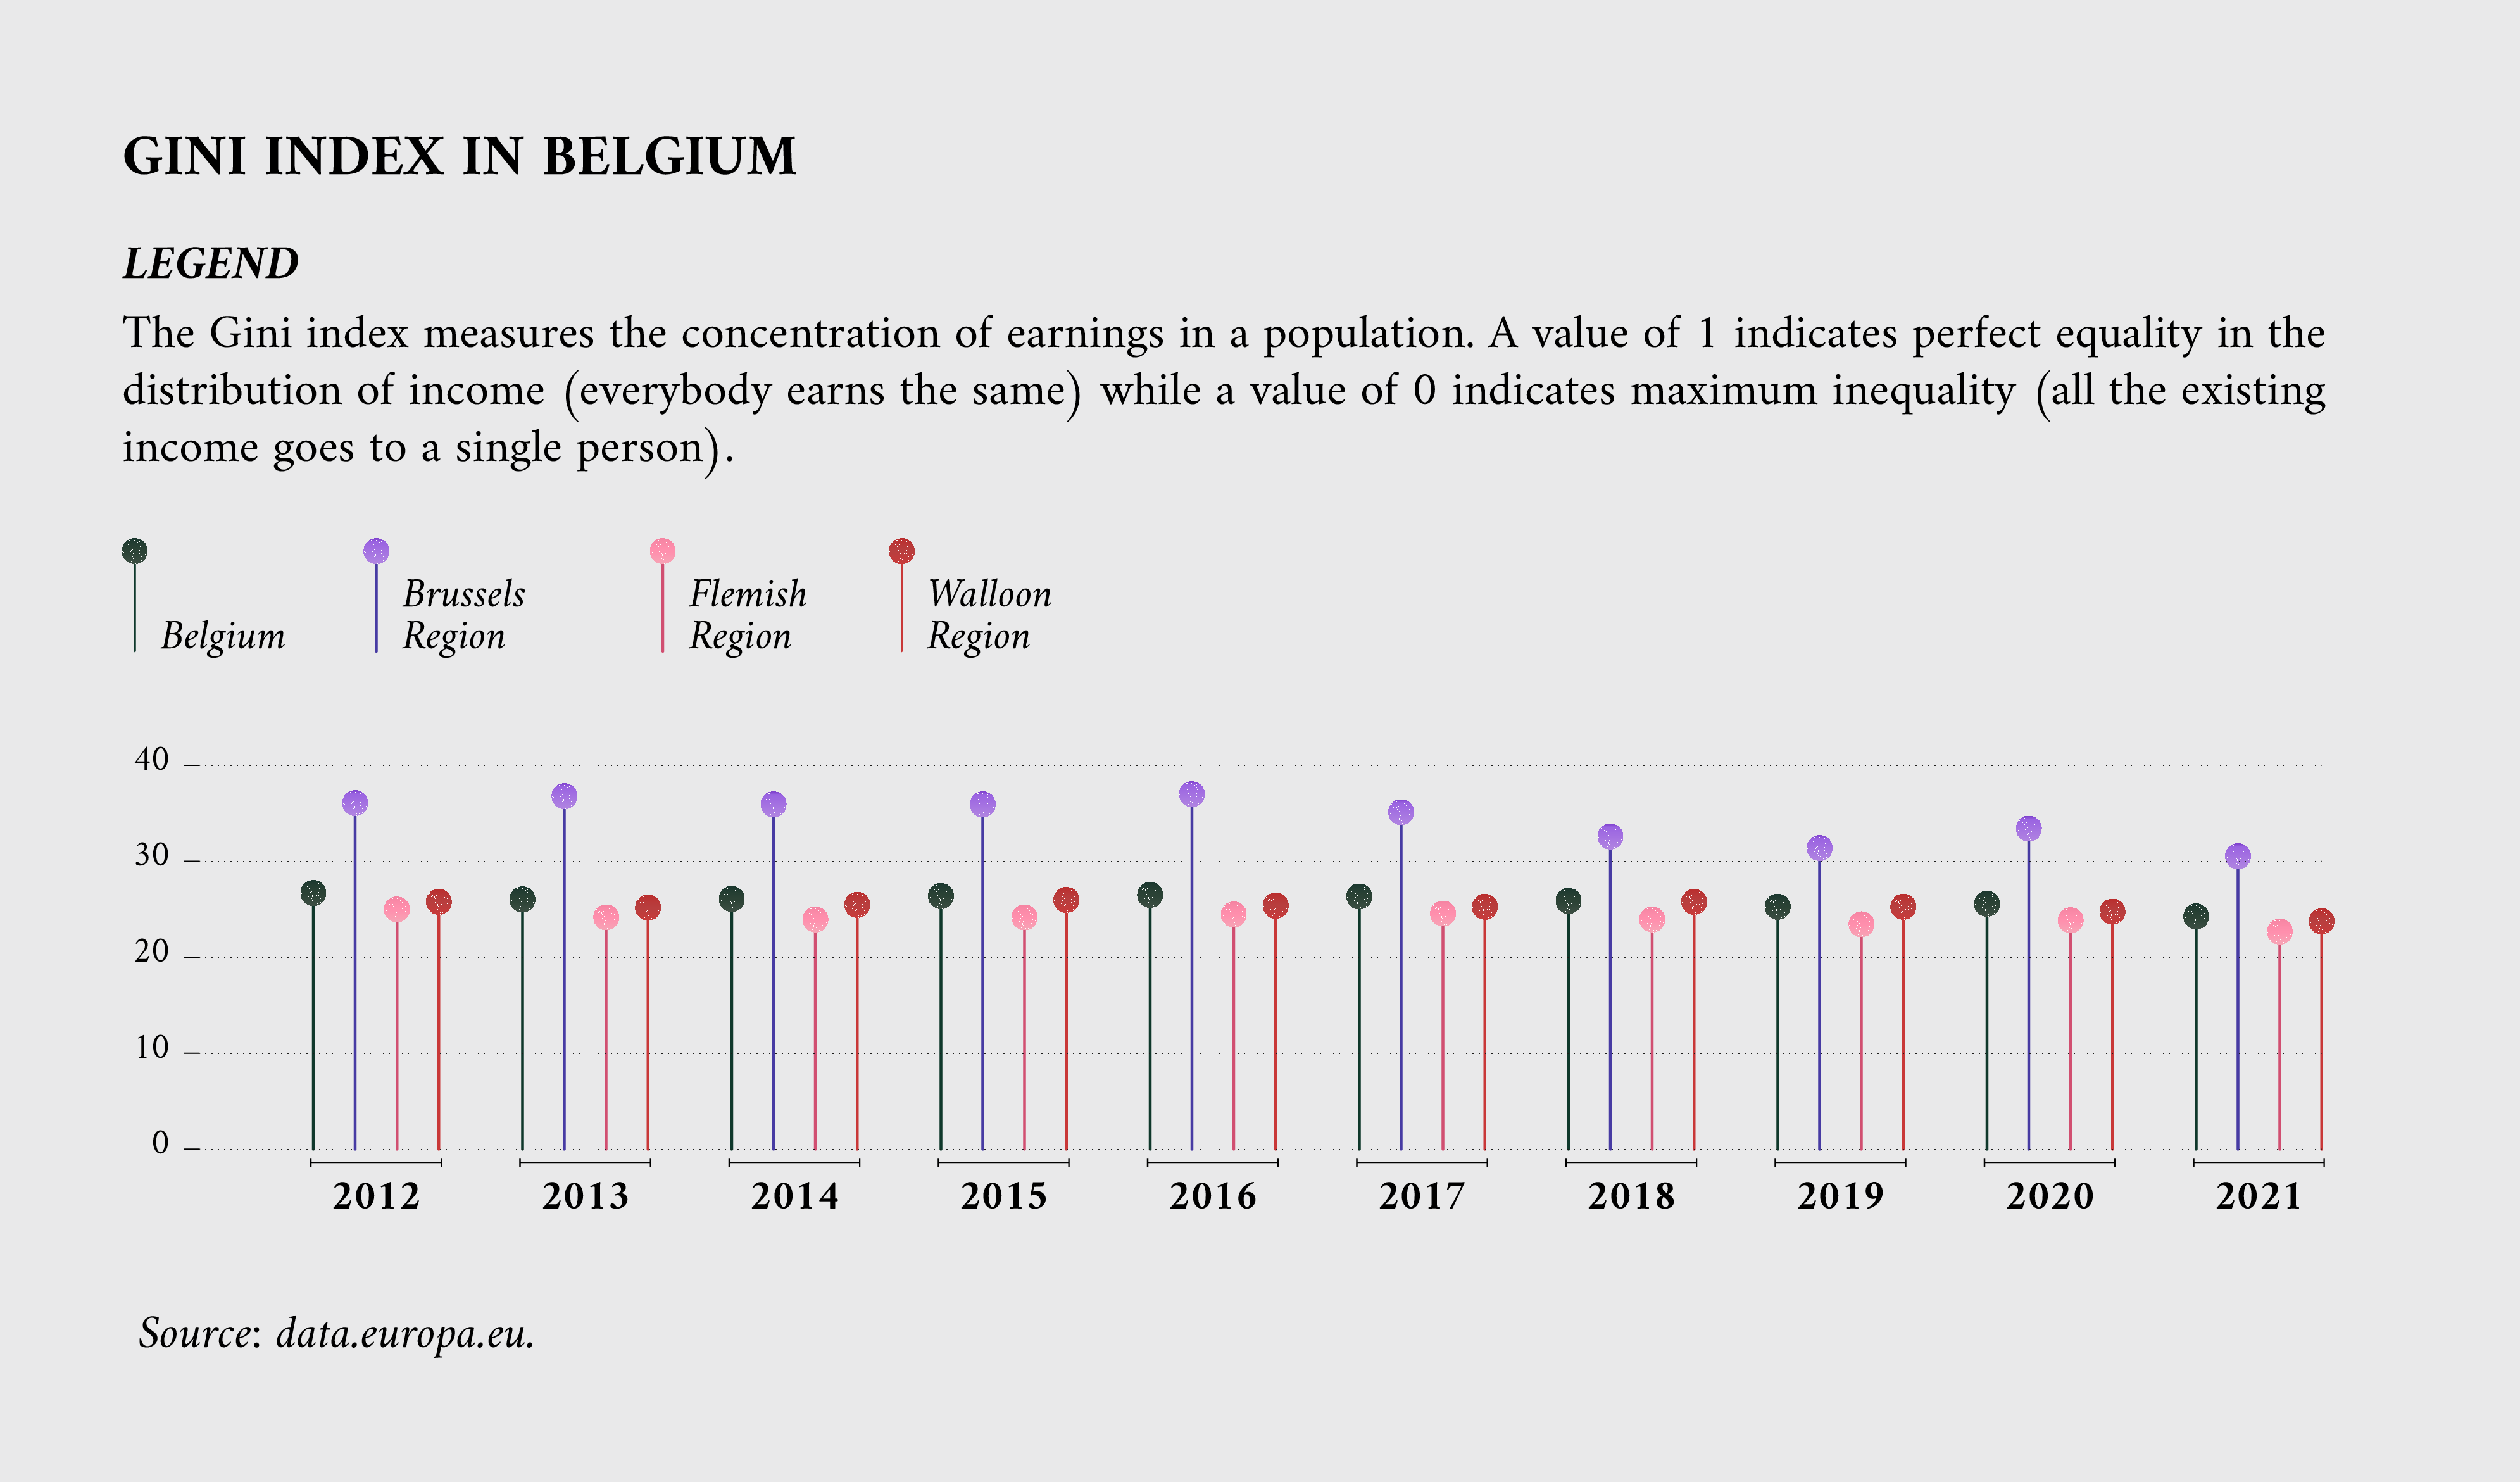
The data.europa.eu portal also offers datasets on the Gini coefficient, which measures the concentration of earnings in a given population. A value of 1 indicates perfect equality in the distribution of income (everybody earns the same) while a value of 0 indicates maximum inequality (all the existing income goes to a single person).
A dataset produced by the Belgian Federal Planning Bureau shows how the Gini coefficient has changed over time in Belgium since 2004, and allows for comparison to the EU-27 since 2010. For more recent years, regional breakdowns are available, which reveal disparities in income inequality between the Brussels Region and the Flemish and Walloon Regions.
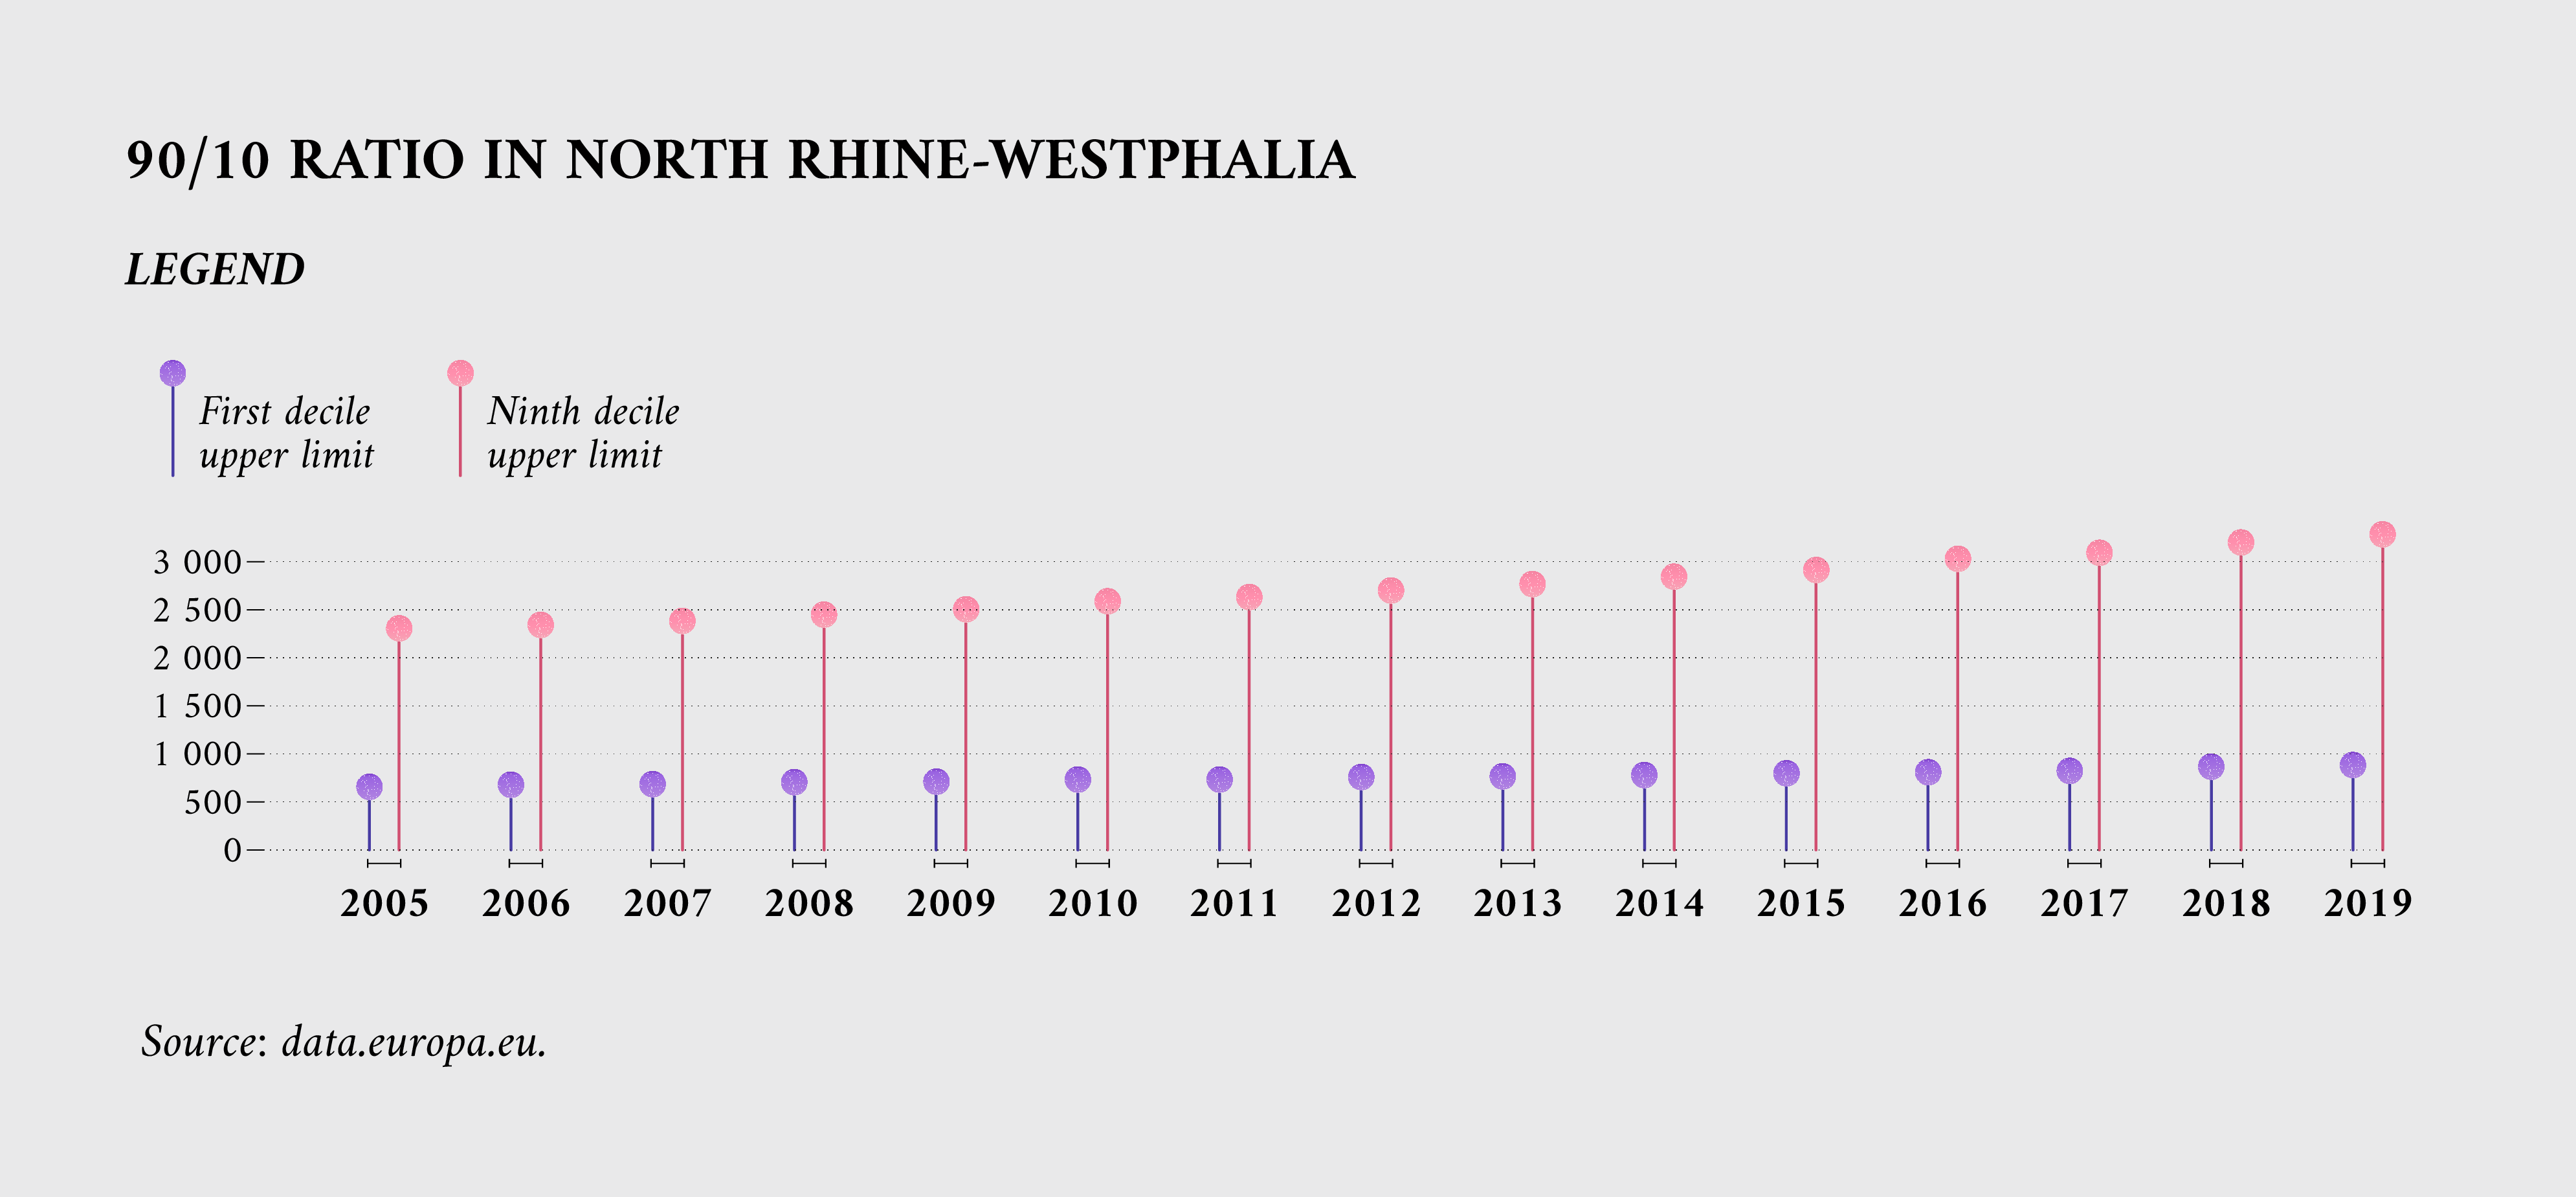
A more detailed view of the income ratio between rich and poor earners can be found in another dataset produced by the German Ministry of Labour, Health and Social Affairs of the State of North Rhine-Westphalia. It illustrates the ratio of the top and bottom 10 % of earners in the region from 2005 to 2019, and also provides details on the actual earnings of these groups.
Other data sources on income inequality
Eurostat has a section of its experimental statistics dedicated to income inequality and poverty. These statistics include flash estimates that provide timelier information and were used to estimate the impact of events like the COVID-19 pandemic on income inequality and labour. The ‘Statistics explained’ section on Eurostat’s website provides a more general overview of living conditions, income distribution and inequality in the EU.
Another EU organisation that produces data and analysis on income inequality is Eurofound, an agency that aims to ‘assist in the development of better social, employment and work-related policies. Eurofound’s website has a section with articles on income inequality and related topics such as social and gender inequality.
Other research on this topic includes the EU Science Hub’s project ‘Beyond averages – fairness in an economy that works for people’, which includes articles on inequality, social mobility and the perception of fairness among EU citizens.
Conclusion
As demonstrated by its inclusion in the list of high-value datasets, data on income inequality is deemed to be of high importance to society, the environment and the economy in the EU. EU organisations provide an extensive collection of data about income inequality that is accessible to the general public. These datasets can provide valuable insights and information about income inequality and its impacts on individuals, communities and society. They can help policymakers, researchers and other stakeholders to better understand the root causes of income inequality and develop effective policies to address it. In addition, these datasets can be used to track trends in income inequality over time and to identify areas where intervention may be needed to reduce disparities and promote greater economic fairness. Overall, the availability of these datasets is an important resource for anyone interested in studying or addressing issues related to income inequality.
Methodological notes
In the second graphic, the actual earning values presented are in euro and are adjusted for purchasing parity standard to ensure comparability. However, they are not adjusted for inflation and should not be used to measure the growth of earnings over time. The data in the third and fourth graphics is to be understood as equivalised disposable income, which is income after tax and monetary transfers adjusted to account for family size.
To download the visualisations, click on the following: HVD overview, income distribution 2005-2021, income distribution 2021, income quintile share ratio, GINI index, 90/10 ratio.
To download the data behind the visualisations, click on the following: inequality data
Article by Davide Mancino
Data visualisations by Federica Fragapane
