About Dtangle
Dtangle is a Swiss deep-tech spin-off from CERN research, with a multidisciplinary team. We develop a visual analytics technology that allows users to map complex and interconnected data without coding. We allow users to navigate without boundaries or limits into their data in order to visualise trends, white spaces and additional insights that machines or humans alone could not understand.
The CORDIS SDG challenge is exactly this kind of problem: 23,451 projects, 17 goals, 169 targets, thousands of organisations and billions of euros, all connected to each other. This entry shows how Dtangle turns it into a transparent mapping, a working prototype and live graphs that anyone can explore.
Team entry. This notebook is submitted by Dtangle SA (Geneva, Switzerland) as a team: Marc Siegrist (team leader, submitting on behalf of the team), Jean-Marie Le Goff and Paul Bagourd. Should the entry rank among the top three, the certificate should be issued under the team name Dtangle.

Every Horizon Europe project, read for the SDGs
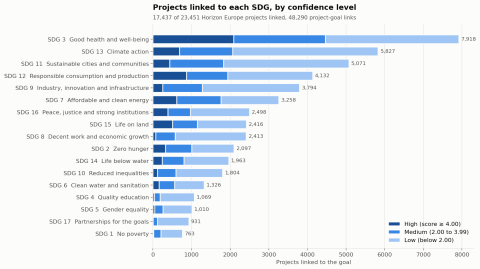
Dtangle read all 23,451 Horizon Europe projects in CORDIS and linked 17,437 of them (74 %) to the Sustainable Development Goals, at goal and at target level, using the EU Vocabularies SDG taxonomy. The result is 48,290 project-goal assignments, each with a confidence score, a confidence level and the sentence from the project that supports it.
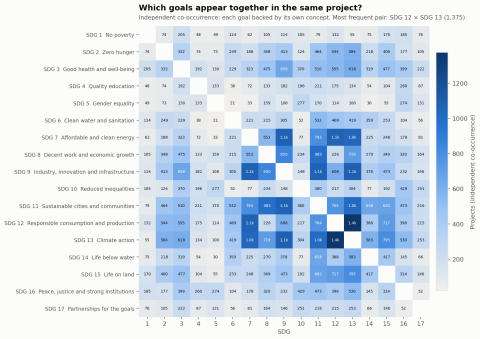
Health, climate and cities lead (SDG 3, 13 and 11). Poverty and partnerships (SDG 1 and 17) get the least attention. Two thirds of the linked projects serve several goals at once, and the way goals travel together is where connected-data analysis pays off.
Explainable by design, visual by nature
Each link points to the exact sentence of the project text that supports it, and all numbers can be recomputed from the delivered files. The method is deterministic: identical input yields identical output, and its accuracy was checked on an independently annotated set of projects.
In addition to the mapping, the entry maps where EU funding is directed, goal by goal and topic by topic, which goals and targets appear together, and where the portfolio leaves gaps in coverage.
Try it
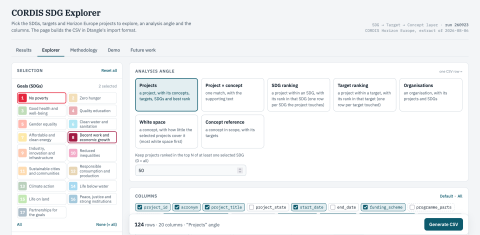
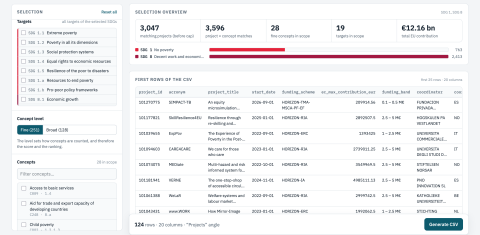
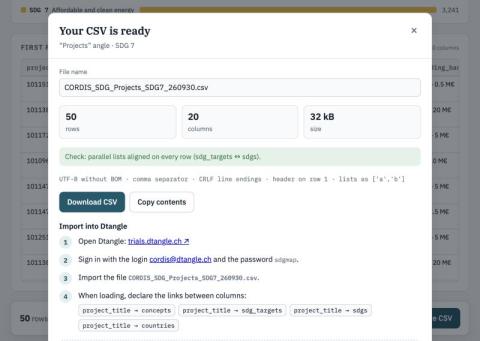
Dtangle's prototype lets anyone explore the results, filter by goal, target, country or programme, trace each ranking back to its evidence and export ready-made tables that open as live graphs in the Dtangle platform: https://cordis.dtangle.ch. Its Data tab publishes the complete mapping table.
This page is the notebook of the entry: the Solution tab explains the data preparation, the mapping logic and the results. It comes with the complete project-to-SDG mapping table, the visualisations, a discussion of limitations and a description document.