Mobility in Europe: What open data shows about travel patterns
Open data offers insights into travel choices, transport expenditures and Europe’s shift to sustainable mobility
How people move for regional and long-distance journeys shapes everyday life, but what practical factors mostly influence travel choices? Also, do Europeans travel in similar ways, or do their choices differ widely across Member States? Open data makes it possible to look beyond assumptions.
This data story explores how Europeans travel, what factors matter most when planning their trips, how transport costs are distributed across households, and how electric car adoption varies across the EU. Together, these insights highlight both shared trends and clear contrasts in Europe’s changing mobility landscape.
How do EU citizens travel over longer distances and what factors shape these choices?
Travelling over longer distances involves a range of practical considerations. Whether for a work-related trip, tourism, or a family visit, people balance cost, travel time and comfort when deciding whether to use the car, take the train or fly.
Based on a recent Eurobarometer survey, Figure 1a shows the transport modes EU citizens report having used for regional (> 50 km) or long-distance (> 300 km) journeys over the past two years, without distinguishing between the two. Cars are by far the most commonly used mode, reported by 82 % of respondents. Trains (53 %), planes (37 %) and coaches (31 %) follow as common alternatives, while ferries (9 %), bicycles (9 %) and motorbikes (4 %) are used much less frequently. These choices reflect more than personal preference. For example, differences between Member States are most prominent for air and sea travel, reflecting infrastructure, connectivity and geographic factors, such as terrain and coastlines in countries such as Greece, Cyprus and Malta.
When planning long-distance journeys, cost-related considerations play a central role. As shown in Figure 1b, cost is the most frequently cited (61 % of respondents) factor across the EU (and in all Member States individually, except the Netherlands and Slovakia), followed by travel time (47 %) and departure and arrival times (36 %). Comfort (29 %) is also mentioned by a significant share of respondents, highlighting the importance of convenience alongside speed and price. While sustainability matters to many people in general, only about one in ten respondents mentioned a journey’s environmental impact as a deciding factor. In other words, cost, time and comfort usually outweigh ecological concerns when people choose how to travel.
Taken together, the data show that affordability, time efficiency and departure/arrival times shape long-distance travel decisions across the EU. These priorities help explain why private cars remain widely used and underline the challenges of encouraging a shift toward more sustainable transport options.
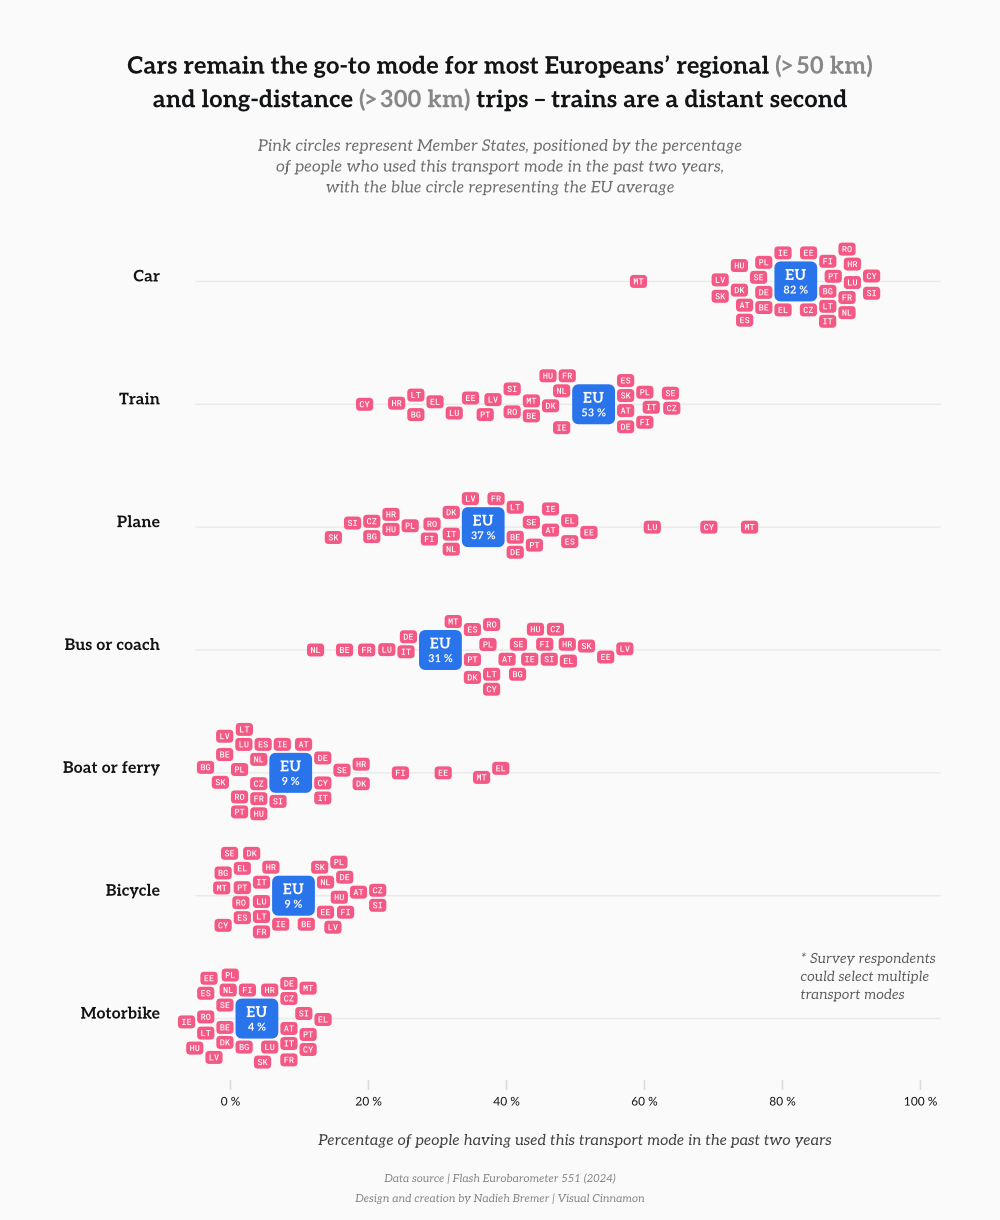
Figure 1a: Transport modes used for regional and long-distance travel in the EU (2024)
Source: Eurobarometer / European Data Portal.
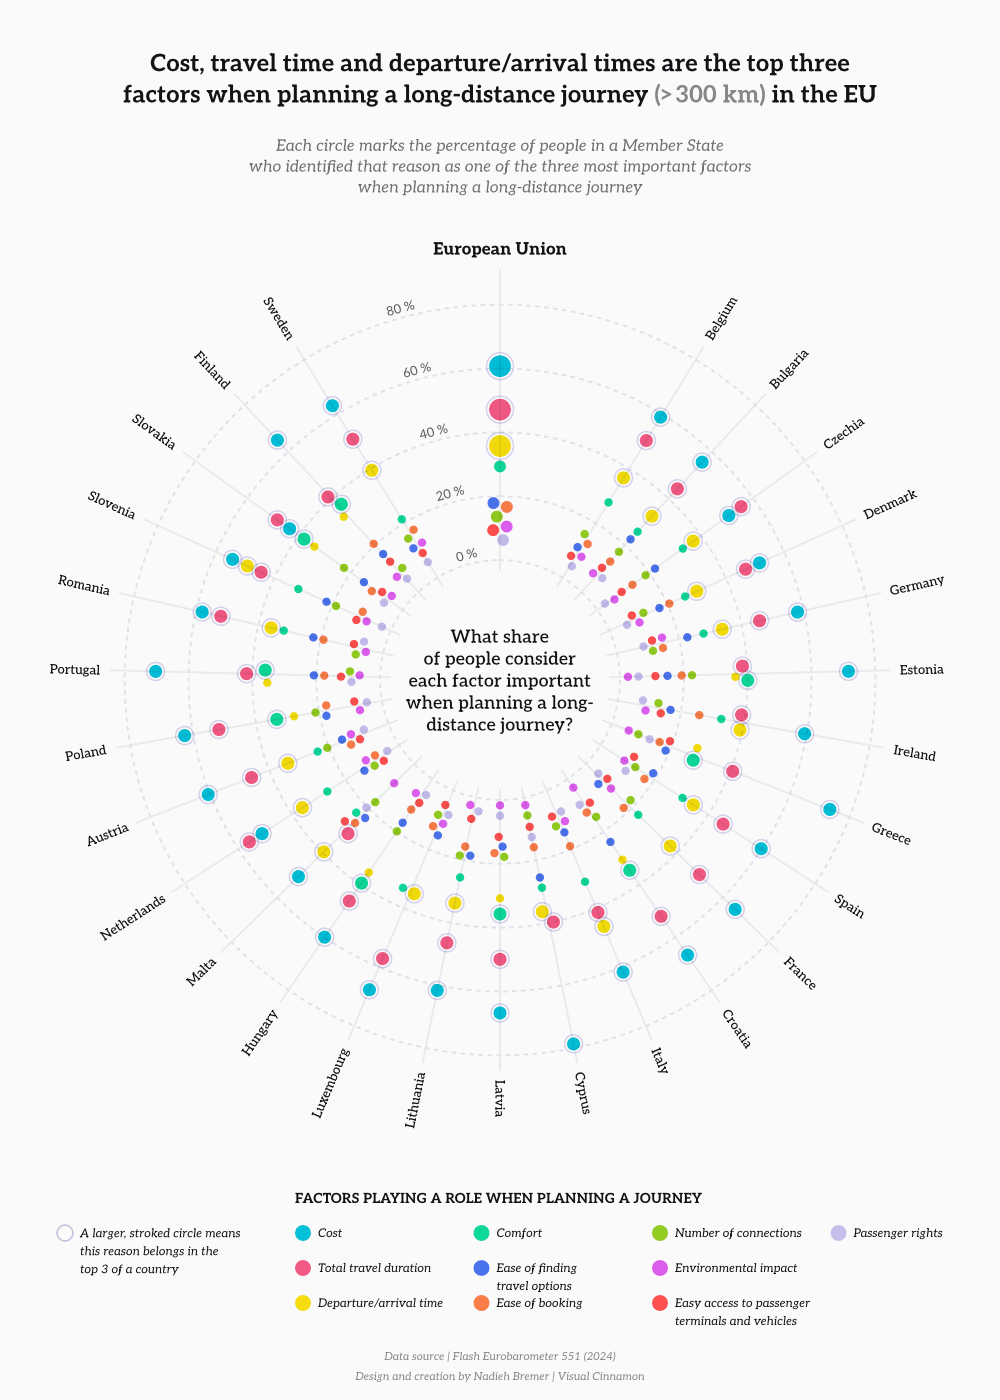
Figure 1b: Factors influencing long-distance travel decisions in the EU (2024)
Source: Eurobarometer / European Data Portal.
How much do households spend on transport and on what?
Transport is a regular and often significant part of household spending. Figure 2 shows the share of total household consumption expenditure devoted to transport (regardless of distance or travel purpose) across the EU and how this spending is distributed across different cost categories.
Transport accounts for 12.7 % of household expenditure in the EU, making it the third-largest spending category after housing and food. However, this share varies widely between Member States. In Slovenia, at the top end of the range, people devote around 17 % of their expenditure to transport – almost three times as much as in Slovakia, at the bottom end of the spectrum, where the share is 6 %. Such differences reflect how mobility is organised in each country and what people rely on to get around, rather than price levels alone.
The composition of transport spending varies across the EU. In most countries, the largest share of transport expenditure goes toward owning and using private vehicles, with fuel, maintenance and vehicle purchases accounting for most costs. Some Member States stand out for specific reasons. In Bulgaria, Greece, Malta and Romania, a relatively larger share of transport spending goes to passenger transport services, reflecting lower reliance on private vehicles. Luxembourg, despite offering free public transport since 2020, still sees a modest share of household spending in this category, likely due to the continued use of paid options such as taxis and long-distance rail or coach services. In addition, Greece shows an unusually high share of spending on transport services for goods, such as parcel delivery and moving, likely linked to the country’s island geography and dispersed, low-density market.
Taken together, these patterns show that how people move – and what they rely on to do so – has a direct impact on household budgets. They also help explain why changes in mobility systems, including the shift toward cleaner vehicles and alternative transport options, have different cost implications across the EU.
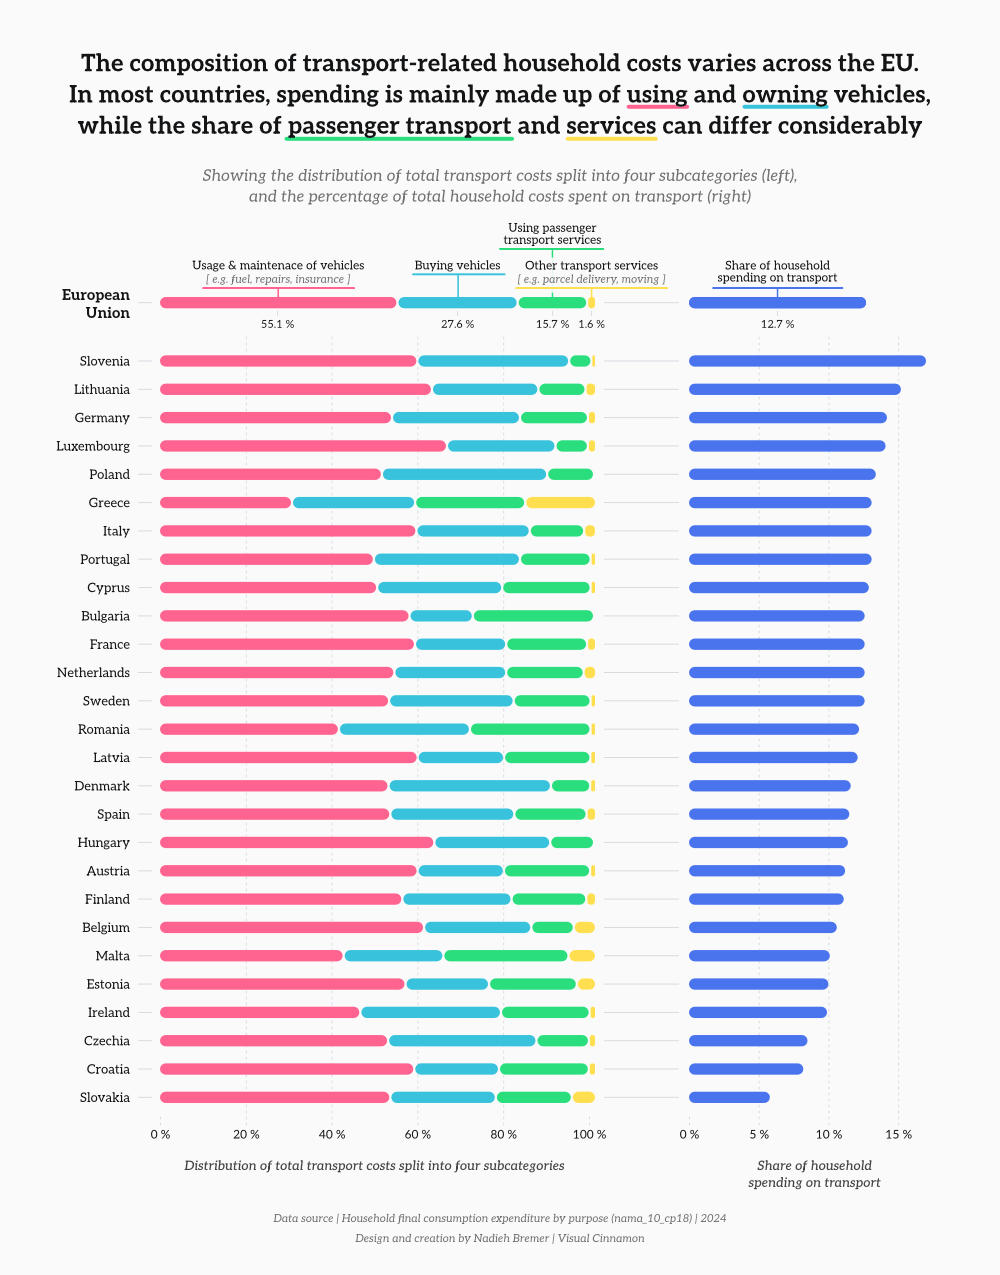
Figure 2: Household transport expenditure by cost category in the EU (2024)
Source: Eurostat / European Data Portal.
How fast is the shift toward electric cars across the EU?
As Europe moves toward a low-carbon economy, everyday mobility is changing. Transport remains one of the EU’s largest emitters, making reductions in this sector essential for achieving the EU’s 2050 climate neutrality objective.
Figure 3a illustrates the evolution of new registrations of electric vehicles in the EU between 2010 and 2024, covering both battery electric vehicles (BEVs) and plug-in hybrid electric vehicles (PHEVs). Annual registrations increased from fewer than 1 000 vehicles in 2010 to approximately 2.2 million in 2024, with the most pronounced growth occurring after 2019. During the same period, their combined share in total new car registrations rose from about 3 % in 2019 to 21 % in 2024.
Moreover, among the electric vehicles registered in 2024, around 1.4 million were BEVs and roughly 800 000 were PHEVs, indicating a growing preference for fully electric vehicles. However, the combined share of electric vehicles in new registrations fell by around two percentage points in 2024 compared with the previous year, showing that recent growth has not been linear. Moreover, petrol and diesel cars still accounted for about 79 % of new registrations in 2024, highlighting that, while the transition to electric mobility is progressing, vehicles with conventional internal combustion engines remain predominant in the EU market.
Figure 3b highlights large differences between Member States in 2024. In some northern European countries, such as Denmark, Finland and Sweden, more than half of new cars were BEVs or PHEVs, well above the EU average of 21 %. This level of uptake appears to be the norm across Nordic countries: in Norway – a non-EU country – electric vehicles made up nearly 90 % of all new car registrations in 2024, showing how far electrification can go when strongly supported by policy. In contrast, in several eastern Member States, electric cars accounted for only a small part of new registrations, with petrol and diesel vehicles remaining dominant. A few countries also show notable use of alternative fuels: in France and Sweden, a tiny yet visible share of new cars can run on bioethanol. In several Member States, a very small share of new cars also run on liquefied petroleum gas (LPG), a fossil fuel commonly used as a cheaper alternative to petrol, though its uptake remains marginal at the EU level. Beyond the fuels discussed above, you can also find more information on hydrogen fuel cell electric vehicles in one of our earlier data stories.
Overall, the data show that electric car registrations have expanded significantly at the EU level, while national patterns continue to differ widely. The shift away from fossil-fuel cars is clearly underway, but is progressing at different speeds across the EU.
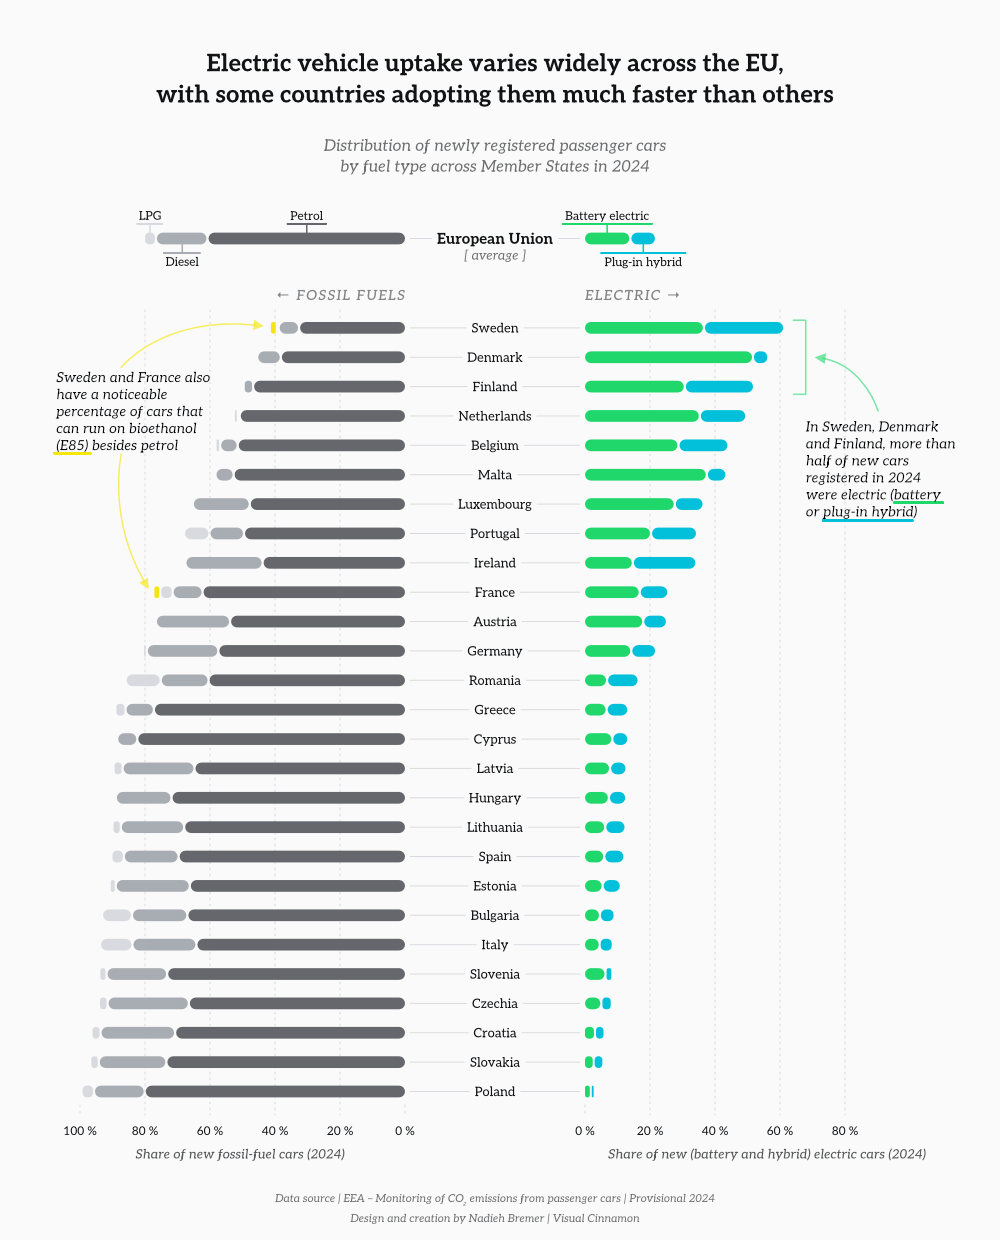
Figure 3a: New registrations of battery electric and plug-in hybrid cars in the EU (2010–2024)
Source: European Environmental Agency.
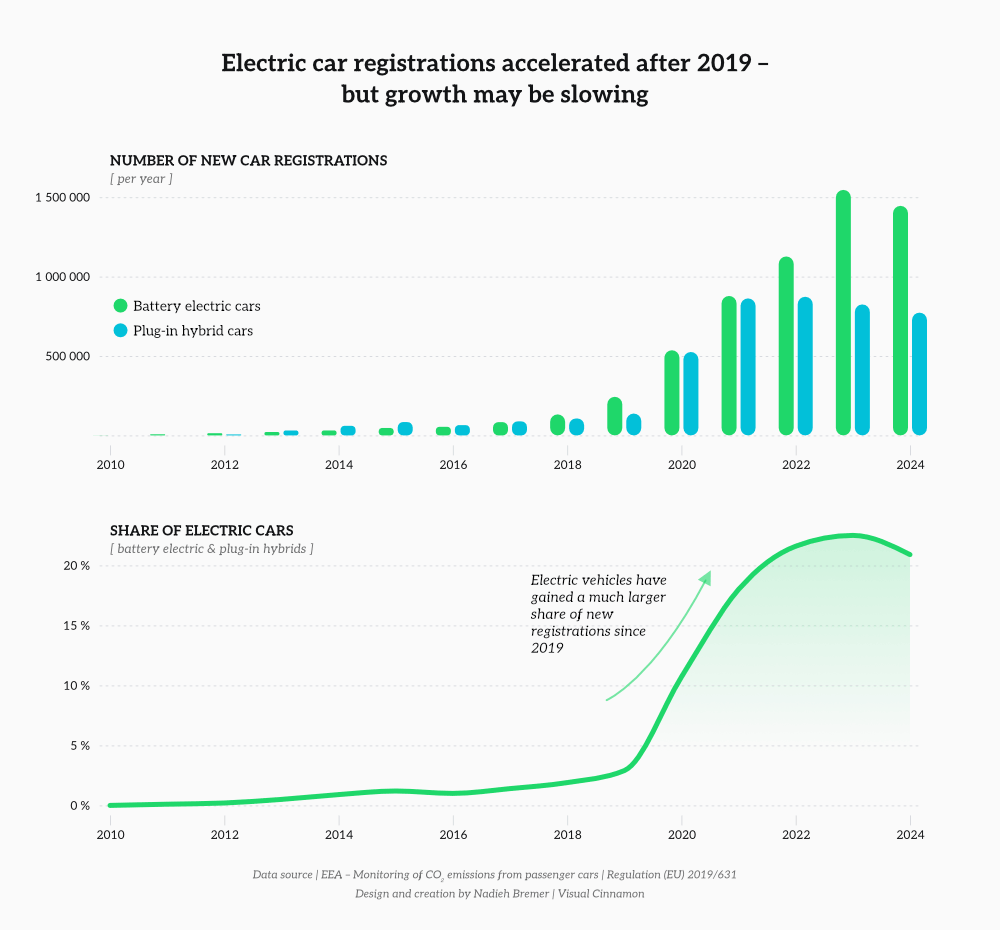
Figure 3b: Share of newly registered cars by fuel type in the EU (2024)
Source: European Environmental Agency.
Conclusion
Across the EU, mobility is shaped by a mix of shared trends and differences. Cars remain central to how people travel, especially for longer journeys, and people across the Member States tend to prioritise similar factors when planning such journeys: notably cost, travel time and departure or arrival times. Transport expenses are a significant share of household budgets, with notable differences across Member States.
The data also show that change is underway. Electric cars are gaining ground, yet adoption varies widely across Europe, and fossil-fuel vehicles still account for the majority of new cars in much of the EU. Together, these patterns highlight a European mobility landscape that is evolving, but not uniformly. Understanding these differences with the help of open data can help move beyond broad assumptions and offer a clearer picture of how mobility works in practice across the EU today.