Work Across the EU: Jobs, pay and time off
A data-driven look at employment sectors, working hours, pay and leave entitlements across the EU
How many hours do Europeans actually work? Who earns the most for their time and who enjoys the longest holidays? Which sectors form the backbone of employment in each Member State?
One may think that across Europe people’s working lives should be quite similar, but the data uncovers a striking diversity. From factories in central Europe to hospitals in the Nordic countries, from tourism in the south to tech and finance hubs in the west, the rhythm of work varies as much as the cultures and economies themselves.
This data story uses open data to uncover how Europeans work, earn and rest. It looks at the sectors that employ the most people, compares working hours and wages across industries and reveals how much paid time off workers enjoy in different Member States. Together, these insights paint a picture of what a typical job means across the EU and how the balance between time worked and free time differs from one Member State to another.
In what sectors do Europeans work the most?
A country’s job mix says a lot about its economy and its society. Open data on employment by sector shows what drives national economies and what people across Europe do during their working lives.
Across the EU, four sectors employ more than half of all workers: manufacturing (17 %), health and social care (13 %), wholesale and retail trade (13 %) and education (9 %). The map below highlights the main sector in each Member State, revealing distinct regional patterns.
In central and eastern Europe, including Italy, the Baltic states and much of the Balkans, manufacturing dominates. These economies are anchored in industry, exports and long traditions of engineering.
In northern and western Europe, from the Nordic countries to France and the Netherlands, health and social care provides the largest share of jobs, reflecting strong public-service systems, possibly in combination with ageing populations.
A third group, including Ireland, Spain and Cyprus, sees wholesale and retail trade as the dominant employment sector. These are service-oriented economies where SMEs in retail and hospitality are widespread and tourism-related demand is significant, especially for Spain and Cyprus.
Greece stands out with accommodation and food services being its biggest employer – something that is rare elsewhere in the EU, where this sector accounts for only 4 % of jobs. However, it reflects Greece’s major reliance on tourism, particularly during the summer season.
These contrasts show how employment structures mirror geography, demography and history. Recognising them helps explain why working life can feel so different from one country to another, even within the European Union.
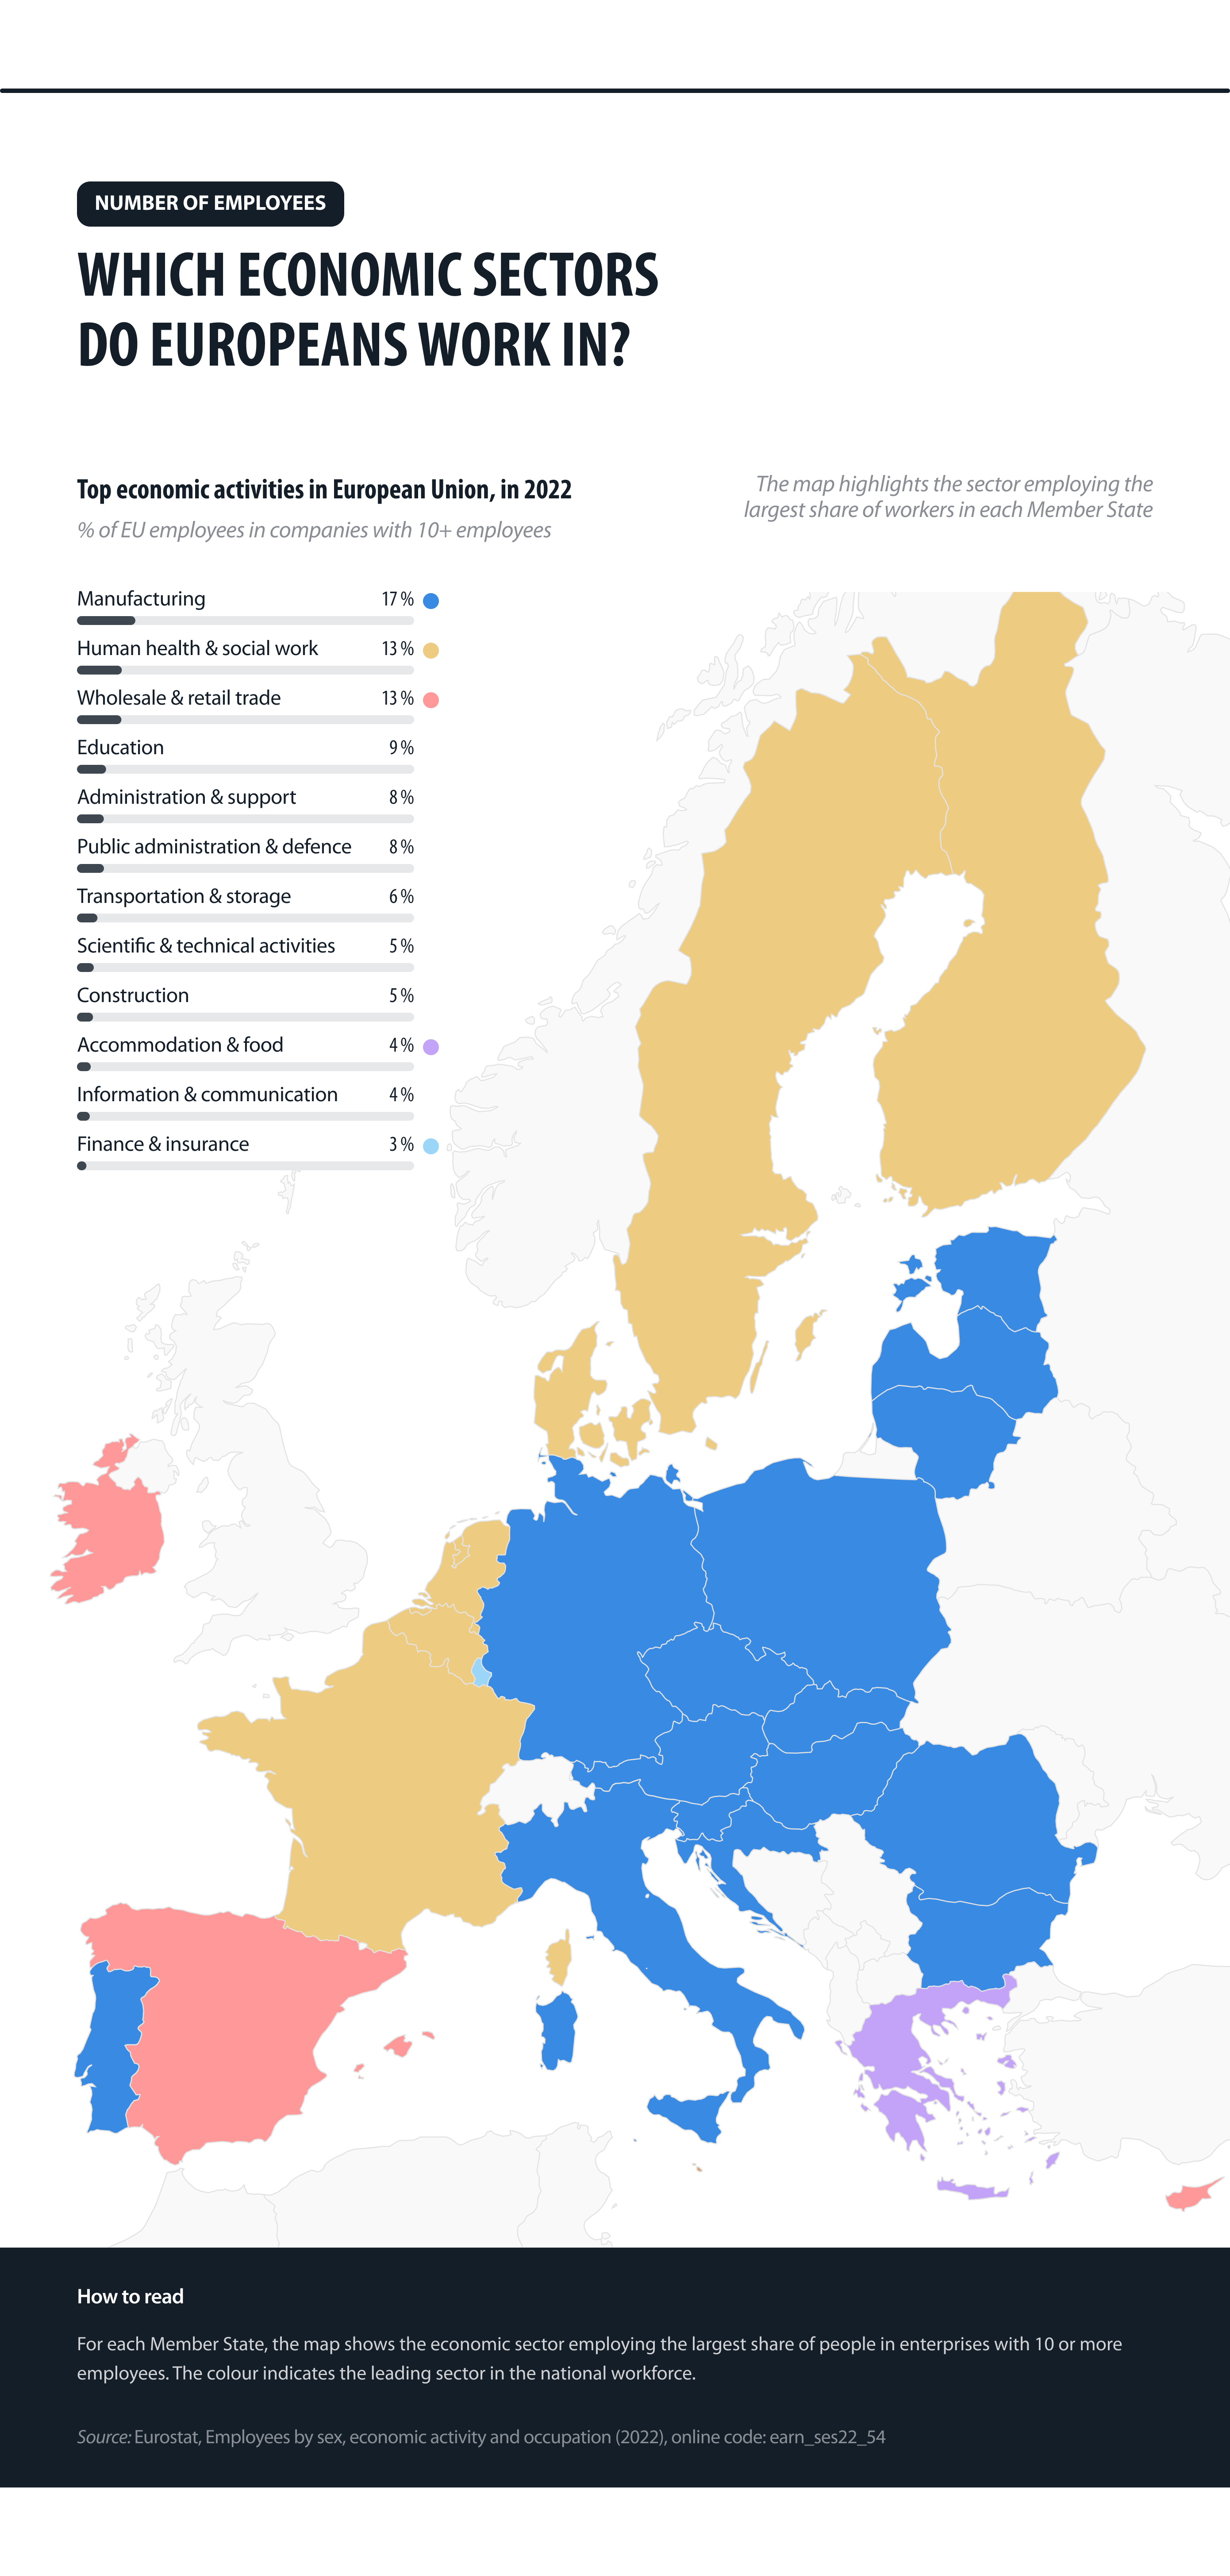
Figure 1: Largest employment sector in each Member State (2022)
Source: Eurostat / data.europa.eu.
Where do Europeans work the most – and how much do they earn?
Across Europe, not all jobs are equal. Some employ millions but pay modestly; others pay far more but account for only a small share of the workforce. Open data on average paid hours and gross hourly earnings reveals how work and pay diverge across sectors and Member States.
As Figure 2.1 shows, most Europeans work in mid-pay sectors such as manufacturing, trade, public administration, health and social care or education. In these areas, people put in roughly 150–170 hours per month for EUR 18–25 per hour on average.
Lower-pay service sectors, such as accommodation and food services, administrative support, or construction record the smallest wages (under EUR 20 per hour on average across Member States). These sectors typically employ a larger share of workers in roles requiring low or medium qualifications, often involving shift or seasonal work. This contributes to lower average earnings and, in some cases, low paid hours.
High-pay specialist sectors including finance, information and communication, scientific services and energy stand apart. They combine standard working hours with average hourly earnings that can exceed EUR 30–35 per hour, but they employ comparatively few people.
Figure 2.2 reveals that wage gaps are far wider between Member States than between sectors. Average hourly pay for similar roles can differ by more than a factor of 10 across the EU. The best-paid jobs overall appear in education in Luxembourg and the arts in Denmark, illustrating how national wage structures can outweigh sector averages.
Taken together, the data points to two main conclusions: sectors employing the most people usually offer average wages, while high-income sectors remain relatively small. In addition, earning potential depends less on what people do than where they do it.
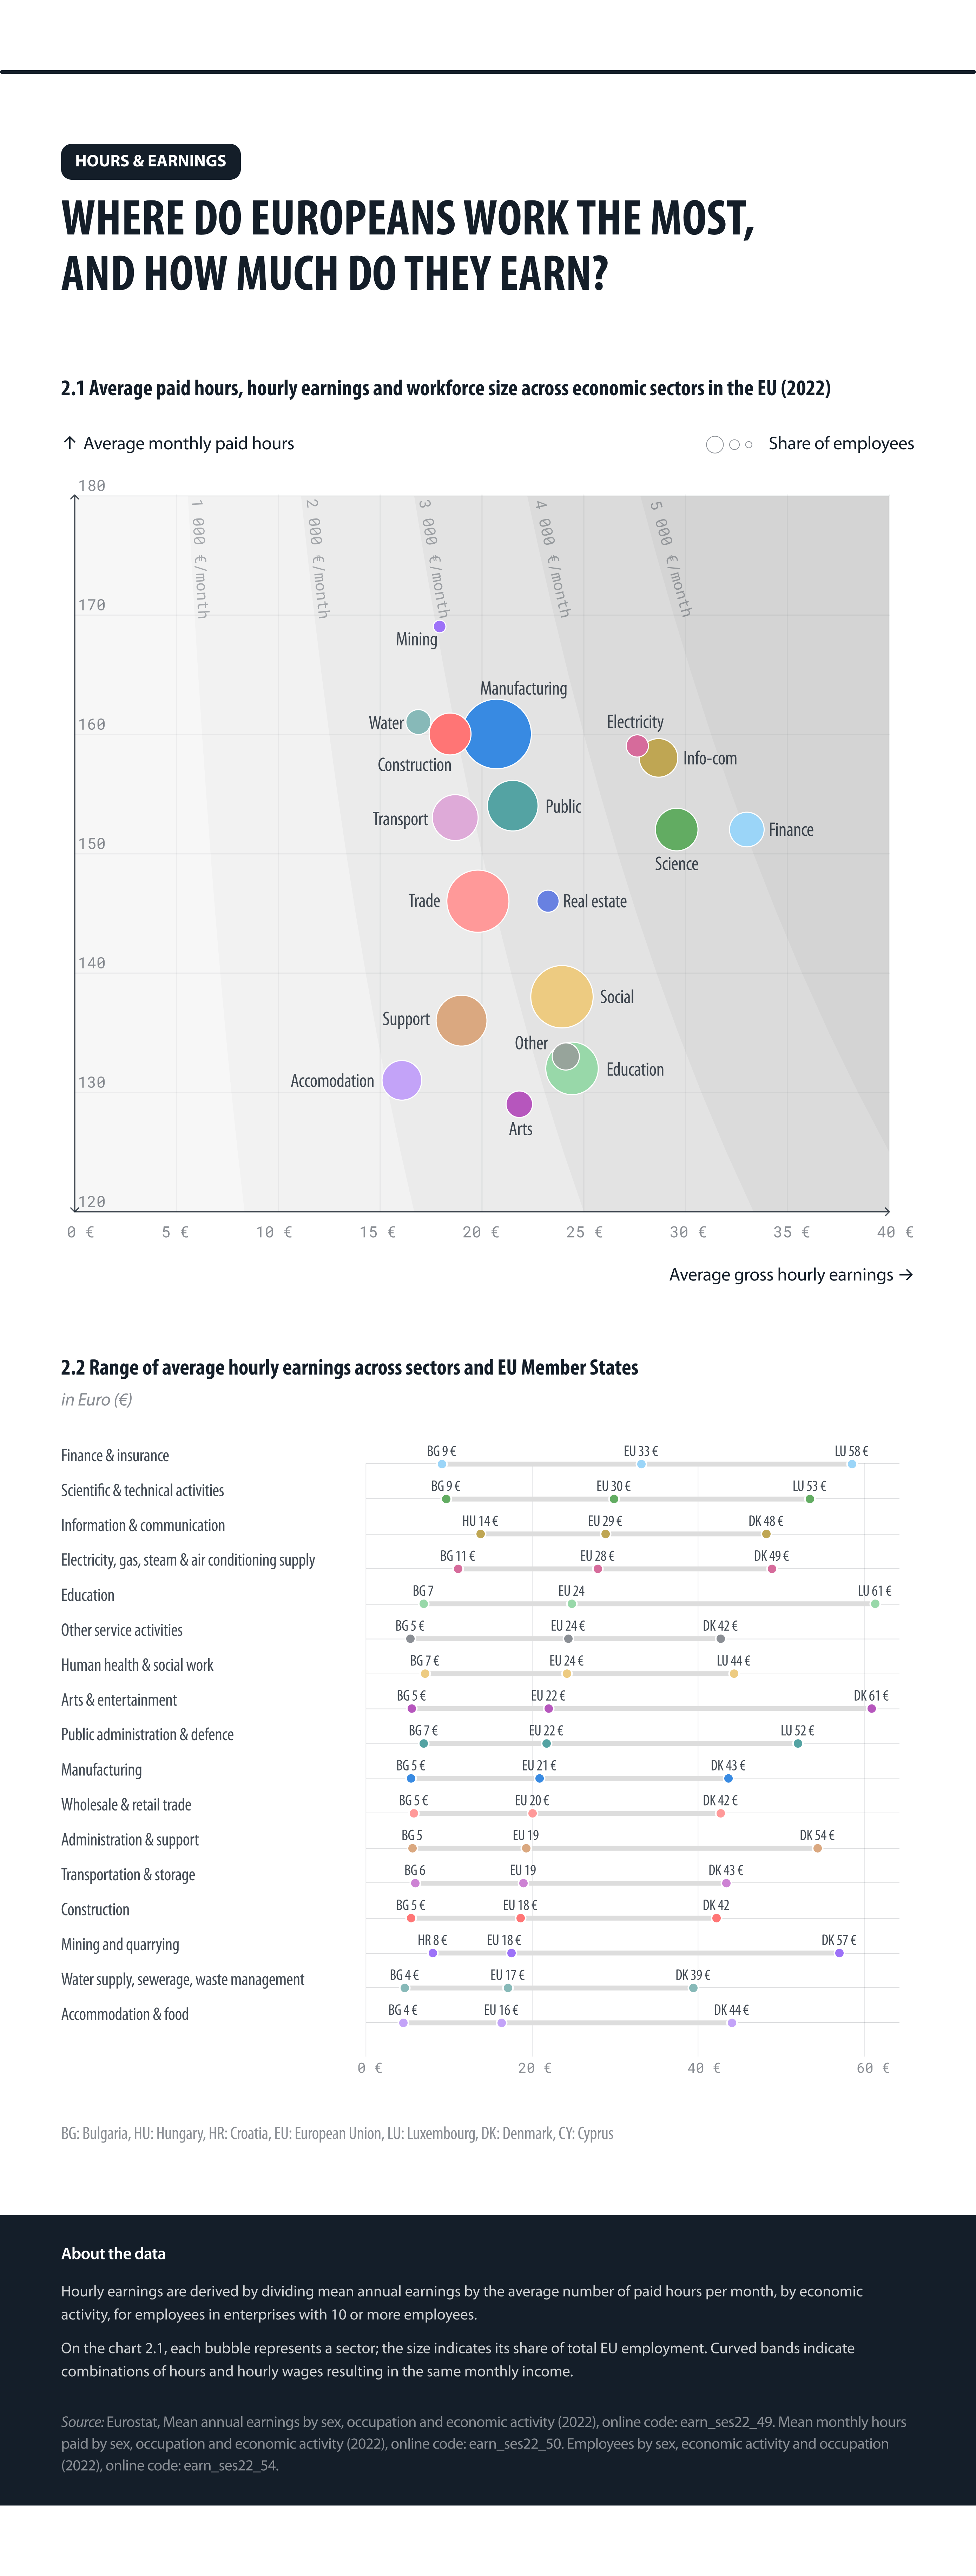
Figure 2: Average paid hours per month and gross hourly earnings by sector, EU (2022)
Source: Eurostat / data.europa.eu; Eurostat / data.europa.eu.
Who enjoys the most time off in the EU?
Time away from work is essential for maintaining balance – giving people the chance to recharge, spend time with family and friends or simply step back from daily routine. Yet across the EU, paid time off varies widely depending on national rules, workplace practices and collective agreements.
Figure 3 compares the total baseline number of paid annual leave days and public holidays across EU Member States and Norway, based on the latest comparable data. Malta, Denmark and Germany top the list with around 40 to 42 days off per year.
If we exclude public holidays and consider only paid annual leave, EU law entitles every worker to at least four weeks (20 days). Most Member States – 19 out of 27 – follow this minimum standard, but several of them grant additional days through collective agreements. Others go beyond the EU requirement by law, offering between 22 and 28 days of paid annual leave.
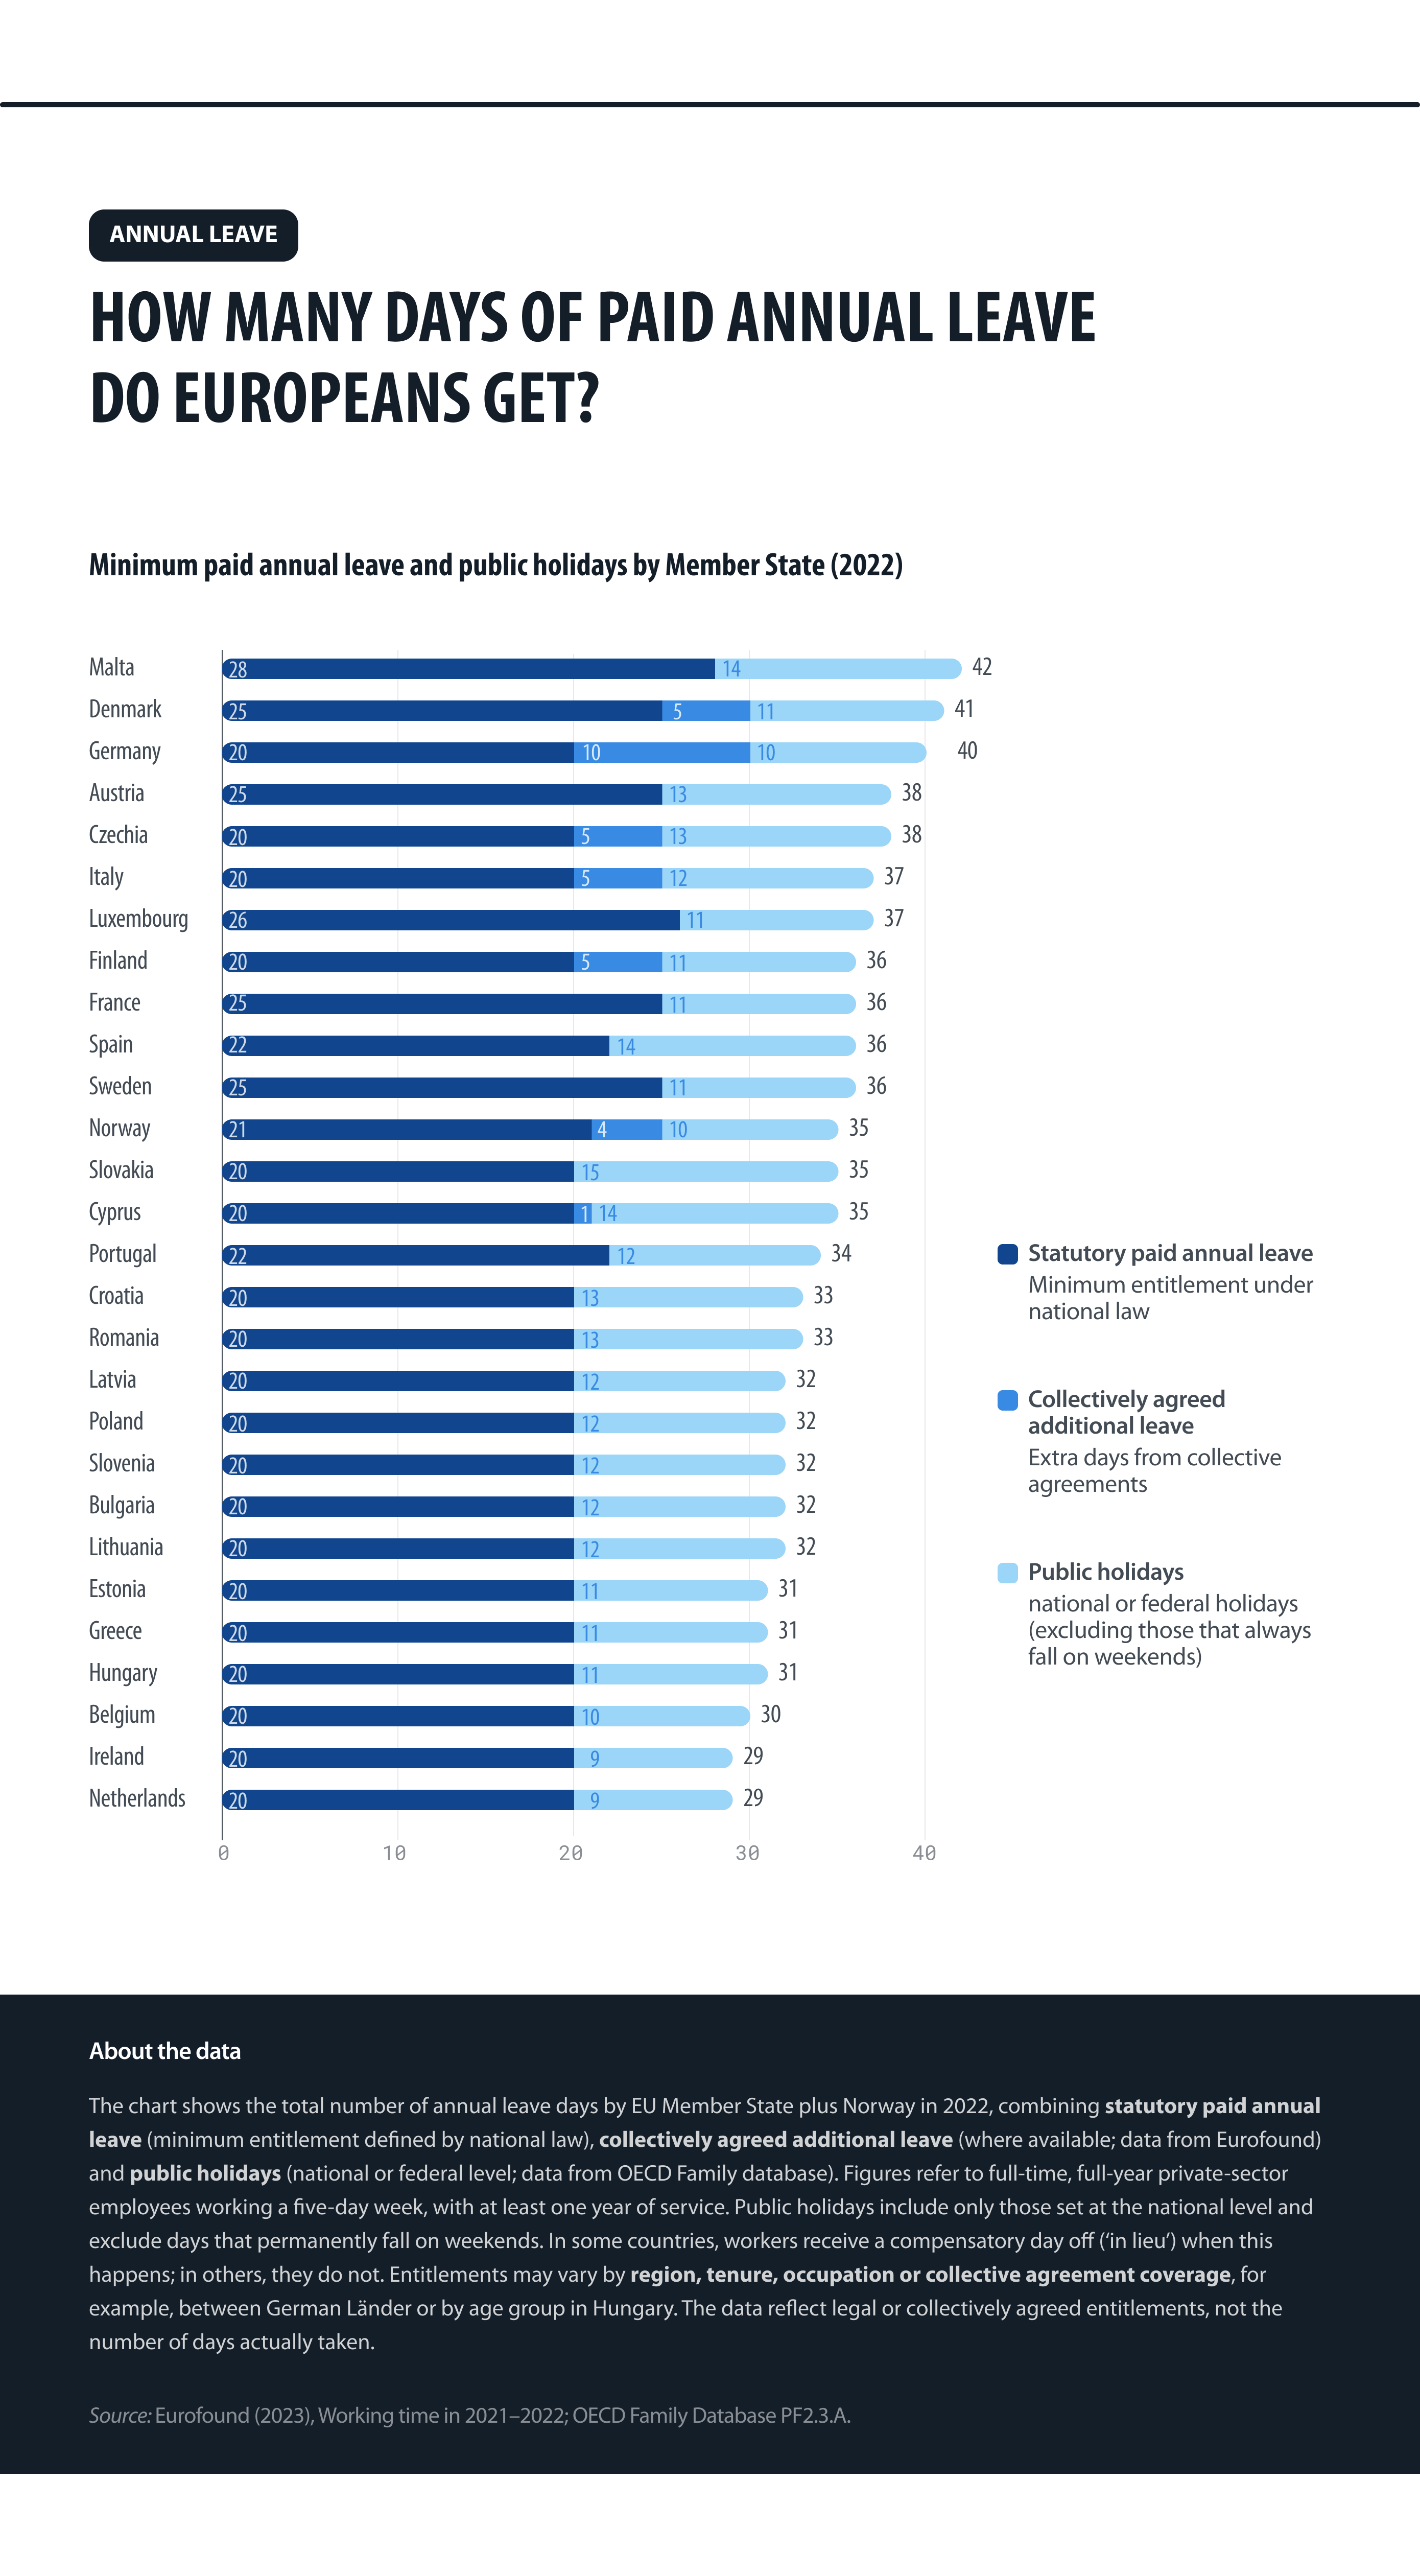
Figure 3: Baseline minimum of paid annual leave and public holidays by Member State and Norway (2022)
Source: OECD, Eurofound.
With regard to public holidays, while these add an important dimension to total time off, their figures should be interpreted with caution. In some years, several public holidays may fall on weekends, effectively reducing the number of days off. In some cases, Member States compensate with a replacement day (‘in lieu’); in others, they do not. Moreover, public holidays can vary by region or even by municipality. As a result, this indicator gives only a general overview. The actual number of days off enjoyed by workers can differ from year to year and across regions.
Conclusion:
The world of work across Europe reflects a complex mix of history, policy and social values. Open data makes these dynamics visible, showing how each Member State balances productivity, pay and rest. Manufacturing, healthcare and trade continue to employ the largest share of Europeans, while high-income sectors such as finance and technology remain smaller. Across the EU, differences in earnings often exceed those between professions and the time people take off (not counting public holidays) varies from the EU minimum of 20 days to 30 in some Member States. While some patterns recur, others diverge across Member States, reflecting diverse policy choices and economic contexts.
These contrasts reveal that there is no single ‘European’ model of working life. Yet they also underline shared goals: decent work, fair pay and the right to rest. By bringing these patterns to light, open data helps citizens, researchers and policymakers understand how the EU works and how it might work better.