Social Distancing in the Public Transportation Systems of European Cities and Alternative Options
In the new phase of the pandemic, the world is taking its first steps in loosening the restrictive measures, while trying to make sure that social distancing can always be achieved. This created difficulties for the public transportation systems, as they can get very crowded. Some guidelines are set up to support policymakers and citizens to adjust according to the new situation. Also, some alternatives to the use of cars and public transportation are provided, assisted by data-related initiatives.
The world is currently entering a new phase of the pandemic, where countries take their first steps in loosening the restrictive measures. A difficult but important task of safely reopening businesses and public spaces is maintaining the social distancing rules. Social distancing, sometimes referred to as physical distancing, requires people to keep e.g. 1.5-meter distance from others in order to reduce new infections. Guidelines are created in order to advise countries and policymakers to support citizens if necessary, see for example the guidelines from the European Centre for Disease Prevention and Control (ECDC).
Public transport is often the backbone of cities, providing an essential service to keep cities moving, also in times of this pandemic. However, the public transportation systems are a major bottleneck in ensuring social distance. Using public transportation forms a risk for infections due to the high number of people in a confined space with limited ventilation, the lack of control to identify potentially sick people, and the large variety of surfaces to touch. To visualise the intensity of public transportation in European cities, figure 1 was created. It shows the 20 cities and regions that transport the most metro and tram passengers annually, based on available data (with the notable exception of e.g. Paris) from the United Nations Economic Commission for Europe (UNECE).
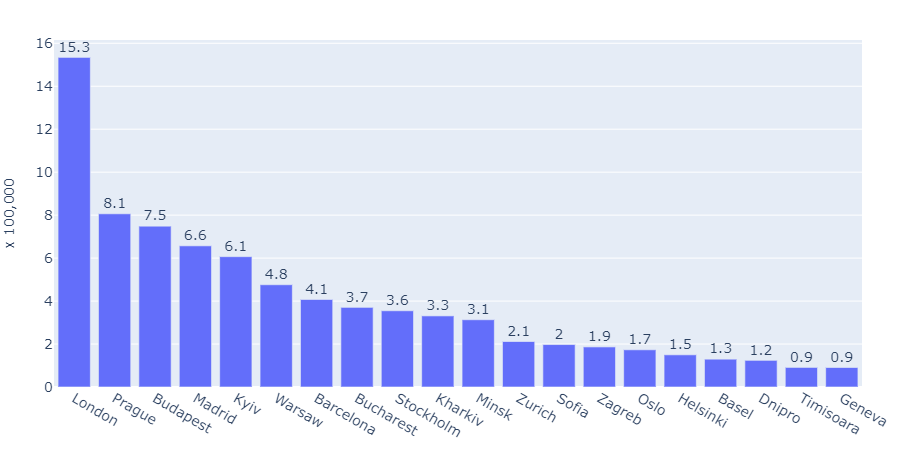
Figure 1: Top 20 cities based on annual metro and tram passengers, source: UNECE.
Furthermore, the intensity of the public transportation system can also be visualised using train passenger data. The European Data Portal created an interactive visualisation in which, for the available European countries, different numbers on passengers transported by rail in 2018 are shown. Figure 2 shows the number of kilometres travelled per inhabitant in 2018.
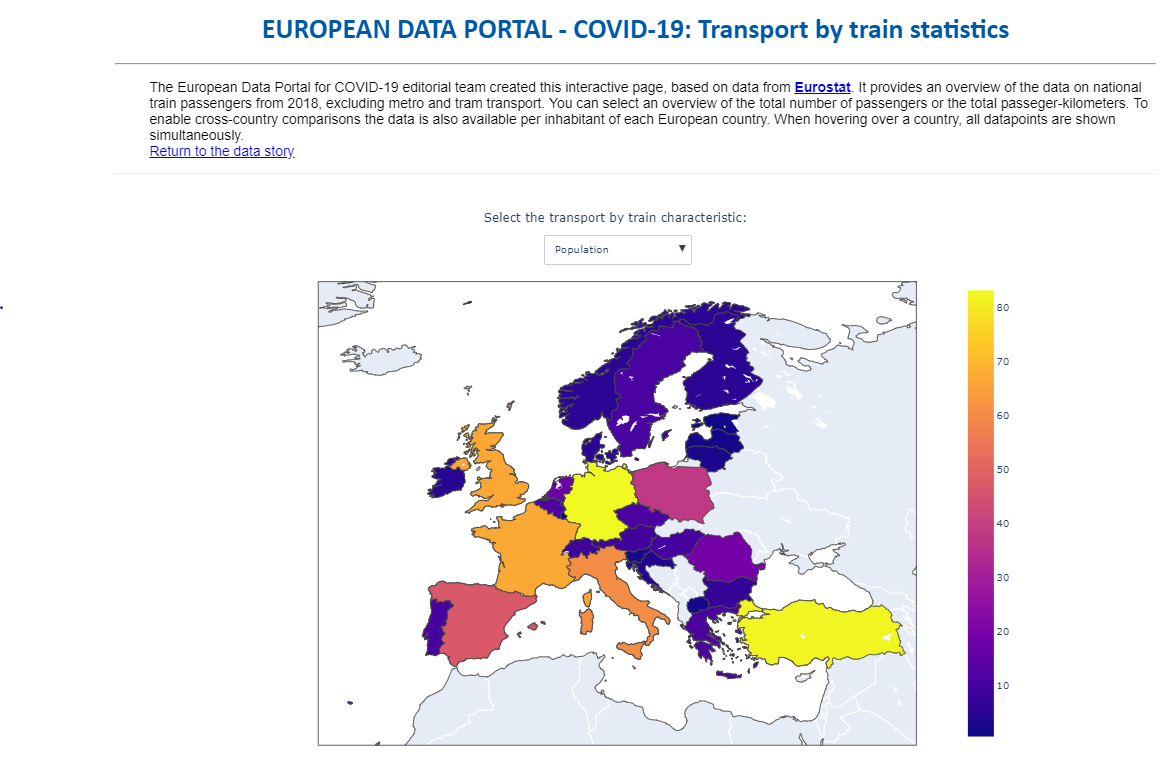
Figure 2: Interactive visualisation on passengers transported by rail in 2018, excluding tram and metro, source: Eurostat.
In order to keep public transport operating it is important to maintain a minimum service. However, countries were pushed to implement drastic restrictions in terms of travel possibilities. For example, every country urged their citizens to only travel when absolutely necessary in order to keep the country safe while ensuring that people with critical professions were still able to go to work. In some cities a decrease of public transport usage of more than 80% was observed as compared to pre-crisis levels. The European Commission created an overview on all implemented restrictions on transportation per country.
Guidelines
Some guidelines are created to support public transportation systems in safeguarding social distancing. The European Commission created a broadly applicable advice to take necessary actions at stations, ports, and airports, such as ensuring regular cleaning and disinfection of stations as well as ensuring distancing at luggage drop-offs, border control points, and during boarding/embarking. Moreover, travellers are advised to buy their tickets online as much as possible to avoid crowding at ticket machines and prepare for mandatory use of face masks while in transit.
More detailed guidelines are provided by the International Association of Public Transport (UITP), a worldwide network bringing together public transport stakeholders. In their guidelines, the UITP aims to assist public transport operators in tailoring business continuity plans responding to the specific challenges of the pandemic. They mainly recommend providing proper protection for people and staff, and to reduce contact as much as possible between all travellers and employees.
Alternatives for public transportation
Although these guidelines provide a great starting point for countries and public transportation systems to adjust to the current situation, it remains a difficult task to guarantee the physical distance at all times and keep infections at a minimum. People who are afraid of crowded public transport stations and vehicles might be inclined to take the car instead. However, an increase in the use of personal cars is likely to have a non-linear effect on traffic jams. If traffic would rise above the pre-crisis level, due to people potentially avoiding public transport, traffic jams are expected to increase exponentially. Several cities and institutions are already looking at alternatives to public transportation or excessive car use in times of pandemic:
Social Distancing Dashboard created by TU Delft
In the Netherlands, an initiative was set up to identify the walking possibilities in Amsterdam where social distancing can be secured. Scientists from the Delft University of Technology (TU Delft) in the Netherlands have, in collaboration with the Amsterdam Institute for Advanced Metropolitan Solutions (AMS Institute), created a Social Distancing Dashboard. The dashboard, shown in figure 3, offers city maps that show if the 1.5-meter social distance rule can be respected when walking in public space. This is detailed for both neighbourhood and street level. The aim of this dashboard is to raise awareness among people about the constraints in keeping a social distance in public spaces, and to contribute in the decision making for COVID-19 related interventions in urban planning. Currently, the dashboard only offers the city map of Amsterdam, but the university is working on similar city maps for Rotterdam, The Hague and Delft.
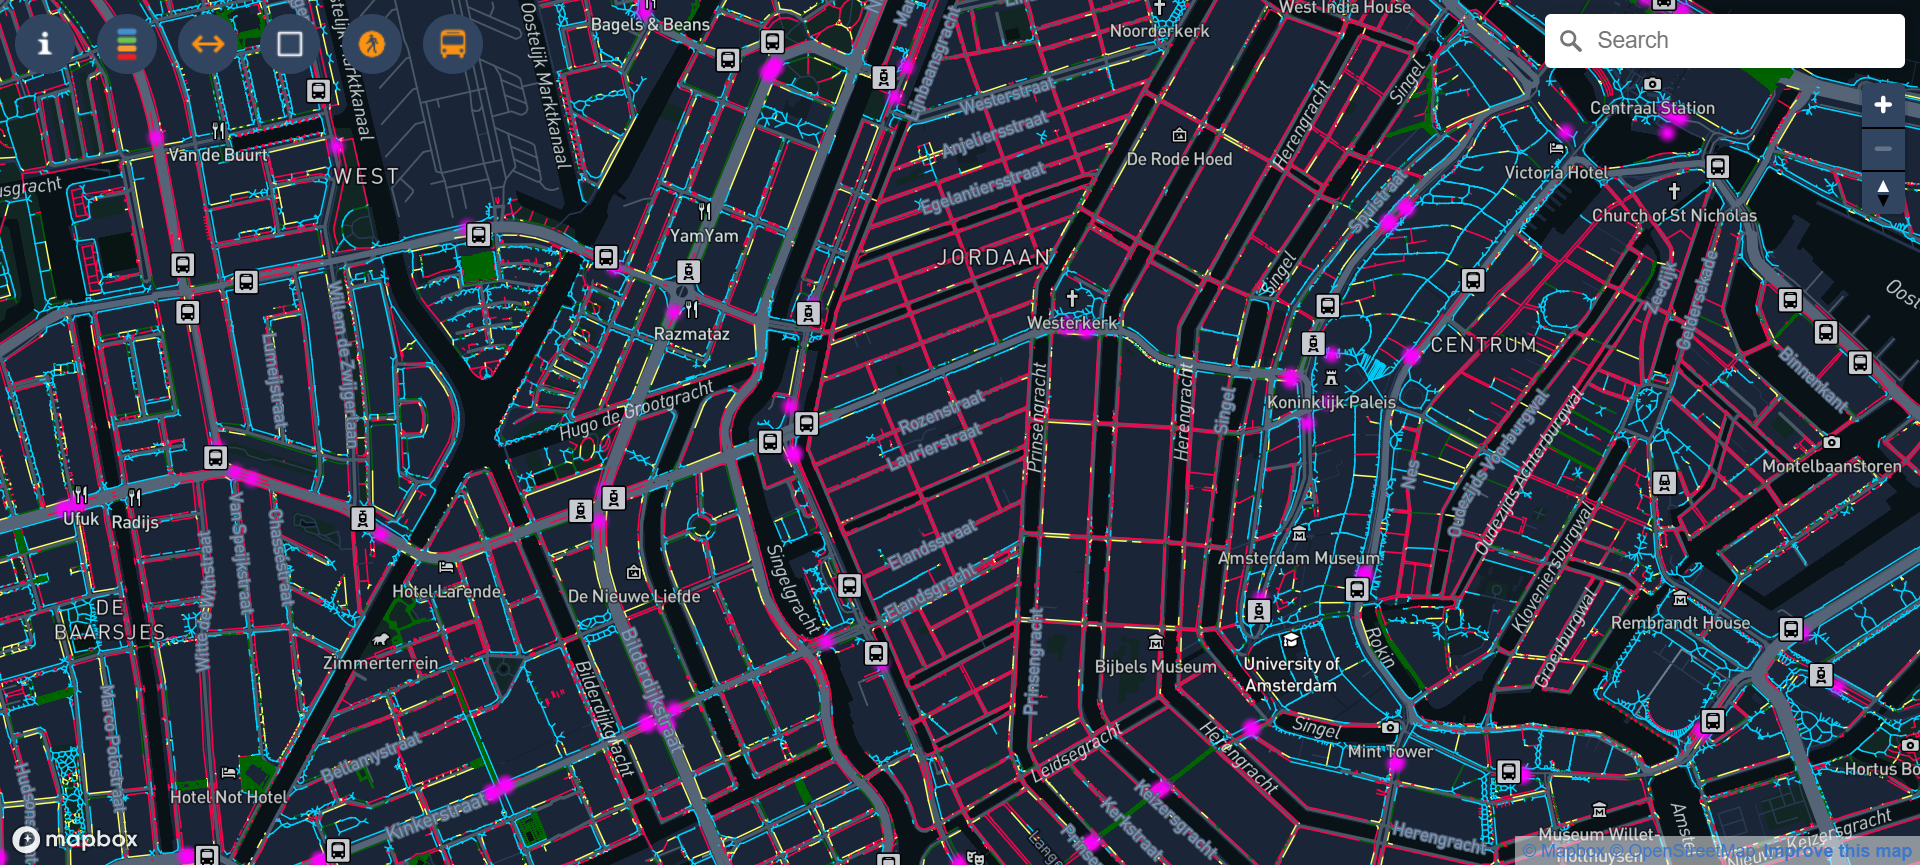
Figure 3: Screenshot of the Social Distancing Dashboard created by the TU Delft.
The dashboard has open access and is available for everyone. It is created using data from the Basisregistratie Grootschalige Topografie (BGT), the Centraal Bureau voor de Statistiek (CBS), and OpenStreetMap. The dashboard automatically estimates the width of footpaths and classifies them according to a risk profile. The underlying datasets are used to offer insights on multiple scales, ranging from postal code areas to regional levels. For more details on the dashboard see the article by TU Delft.
This initiative is only available for the Netherlands. However, this dashboard could serve as an example of how open data can be used by other countries and cities to provide insights in the likelihood of achieving social distancing in public spaces.
The Copenhagenize Index 2019 and Pedbikeinfo.org
Another alternative to public transportation is cycling. Several cities and countries have started to invest in their urban bicycle infrastructure or established temporary bicycle lanes, such as Barcelona, Berlin, Brussels, Budapest, Milan, and Paris. On pedbikeinfo.org, maintained by the Pedestrian and Bicycle Information Center within the University of North Carolina Highway Safety Research Center, a crowdsourced dataset tracks worldwide community actions to adapt the public space in response to COVID-19. The dataset can be used as a reference for policy makers or communities for examples from cities on ways to create safe spaces while promoting social distancing.
To get an overview of the most bicycle-friendly cities in the world the Copenhagenize Design Company created to Copenhagenize Index. Although this initiative started as an internal project, the widespread interest made them decide to yearly publish the top 20 most bicycle-friendly cities on their website, for 2019 the top 20 is shown in figure 4.
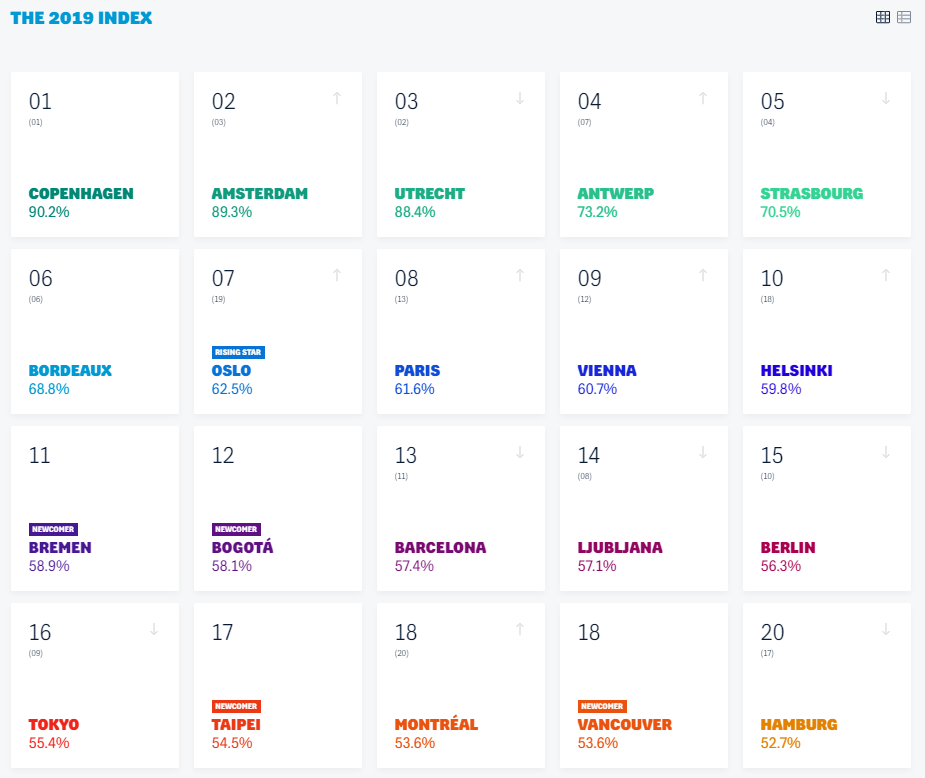
Figure 4: Screenshot of top 20 of Copenhagenize Index 2019.
The Copenhagenize Index is based on its own pointing system in which 14 parameters are used to give point for cities’ efforts towards re-establishing the bicycle as a feasible, accepted, and practical form of transport. The competition created by this initiative as well as the COVID-19 specific initiatives for pedestrians and cyclists could push cities in the right direction of improving their bicycle infrastructure to enable citizens to switch from cars and crowded public transportation to bicycles or walking.
Overall, it is likely that social distancing will be necessary for some time to come. In the new phase of the pandemic where restrictions are eased, public transportation is crucial to the functioning of cities. Countries are trying to properly adjust to this situation and are guided by experts, but public transportation is a bottleneck for ensuring social distance. Alternatives and initiatives are put forward to provide support and ease the pressure on public transportation and the possible increase in the use of cars, but it is likely that more adjustments are needed to completely ease the restrictions in the future.
Looking for more open data related news? Visit the EDP news archive and follow us on Twitter, Facebook or LinkedIn.