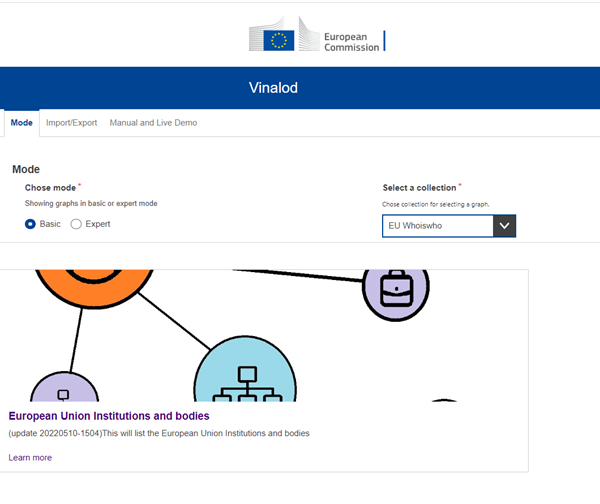
Vinalod – Visualisation and navigation of linked open data
Discover the tool to visualise and navigate linked open data without querying SPARQL
Open dissemination of public administration data is critical to ensure the transparency and accountability of policy actions and to empower citizens in democratic processes. While a large amount of European Union data is available in textual format, the Publications Office of the European Union has also made most of this structured data openly available through semantic web technologies and links in graphs, using linked open data (LOD). However, for end users (and even for experts) LOD is still difficult to navigate.
Why LOD is difficult to explore
The main obstacles for exploring LOD include the need to have the technical expertise for analysing RDF structured data, also by using RDF query language (SPARQL). But even for users who master these skills, without a good knowledge of the specific data model, or ontology used to describe the data assets, the exploration often proves difficult. As a result, users have little knowledge of the richness of EU data, because the existing web interfaces show very few links between collections and non-official data (e.g. Wikidata). This prevents the broader use of LOD.
To overcome this issue, the ‘Visualisation and navigation of linked open data’ (Vinalod) tool offers a user-friendly and intuitive exploration of visual data that allows the user to navigate directly within knowledge graphs and therefore enables them to see the links between collections.
Tool for visualisation and navigation of LOD
With the Vinalod tool, you can explore LOD without needing to be familiar with SPARQL syntax, data models or ontologies of different datasets. It allows you to explore this large amount of information and quickly get an idea of what is important and significant. You can also display the data in different ways and navigate between the elements of the graphs.

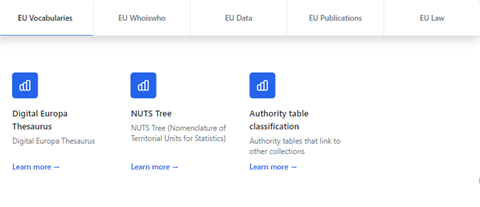
Vinalod covers the following data sources.
- EU Vocabularies. EU reference data can be explored via the Digital Europa Thesaurus, the NUTS (nomenclature of territorial units for statistics) classification and the Named Authority Lists controlled vocabularies.
- EU Whoiswho. The official directory of the EU can be explored via the parent institution, through the internal section, leading to the people working for each unit.
- EU Data. Datasets and data visualisations published on data.europa.eu – from national and EU open data catalogues – can be explored by provenance and theme.
- EU Publications. Publications of EU institutions can be explored by theme.
- EU Law. Explore EU treaties and their classification.

Exploring links between data
Vinalod then goes beyond exploring each individual data source to find links between them.
See how, for example, starting from the EU Whoiswho, we can explore the keywords used in publications by a given EU institution.

Vinalod provides a visualisation of the network of EU institutions to help you understand the structure of the European Union and to further explore its bodies. We can see how EU institutions are linked and nested into each other.

Another feature of the EU Whoiswho is that it links members of Parliament directly to their Wikipedia pages and retrieves extra information. From there we can explore the link between public sector data and that of a non-governmental organisation.

Exploring data on data.europa.eu
You can also use Vinalod to discover all the catalogues that publish their data on data.europa.eu.

See, for example, the datasets of the Luxembourg open data portal in the snapshot below.

The project was developed by a former EU Datathon participant in cooperation with many Publications Office units. The BETA version of the tool is currently available online at https://t-barrueco.github.io/vinalod/. In the future, it will be integrated into data.europa.eu as a new way of searching for information (in addition to manual search and SPARQL search).
If you’d like to know more about applications of linked open data by the EU institutions, check out our ‘Linking data’ series of data stories.
