Socio-demographic and labour characteristics of Ukrainians in Italy
Understanding the demographic, economic, and labour market characteristics of Ukrainians living in Italy
The Russian invasion of Ukraine forced a significant part of the Ukrainian population to flee their country. Most of the refugees sought immediate shelter in neighbouring countries, but in time many reached friends and families in other EU Member States, where communities of Ukrainian origin were already established.
Italy, for example, hosts one the largest Ukrainian communities in Europe, making it an interesting case study to understand the living conditions of this group. People born in Ukraine started to immigrate to Italy only relatively recently, after the dissolution of the Soviet Union, but are increasingly integrating into Italy’s socioeconomic structure.
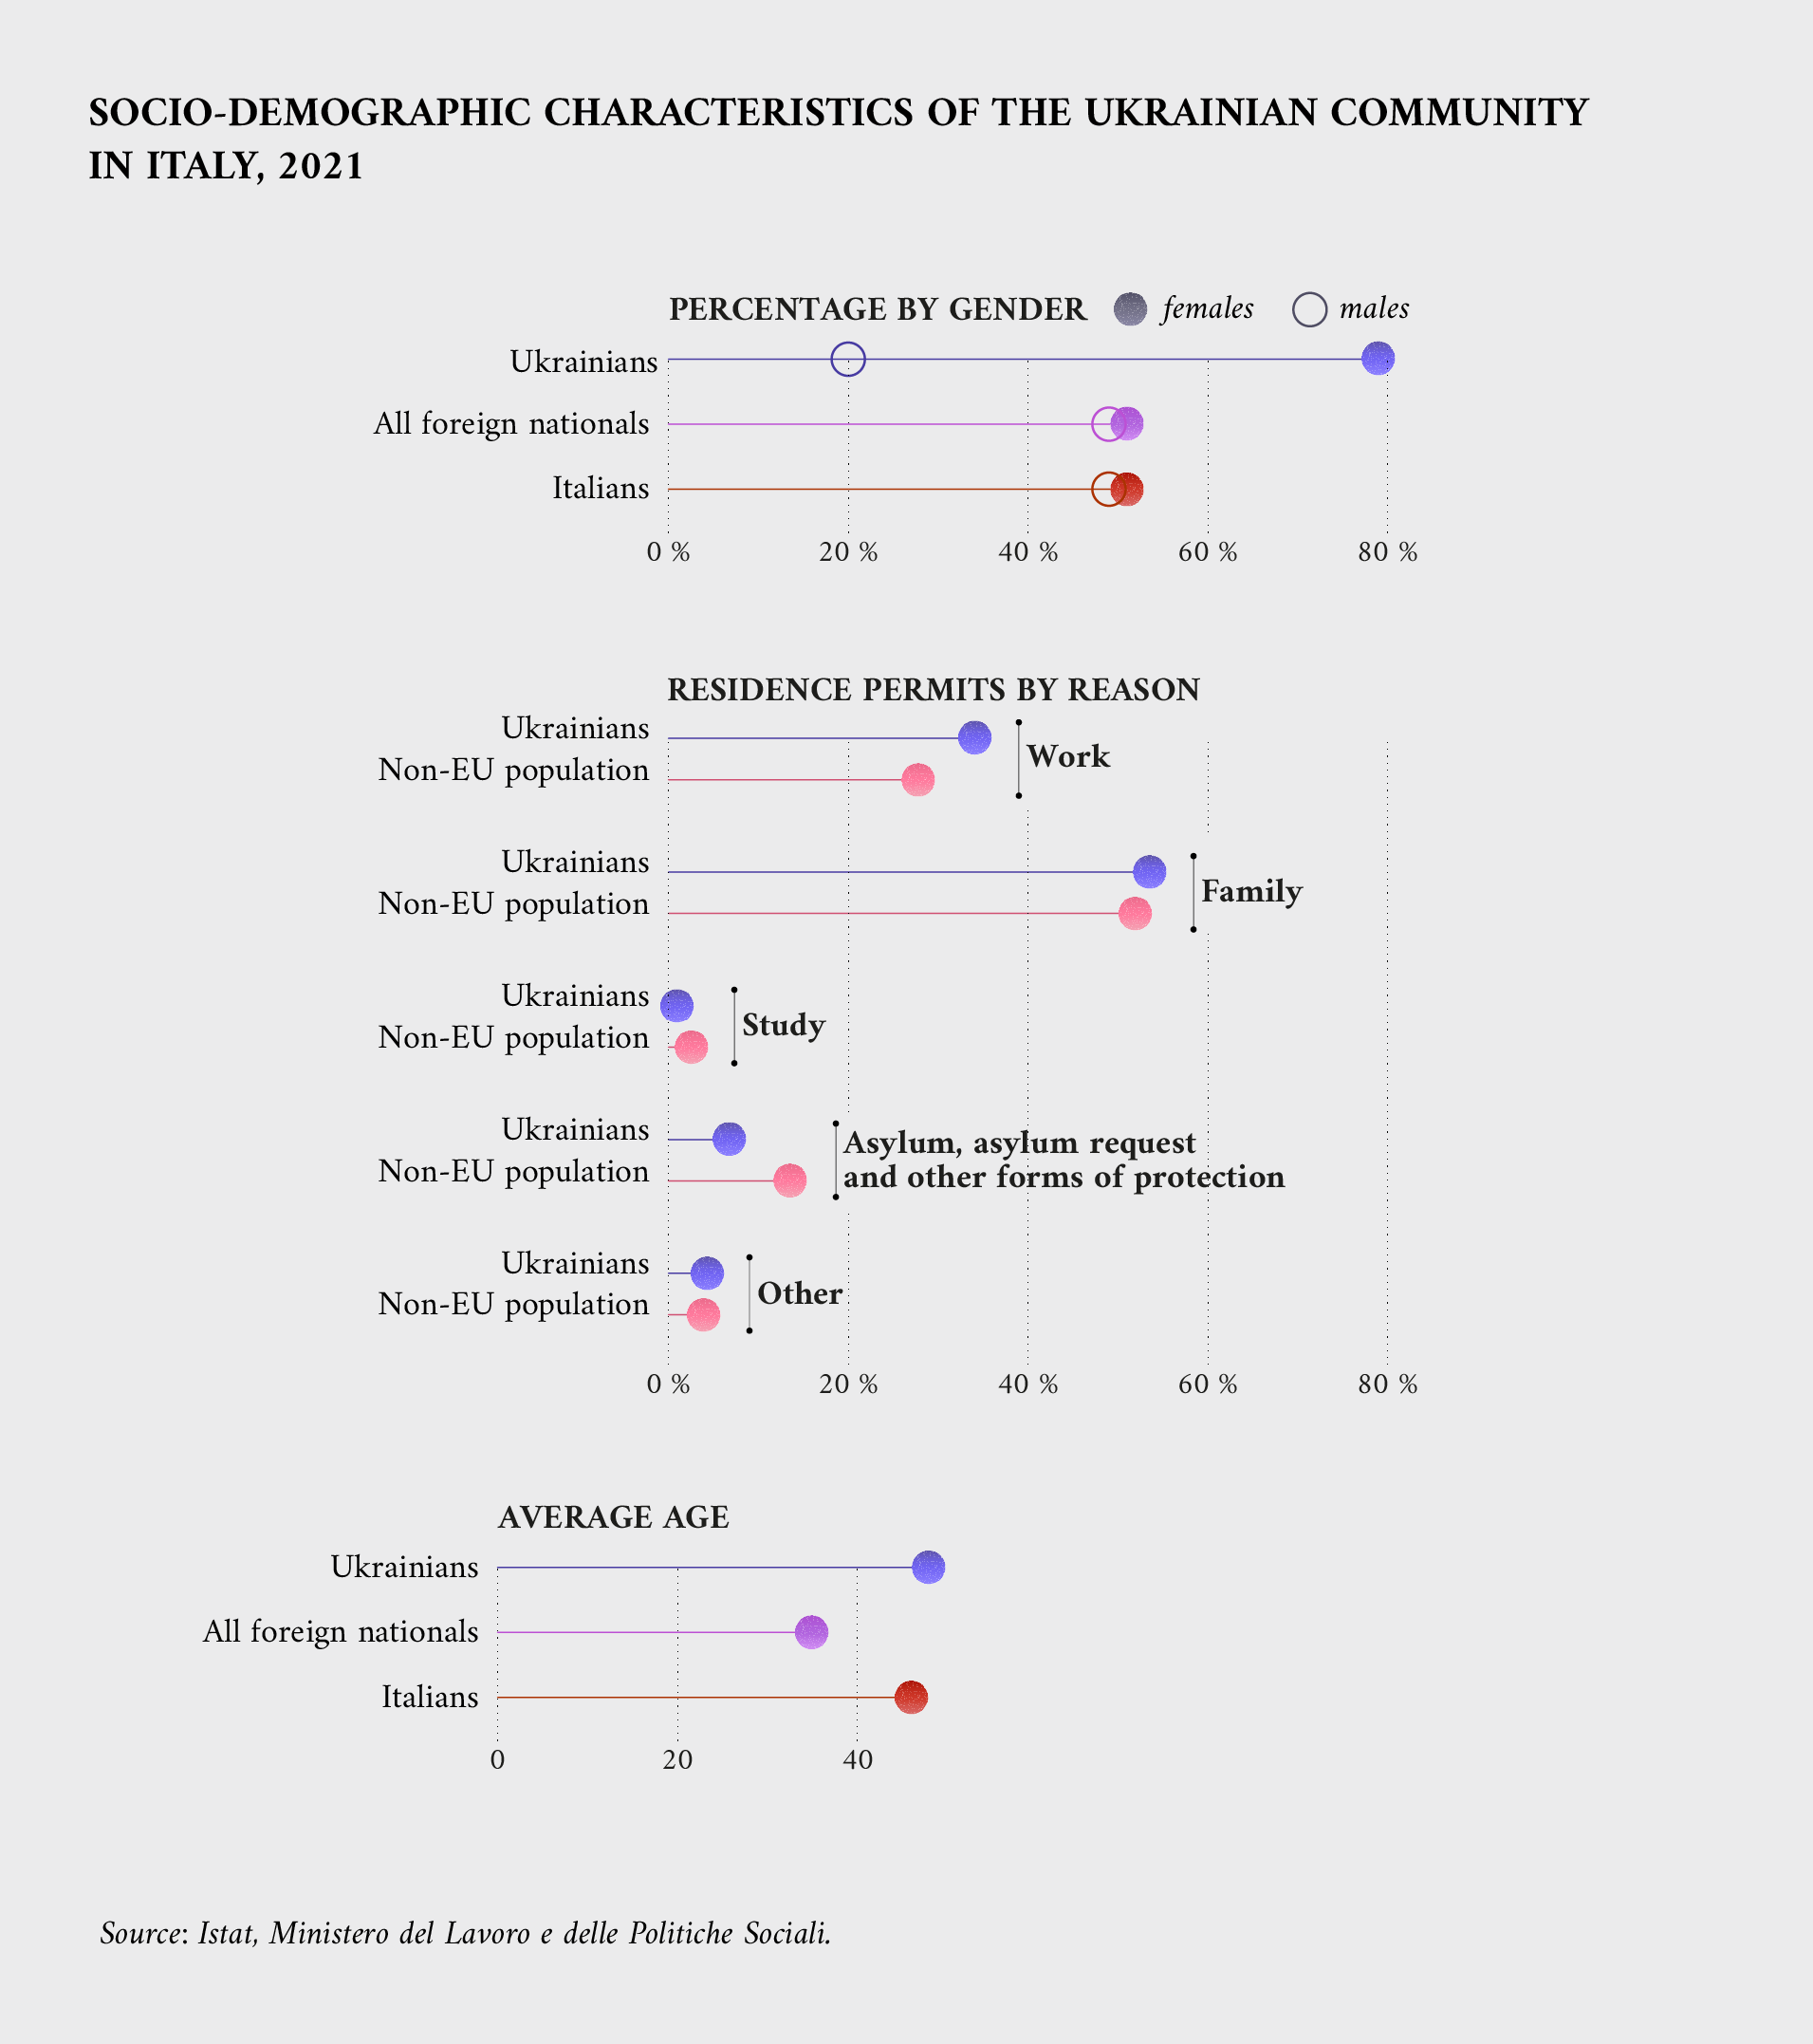
Reports from the Italian Labour Ministry can help us understand their life, from both a demographic and an economic point of view. One of the most important features of the Ukrainian presence in Italy is that it’s mostly composed of women. They make up 79 % of the total, the highest of all communities of foreign origin in the country.
This feature was mostly driven by economic factors. Driven by labour demand, Ukrainian men tended to go to Portugal, Russia and Spain. On the other hand, Greece and Italy needed more domestic workers and caregivers for the elderly, so they attracted a much larger share of women who, traditionally, are more often employed in this sector. As the reports stressed, this gender imbalance is slowly shrinking over the years.
Up until recently, residence permits for Ukrainians were obtained mostly for work or family reasons, and less frequently because of study or asylum requests, as compared to the general non-EU population. This changed drastically with the onset of the war and the Ukrainian beneficiaries of temporary protection grew as people fled the country.
Another important feature of Ukrainians in Italy is their age. Most of Italy’s migrant population tends to be young, but this is not the case for Ukrainians whose average age is actually slightly higher than that of Italians. 54 % of them are 30–59 years old, 28 % are 60 years old or more, while only 18 % are less than 30 years old – as compared to 38 % of the total non-EU population in Italy.
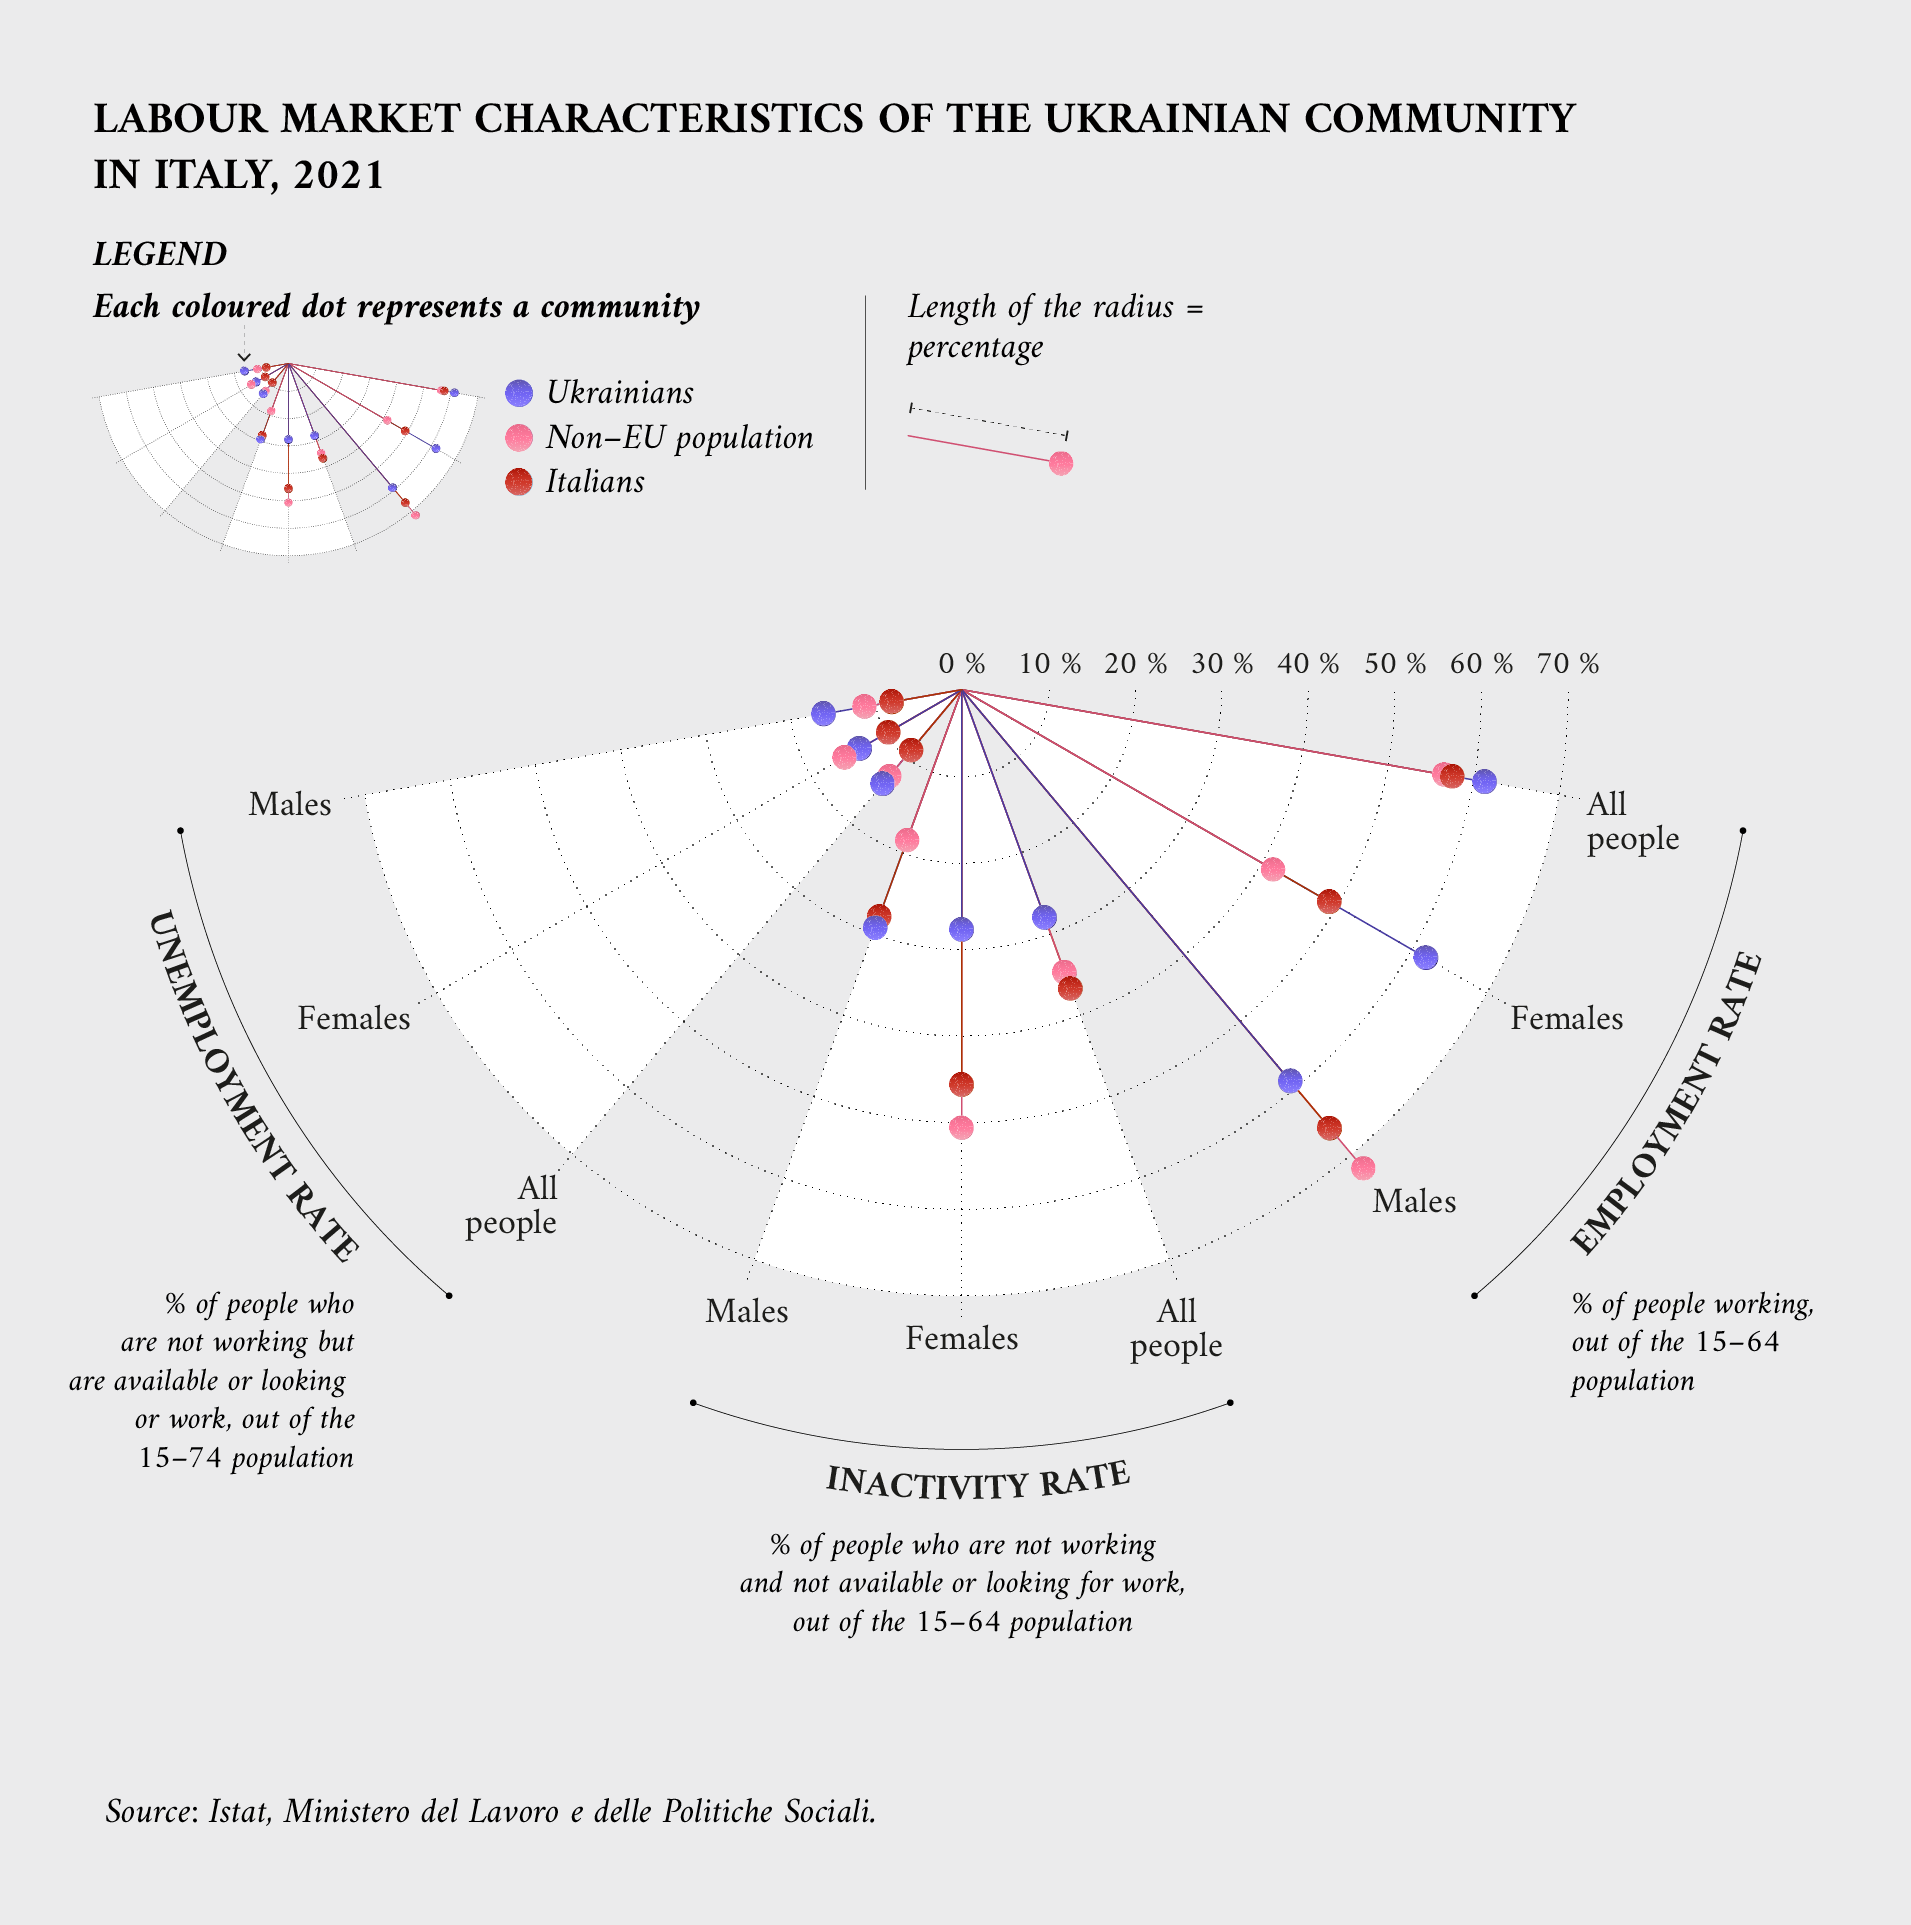
When it comes to the labour market, the most prevalent profile among Ukrainians is in the service sector. As a share of the total population, the employment level of Ukrainians is slightly higher than that of Italians and of the non-EU population. This is a trend exclusively driven by women. 61 % of them are employed, while the figure for Italians and non-EU people is, respectively, 58 and 57 %. The opposite is true for men, whose employment rate is significantly lower than that of the other two groups.
This difference is also evident in other indicators used to analyse the labour market, such as the inactivity rate (the share of people who are not working, not available to work or not looking for work) and the unemployment rate (the share of people who are not working but are available or looking for work).
As a result of the economic crisis resulting from the COVID-19 pandemic, in 2020 the employment rate for Ukrainians was 3.7 % lower than in the previous year, a result similar to the whole non-EU population, with a 4.6 % growth of the inactive. It means that during this time, not only did workers lose their jobs, but many dropped out of the labour force entirely.
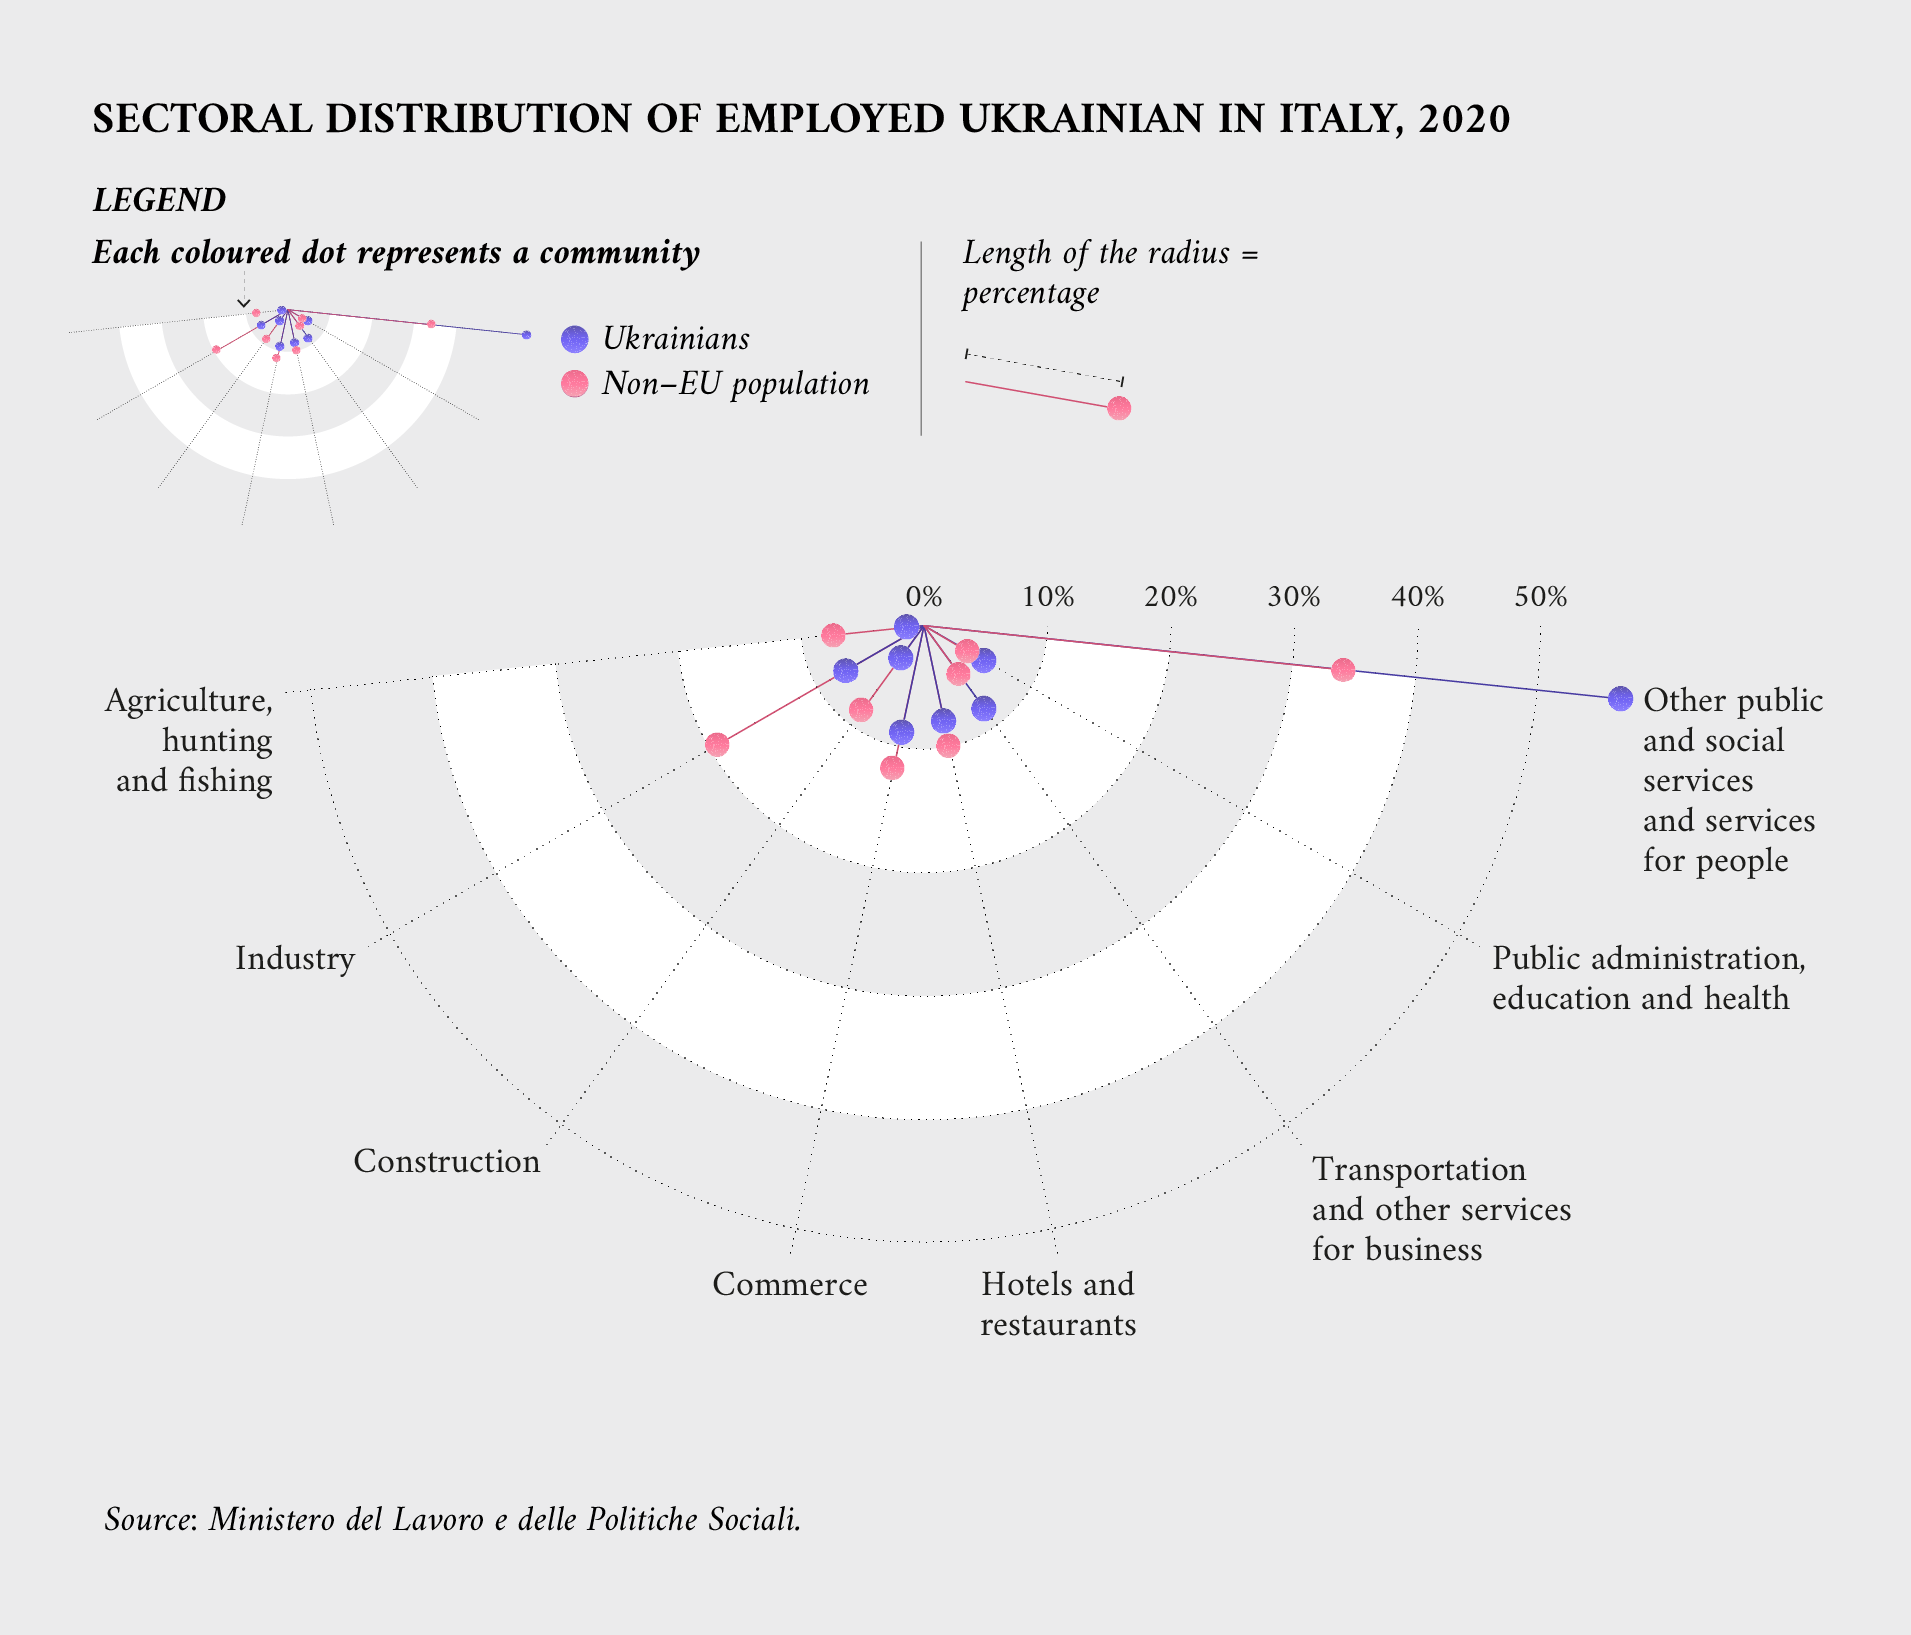
The prevalence of Ukrainians in the service sector can be fully appreciated when looking at the distribution of their sectors of employment. 58 % of them work in the service sector, as opposed to 34 % of the whole non-EU population in Italy. For women, the incidence is even higher – 67 % of them work in public or private services, which include jobs like housekeeper or caretaker for the elderly.
They tend to work very rarely in agriculture or generally in the primary sector, as they also do in industry and construction. However, their presence in transportation and other services for business is higher than that of the other two groups.
The Ukrainian community tends to also have a high educational attainment. 21.3 % of them have a tertiary degree and 42 % a secondary one, as compared to 11.4 % and 29 % respectively in the whole non-EU population.
While the domestic services sector is often a low-paying one, monthly earnings for Ukrainian workers are roughly EUR 50 more than other non-EU workers. Women employed in that sector tend to have a higher income than men – about EUR 100 more. Notwithstanding the disparity in income, this is not enough to compensate for the gender pay gap of all employees, and men still earn on average roughly EUR 400 more than women.
To access the data used in this story, you can download it here.
Article by Davide Mancino
Data visualisations by Federica Fragapane