Living with disability in Europe: what open data shows
Economic security, digital accessibility and belonging across the EU
What does it take to take part in everyday life if you live with a disability?
In the EU, nearly one out of four people aged 16 and older report long-term limitations in daily activities. Yet barriers in schools, workplaces, public spaces and online services can make participation harder. Using open data, this story looks at three dimensions of inclusion – economic security, digital accessibility and social belonging – and how they differ across Member States.
How do people with disabilities experience economic security across Europe?
Living with a disability often involves additional costs and financial challenges, from medical expenses to barriers in accessing employment. Across Europe, governments seek to address these realities through disability-related social protection such as income support or services that help people live independently. But how far do these measures translate into economic security in everyday life?
Figure 1a compares the risk of poverty among people with disabilities with public spending on disability-related social protection across EU Member States. In several Member States, poverty risk among people with disabilities remains high. Rates exceed 35 % in Estonia, Croatia and Lithuania, meaning that more than one in three people with disabilities are at risk of poverty. By contrast, Czechia, the Netherlands and Slovakia report rates below 15 %, indicating lower levels of economic vulnerability among people with disabilities.
Public spending on disability-related social protection also varies widely. In 2023, Denmark allocates the largest share of GDP (around 5 %) to disability-related benefits, while several Member States on the other end dedicate less than 1 %.
In some cases, higher investment in disability-related benefits coincides with lower poverty rates among people with disabilities. Interestingly, this relationship is not universal: Czechia and Slovakia record some of the lowest poverty rates among people with disabilities despite spending below the EU average, suggesting that poverty outcomes are shaped by a wider mix of factors, including how effectively people with disabilities are included in the labour market.
Employment plays a central role in this picture. For many people with disabilities, access to employment remains a major challenge. Figure 1b compares employment rates for people with disabilities with the overall employment rate across EU Member States. The graph reveals a clear gap pointing to structural challenges like inaccessible workplaces or limited access to education and training. The gap is highest in Romania (44.8 percentage points), Croatia (41 percentage points), and Lithuania (39.9 percentage points) and lowest in Luxembourg (8.5 percentage points) and Slovenia (14.2 percentage points).
Taken together, the data shows that while disability-related social protection can play an important role in reducing economic hardship, it does not guarantee economic inclusion on its own. Member States with similar spending levels can experience very different poverty outcomes, and large employment gaps persist across much of the EU. Sustainable economic inclusion depends on a combination of adequate financial support, accessible labour markets and opportunities that enable people with disabilities to participate fully in working life.
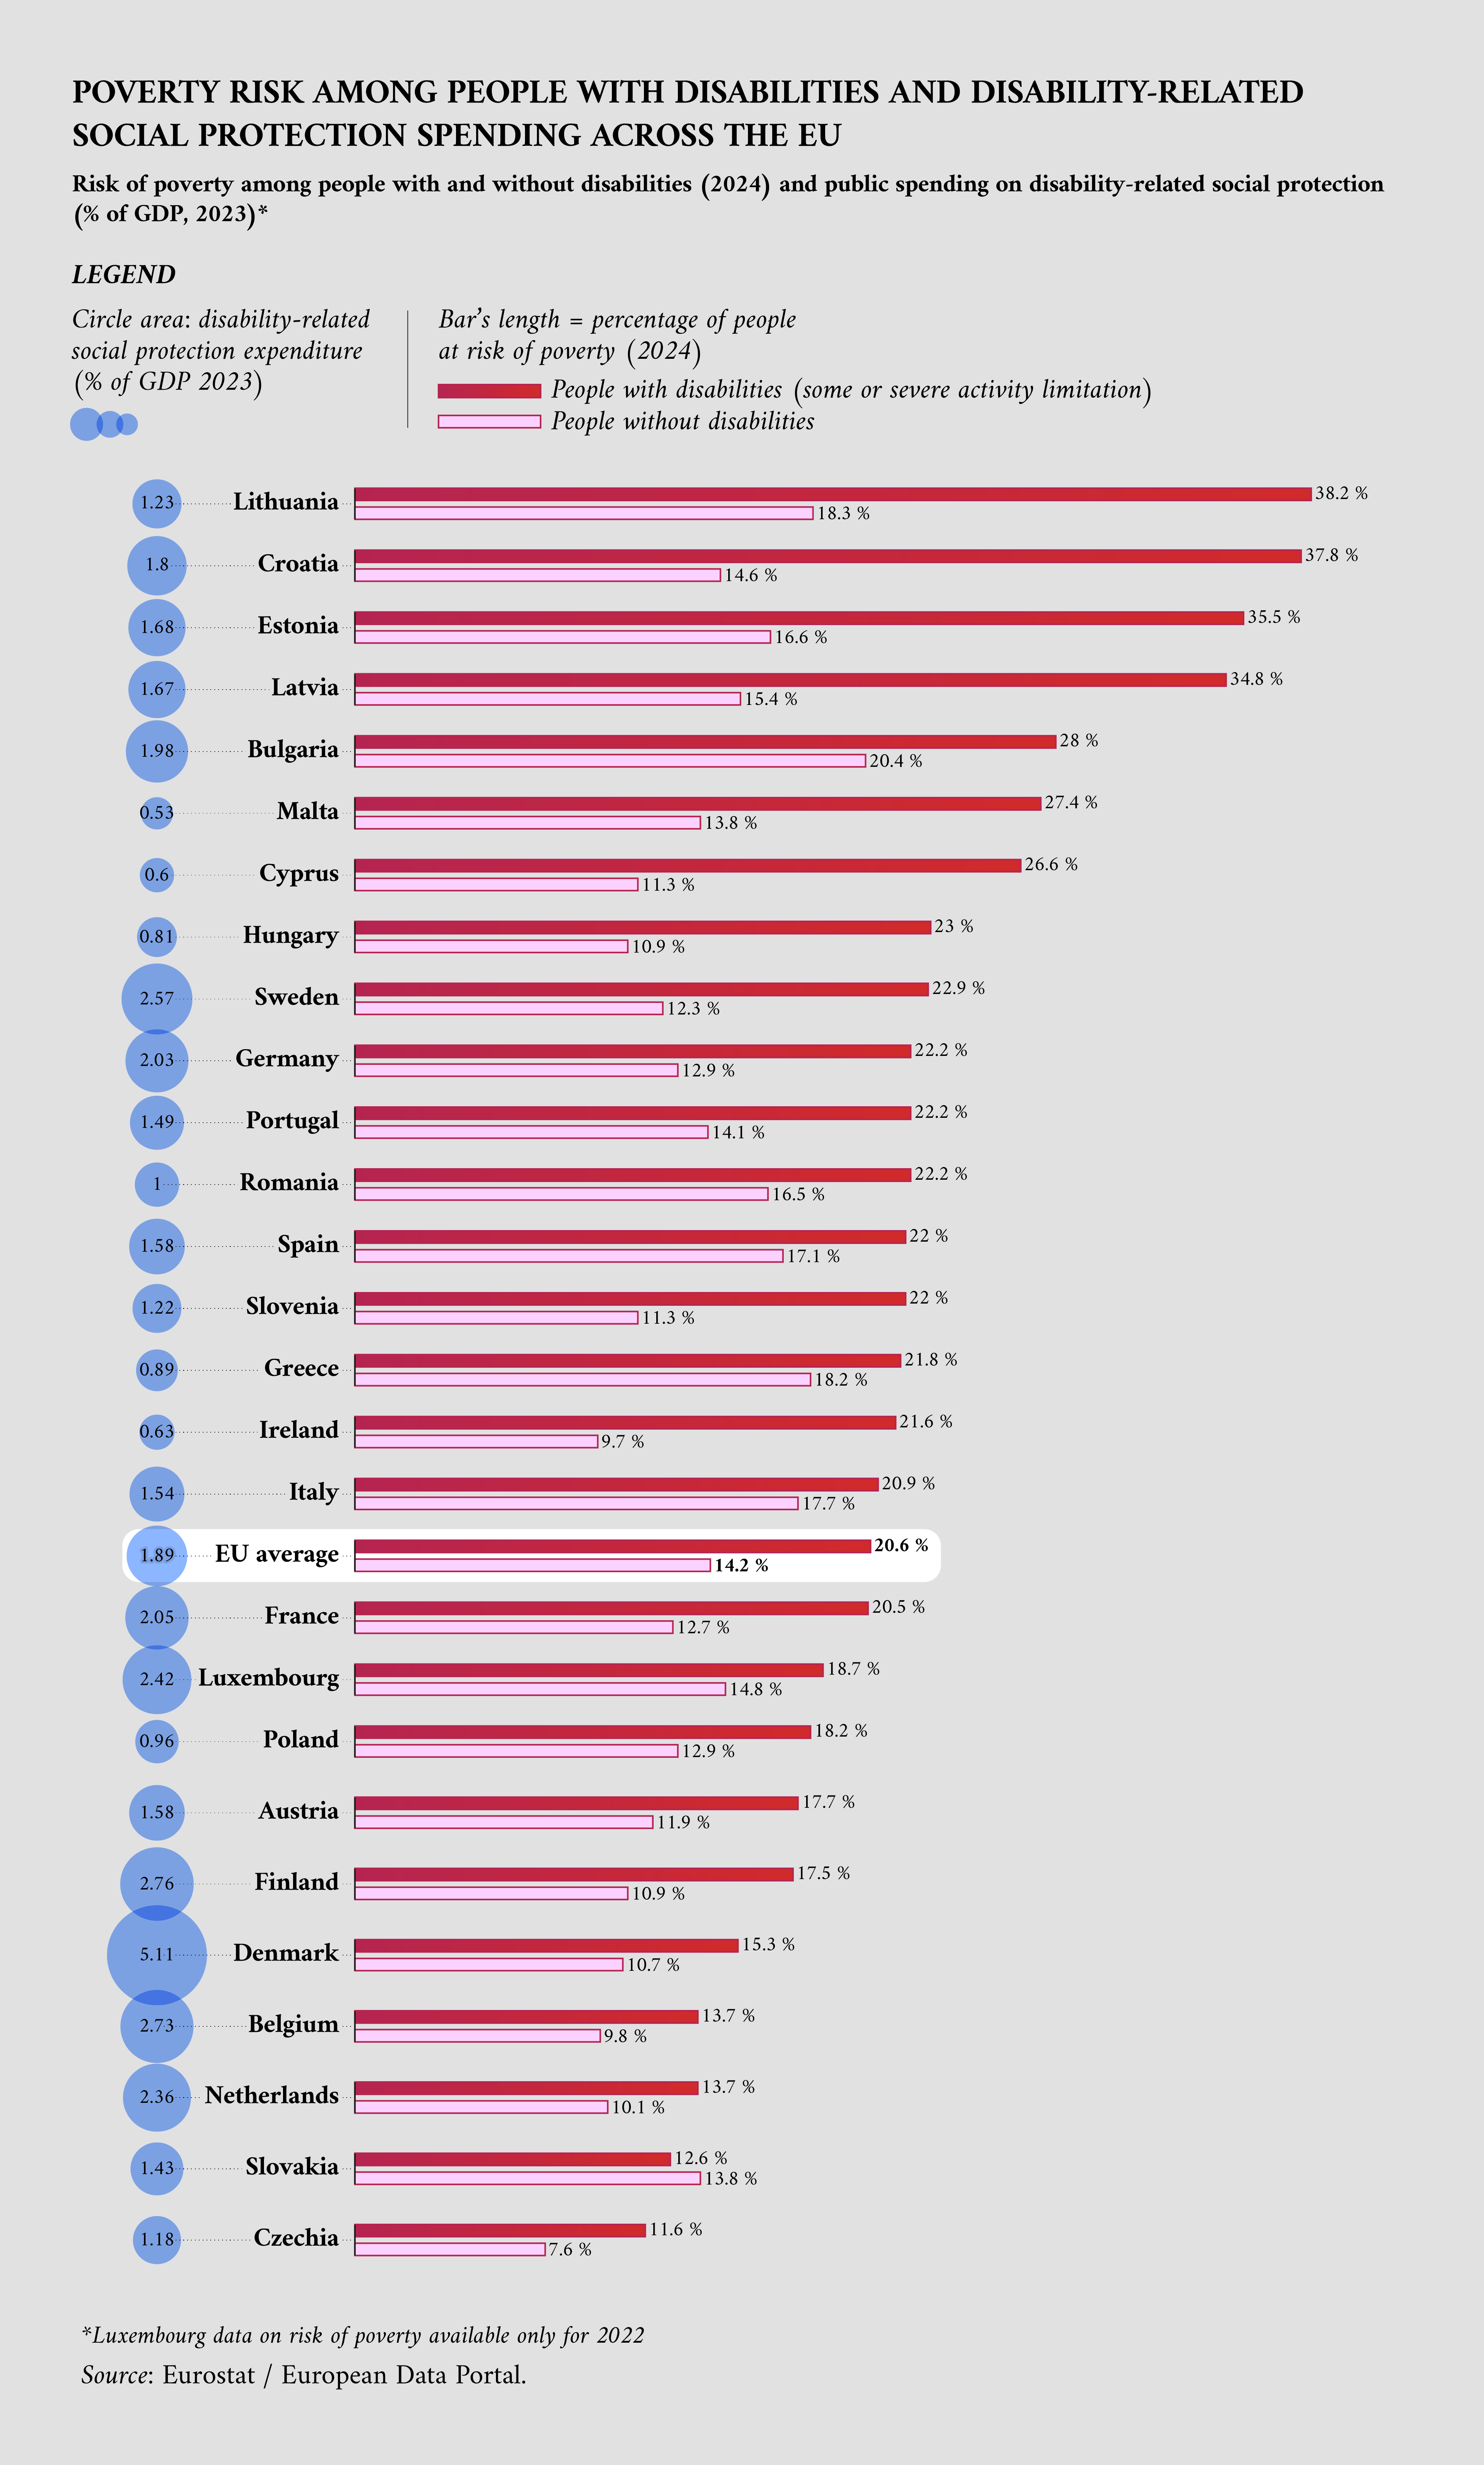
Figure 1a: Poverty risk among people with disabilities and social protection spending in the EU
Sources:
– Risk of poverty: Eurostat / European Data Portal
– Social protection expenditure: Eurostat / European Data Portal.
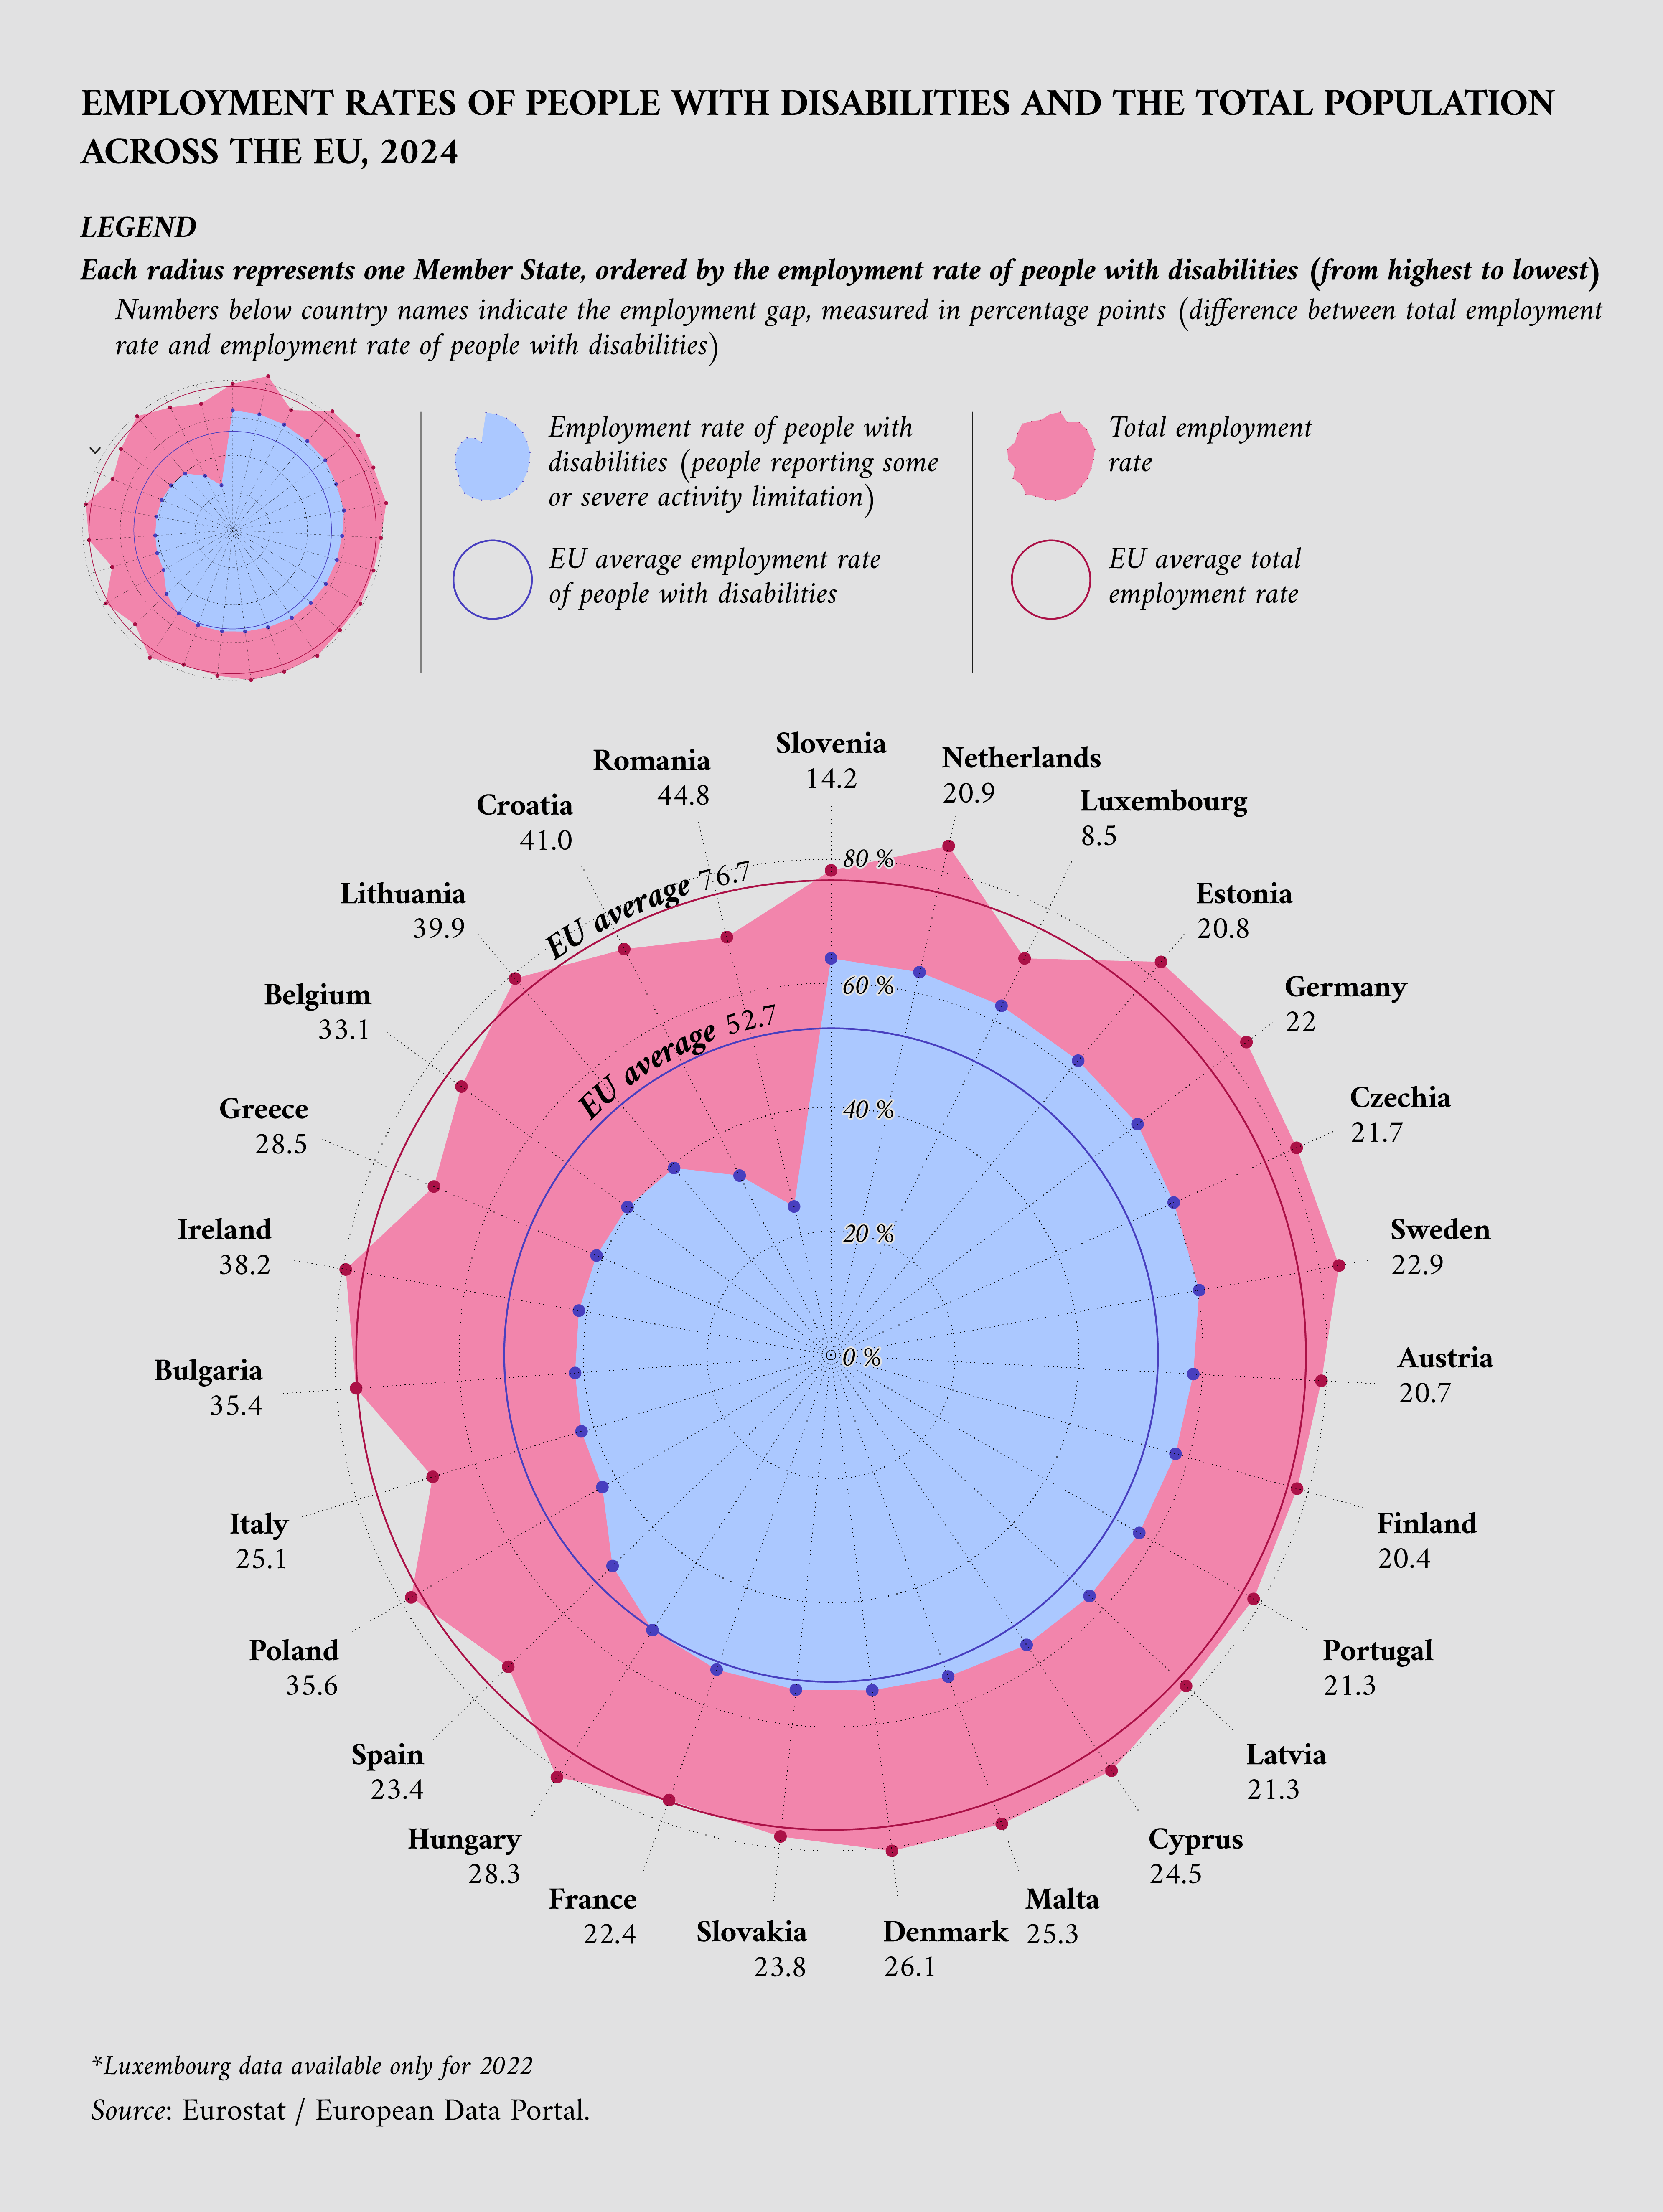
Figure 1b: Employment rate of people with disabilities and total employment rate across the EU
Sources:
– Disability employment gap: Eurostat / European Data Portal
– Overall employment rate: Eurostat / European Data Portal.
How accessible are Europe’s digital public services for people with disabilities?
Economic security alone does not guarantee inclusion if people cannot access essential public services independently. From managing employment benefits to booking medical appointments or completing legal procedures, everyday interactions with public authorities increasingly take place online. When digital services are not designed with different abilities in mind, they can create new barriers, even when these services formally exist.
These differences are captured by the European Commission’s eGovernment Benchmark 2025, which assesses how accessible selected digital public services are for people with disabilities. Figure 2 ranks Member States by their overall accessibility score. It also displays accessibility scores for three selected groups of public services – career, health and justice – representing common life events such as applying for employment-related services, accessing health information and interacting with legal systems. The indicators assess whether these services meet accessibility criteria, including clear structure, sufficient colour contrast and compatibility with assistive technologies such as screen readers.
At the EU level, accessibility varies across the three service categories. On average, justice-related and career-related services score highest (both around 51 out of 100), while health-related digital services lag behind (38).
Large differences also emerge between Member States in the overall accessibility score. Some have invested heavily in making their digital public services accessible. Sweden scores highest overall (94) followed by Denmark (76), while countries such as Croatia (10) and Romania (11) record much lower scores, indicating substantial accessibility gaps.
At the same time, digital accessibility alone does not guarantee that everyone can use public services in practice. Some people – including individuals with severe disabilities or older people – may not be able to use digital services at all, regardless of how accessible a website is. When public administrations rely primarily on digital channels and reduce alternatives such as telephone support, written correspondence or in-person services, certain groups risk being excluded despite high digital accessibility scores.
Overall, the data highlights uneven progress in embedding accessibility standards in digital public services across the EU. As public services continue to move online, ensuring both accessible digital design and meaningful non-digital alternatives remains essential for making public services truly usable by everyone.
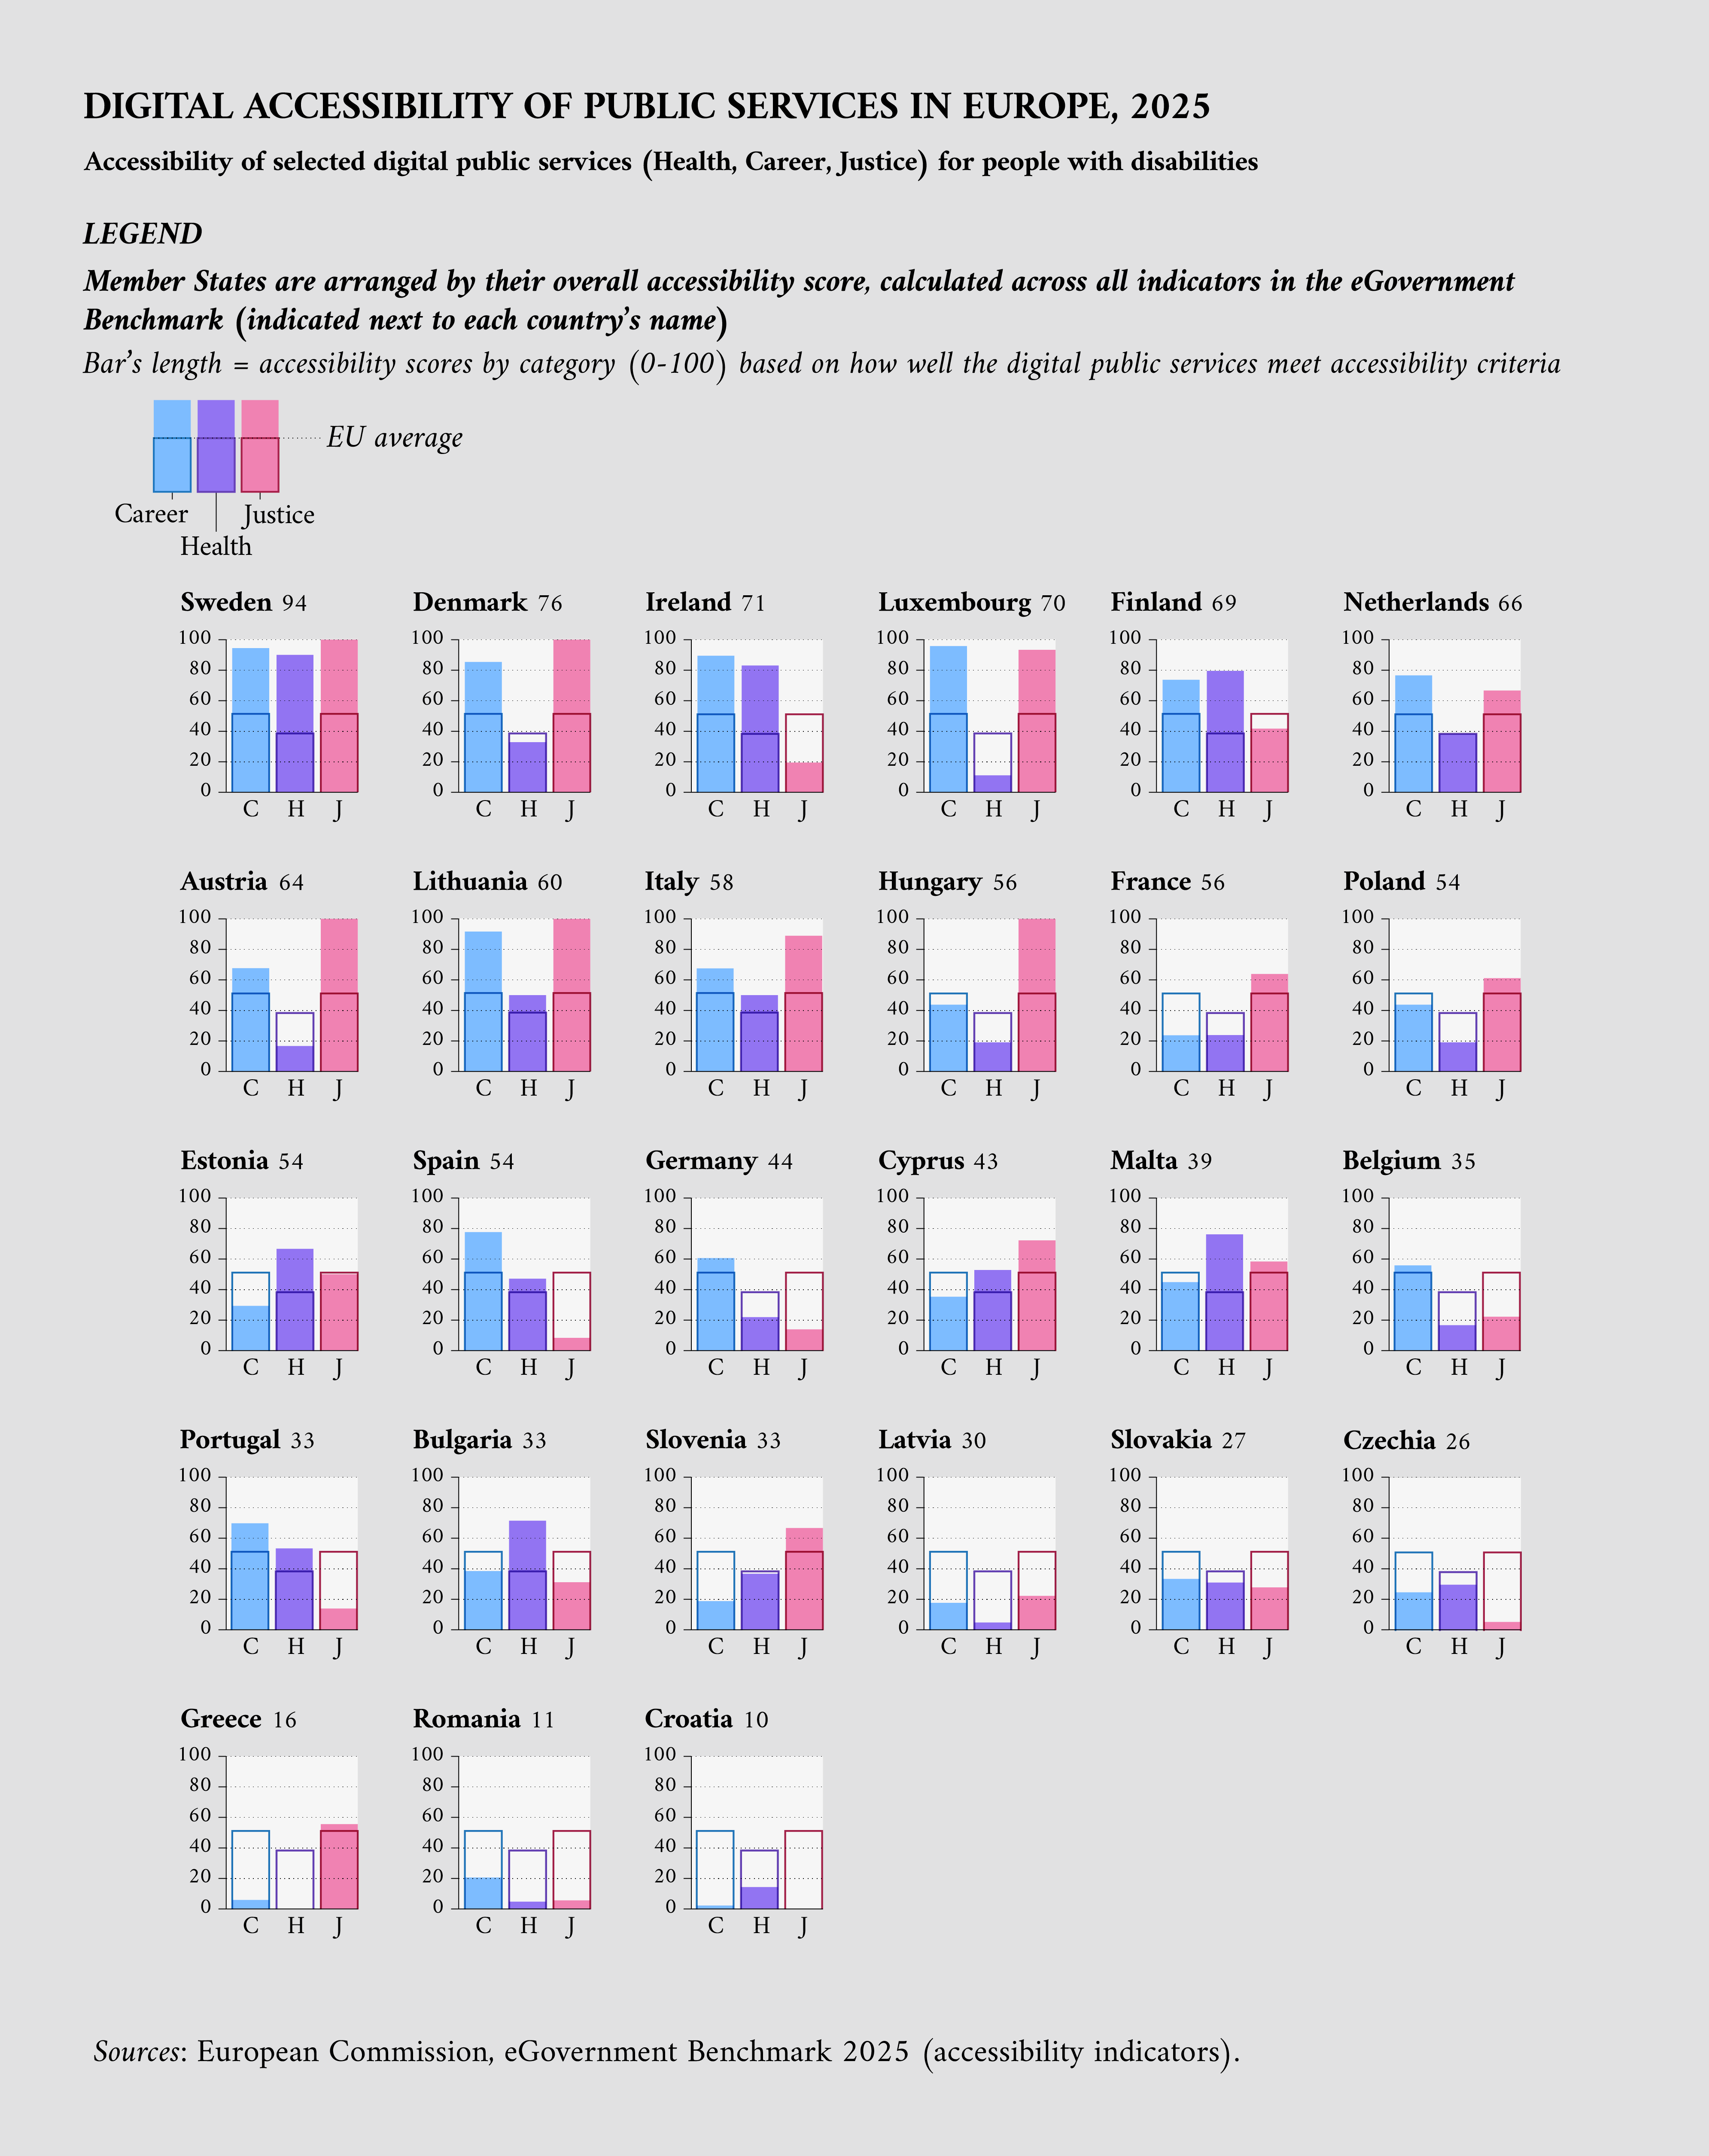
Figure 2: Digital accessibility of public services for people with disabilities in the EU
Source: European Commission, eGovernment Benchmark 2025 (accessibility indicators).
Do people with disabilities feel included in European society?
Inclusion is not only about access to services or financial security; it is also about how people experience their place in society. Feeling connected, recognised and valued plays a central role in quality of life.
Figure 3 shows how often people with disabilities report feeling left out of society, comparing people with some and severe activity limitations across EU Member States. The data reveal a clear, and perhaps expected, pattern: people with severe disabilities are consistently more likely to feel left out than those with milder limitations.
While this gap is present in every Member State, its size varies considerably. In some Member States, such as Poland and Portugal, reported levels of feeling left out remain relatively low even among people with severe disabilities. At the other end of the spectrum, the share of people feeling left out can reach levels as high as 40 % in certain cases. These differences underline that social inclusion is not experienced uniformly across Europe.
Interestingly, Member States with comparatively strong welfare systems also appear among those with higher levels of reported social exclusion among people with severe disabilities. This suggests that perceived inclusion is shaped by more than economic support alone. Everyday social experiences, the availability of informal support such as family or carers, and how inclusion is experienced in daily life may all influence whether people feel connected or isolated.
It is also important to note that this indicator is based on self-reported perceptions. Differences between Member States can therefore reflect not only lived experiences but also how people interpret the question and express feelings of exclusion. Nonetheless, the data highlights a consistent message: reducing barriers is essential, but true inclusion also depends on whether people feel they belong in society.
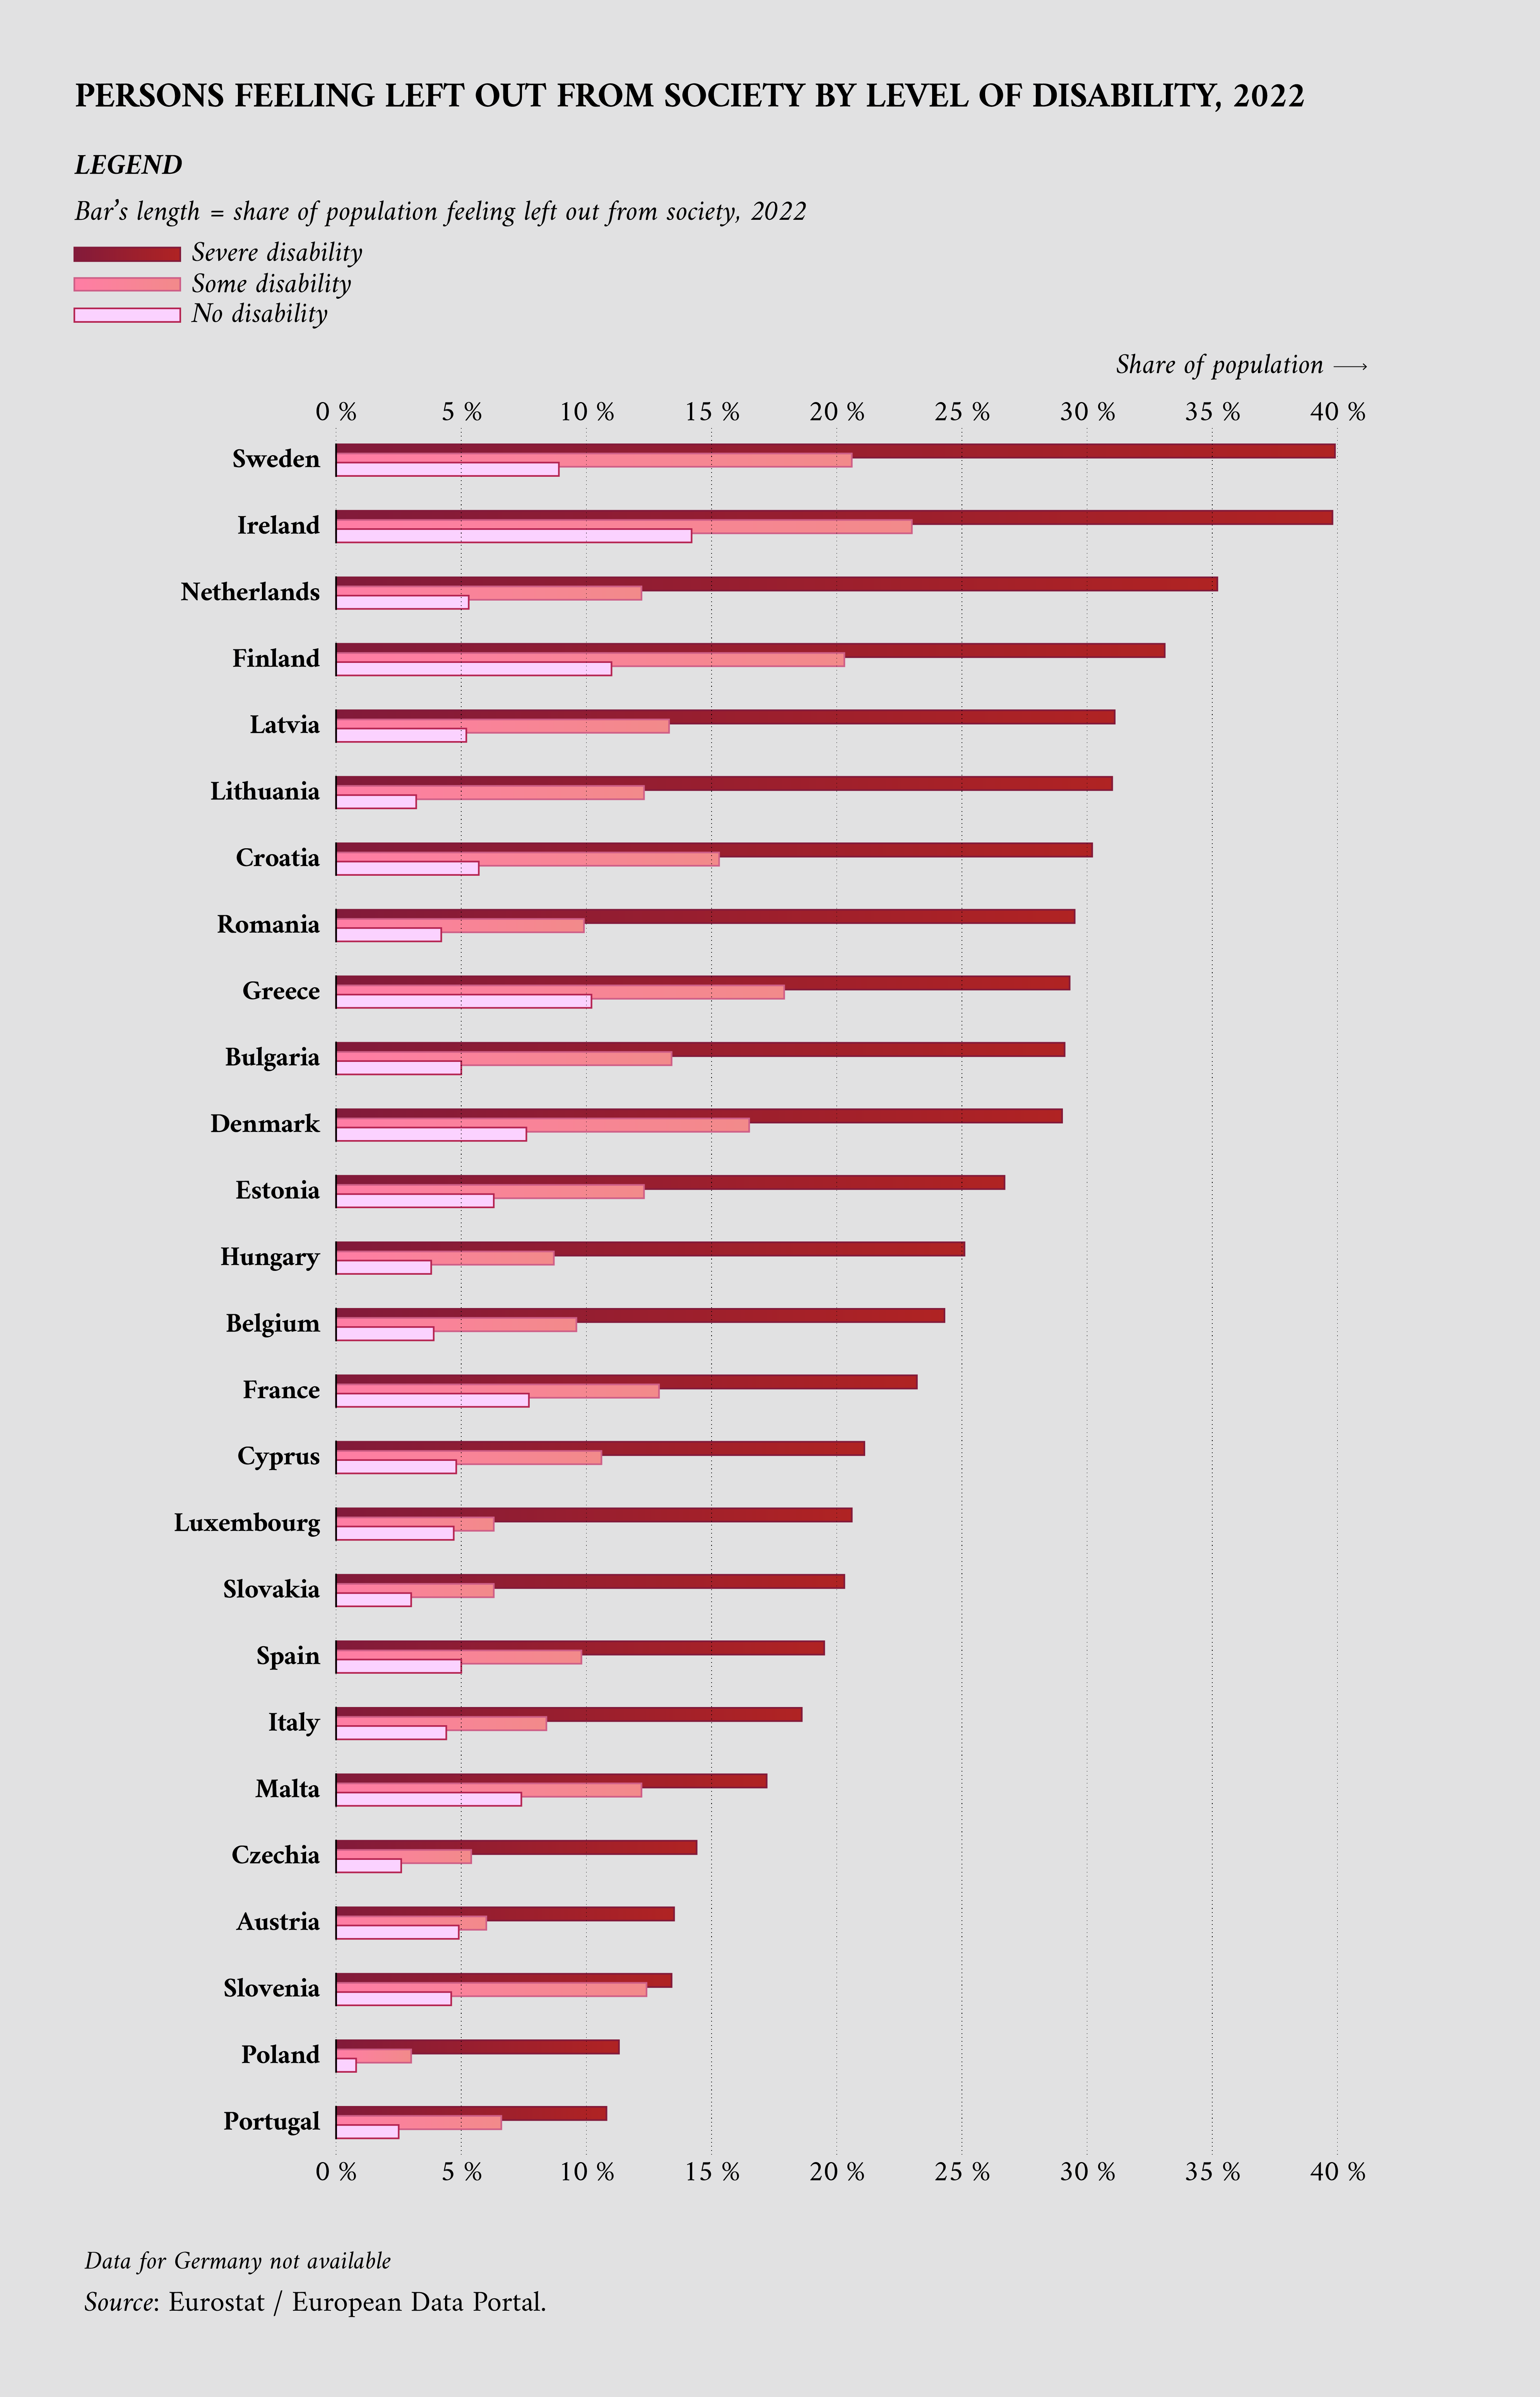
Figure 3: Levels of feeling left out of society among people with disabilities in the EU
Source: Eurostat / European Data Portal.
Conclusion
Taken together, the data paints a nuanced picture of disability inclusion in Europe. People with disabilities are more exposed to poverty and less likely to be employed, but higher public spending does not always translate into better outcomes. As more public services move online, a focus on digital accessibility can either reduce barriers or reinforce them. At the same time, people with severe disabilities are consistently more likely to feel left out of society, though experiences differ widely across Member States. These patterns show that inclusion is not achieved through a single measure but through the combined effect of economic security, accessible services and everyday social participation. By making these patterns visible, open data helps policymakers, researchers and citizens work toward a Europe where participation is a shared right for all.