
Sport in Europe: Who plays, who works, who wins
Insights on participation, employment and Olympic performance across the EU
When was the last time you exercised or played a sport?
For some, the answer is today. For others, it may have been weeks or even months ago. Europeans’ engagement with sport varies widely, but those who do participate are often motivated by similar goals. Whether it is to stay healthy, improve fitness, relax, have fun or spend time with others, sport remains a central part of life for millions of people across Europe.
Using open data, this data story explores participation in sport, employment in the sport sector and Olympic performance across the EU. Together, these dimensions highlight the social and economic importance of sport, along with Europe’s presence on the international sporting stage.
Who is active in Europe – and does this differ between men and women?
Physical activity is an important part of a healthy lifestyle. But how often Europeans engage in sport varies widely across countries and between men and women (see Figure 1).
The data shows 38 % of Europeans report exercising or playing sport almost daily or several times a week. This overall figure, however, differs considerably from one Member State to another. Regular engagement in sport is highest in Finland, where 71 % of adults report exercising or playing sport almost daily or several times a week. Participation is also high in Luxembourg (63 %) and the Netherlands (60 %). By contrast, fewer than 25 % of adults in Romania, Bulgaria and Portugal report exercising or playing sport regularly, underlining the large differences in sporting habits across the EU.
The figure also reveals a consistent gender gap in regular sports engagement. At the EU level, men are approximately seven percentage points more likely than women to report exercising or playing sport almost daily or several times a week. However, the size of this gap varies considerably between Member States. In Finland, the Netherlands and Denmark, the gap is barely visible, at around two percentage points or less, while Luxembourg stands out as the only Member State where women are slightly more likely than men to participate regularly in sport. By contrast, some of the largest gaps are observed in Ireland, Slovakia and Poland, where men appear to be around 13 to 14 percentage points more likely than women to engage in sport.
Across the EU, women remain less likely than men to engage in sport, a gap that appears in nearly every Member State regardless of the overall participation level. Understanding these differences is an important step towards making sport more accessible and inclusive for everyone.
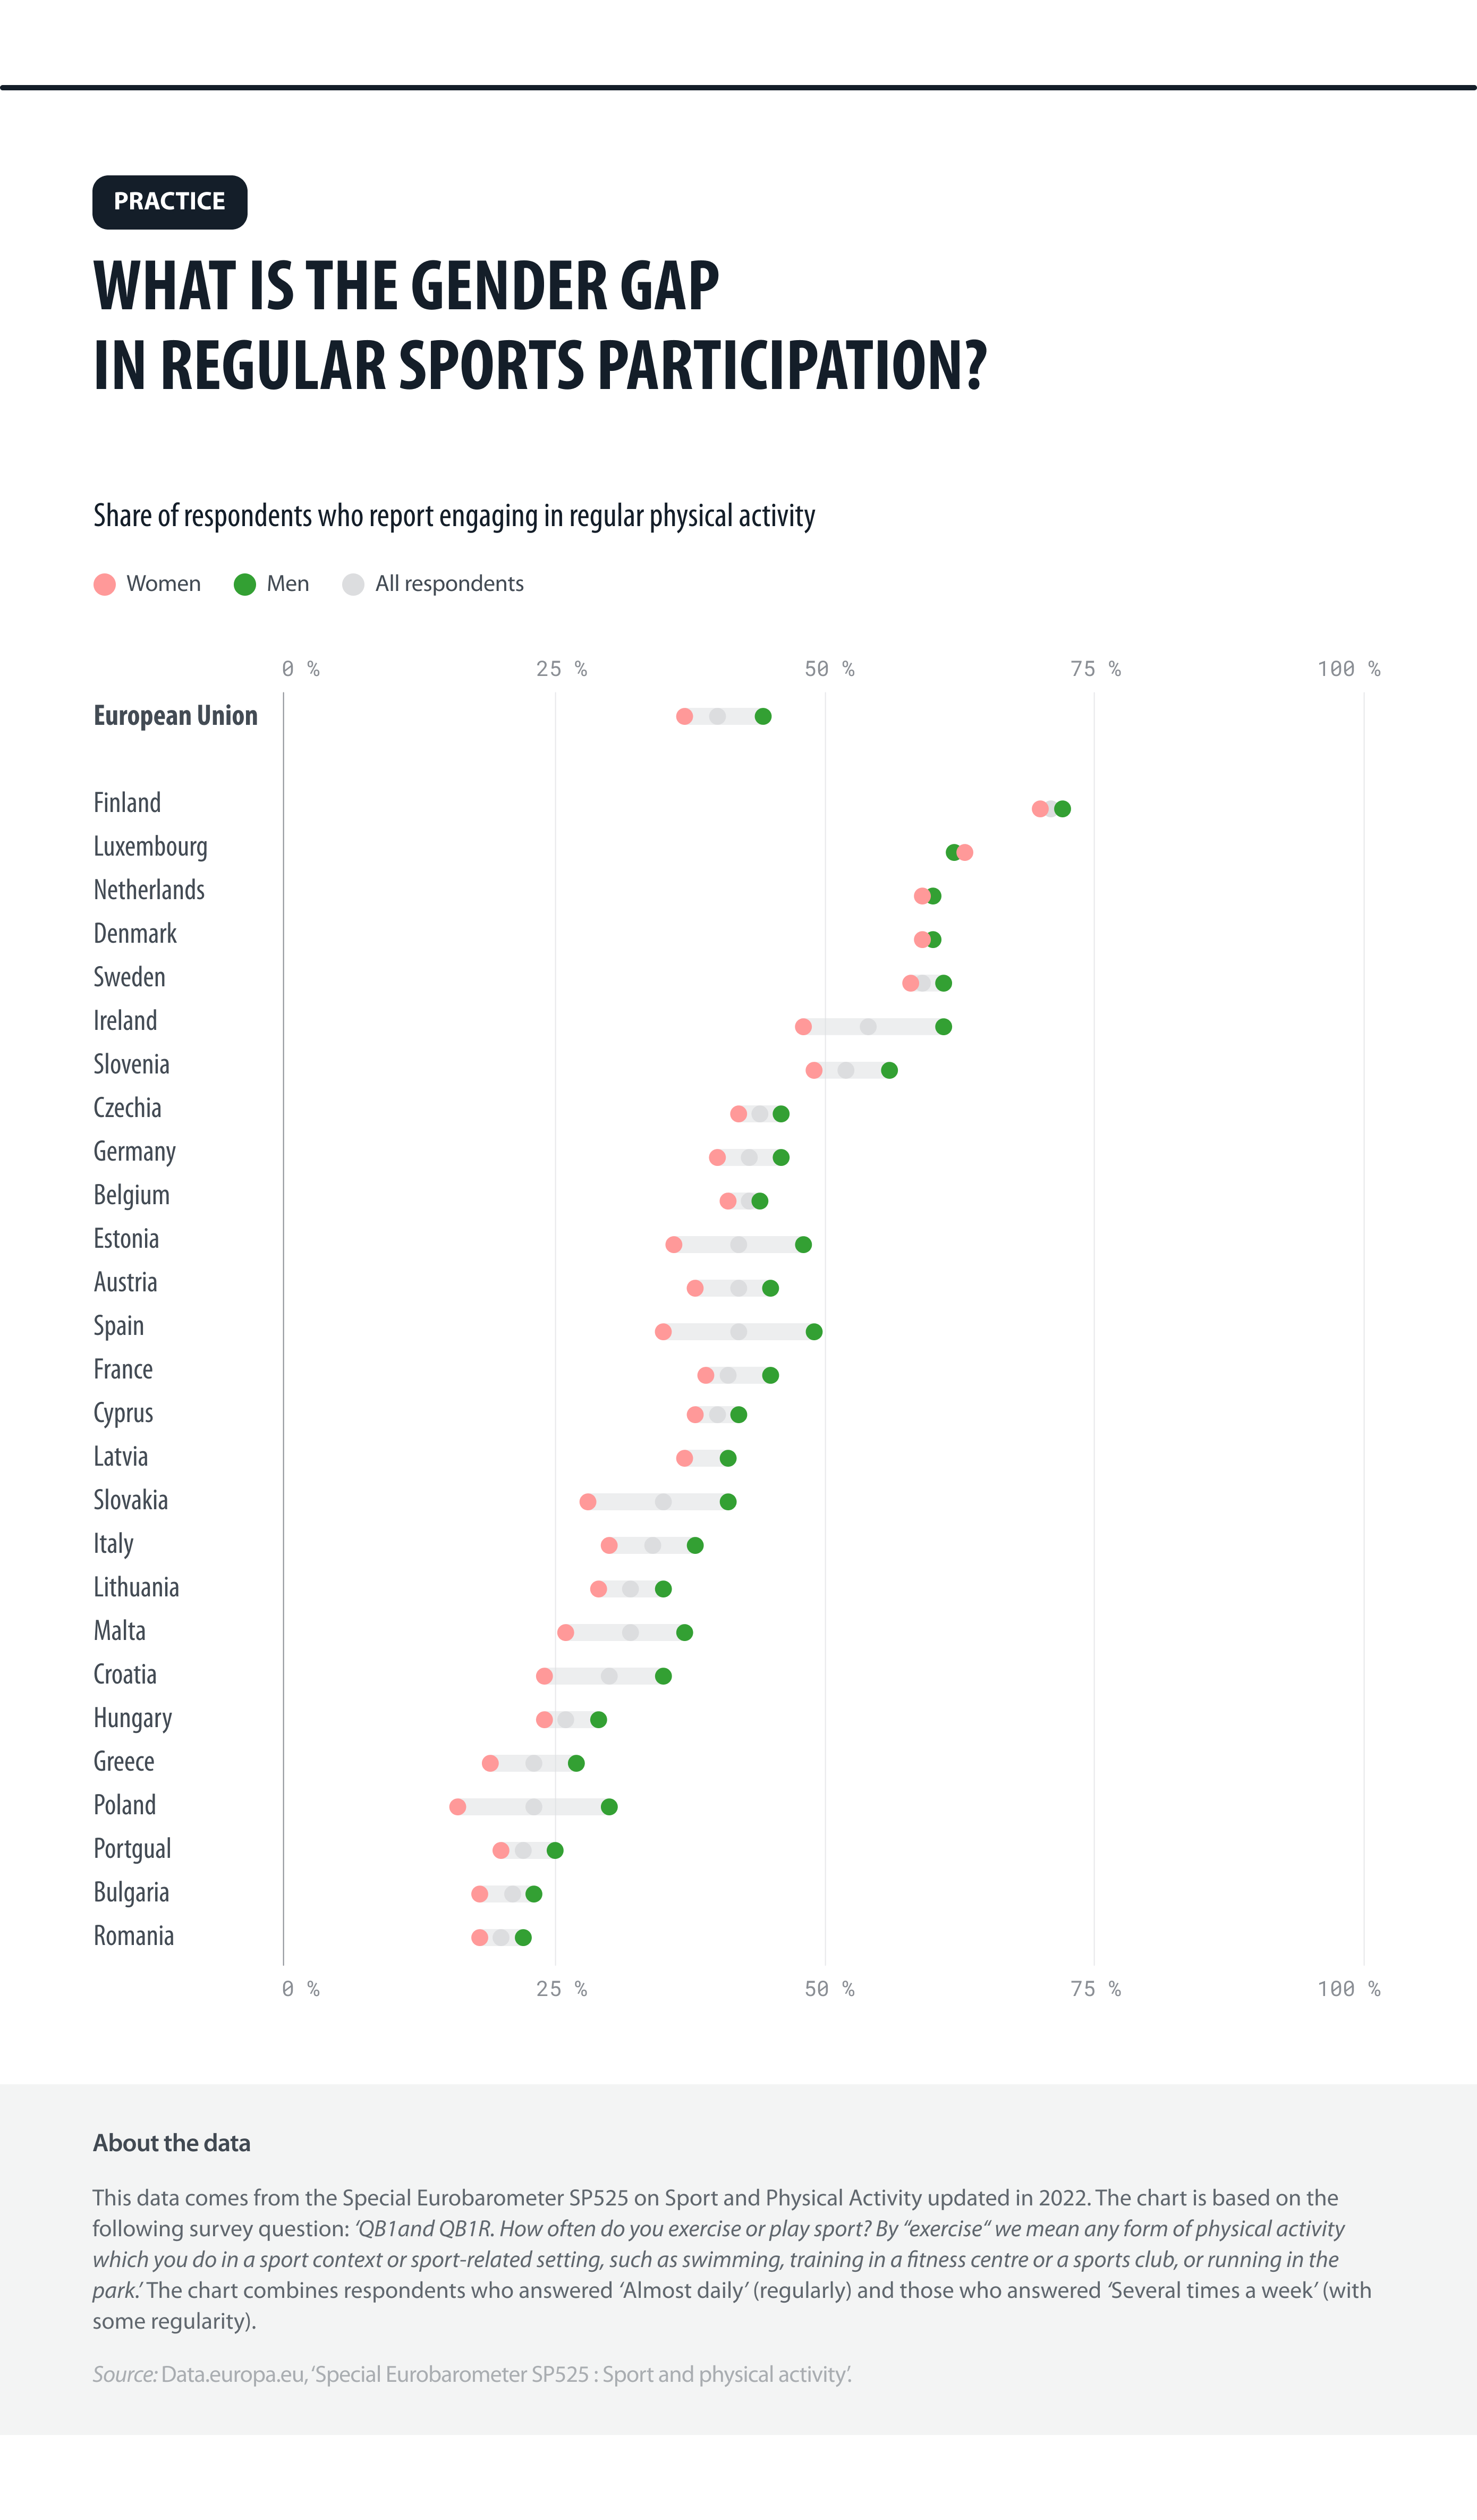
Figure 1: Sports participation by gender across EU Member States
Source: Eurobarometer / European Data Portal.
How many Europeans work in sport?
Sport is not only played and watched by Europeans – it also employs them. Across the EU, more than 1.7 million people work in sport, from coaches and fitness instructors to sports managers and event organisers.
As shown in Figure 2a, the share of people employed in sport has gradually increased over time. In 2011, sport accounted for around 0.6 % of total employment in the EU. By 2025, this figure had risen to almost 0.9 %, reflecting the growing role of the sector in the European labour market. Of all Member States, Sweden records the highest share of sport employment, with around 1.6 % of all workers employed in the sector, followed by Denmark, Finland and Spain. At the other end of the ranking, Romania reports by far the lowest share, at around 0.2 %, while Bulgaria and Czechia also remain below the EU average.
Sport employs people of all ages, but young workers are especially well represented in the sector compared with the wider economy. Figure 2b shows that workers aged 15–29 represent 36 % of all sport employment, whereas the same age group represents only around 18 % of total employment across all sectors. This pattern can be observed across almost the entire EU. In all countries, young people account for a larger share of sport employment than of employment in the wider economy. The contrast is particularly striking in the Nordic countries, Denmark, Finland and Sweden, where young people make up more than 47 % of the sport workforce.
Taken together, the figures show that sport is a relatively small but growing source of employment across the EU. At the same time, it plays a particularly important role for younger workers, making the sector one of Europe’s youngest workforces.
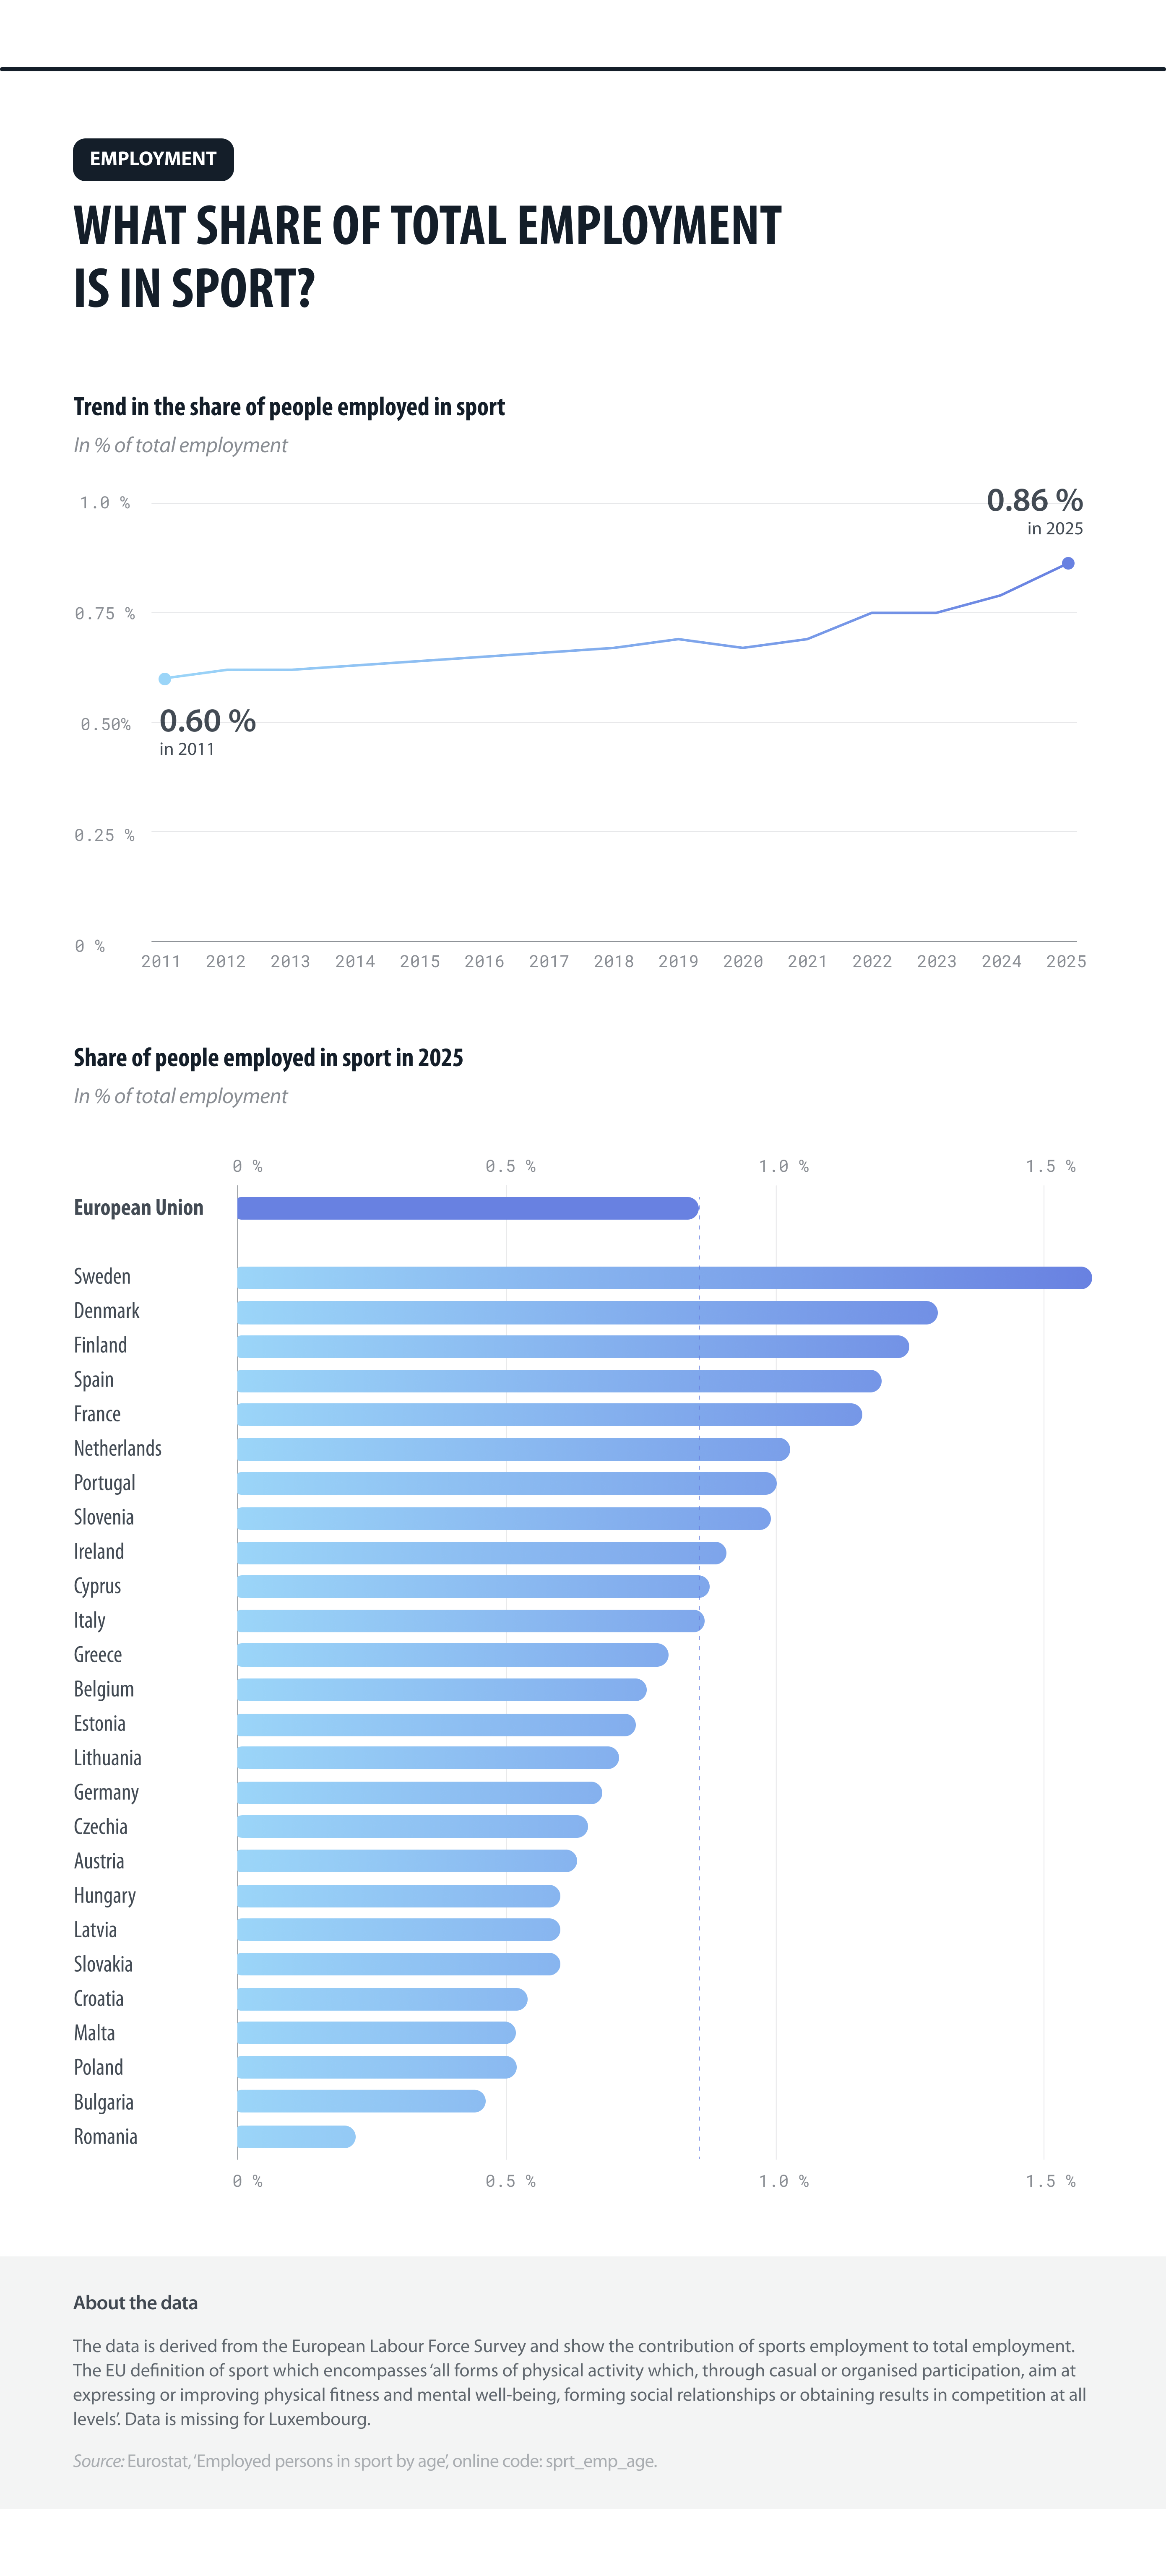
Figure 2a: Europeans employed in sport over time and across EU Member States in 2025
Source: Eurostat / European Data Portal.
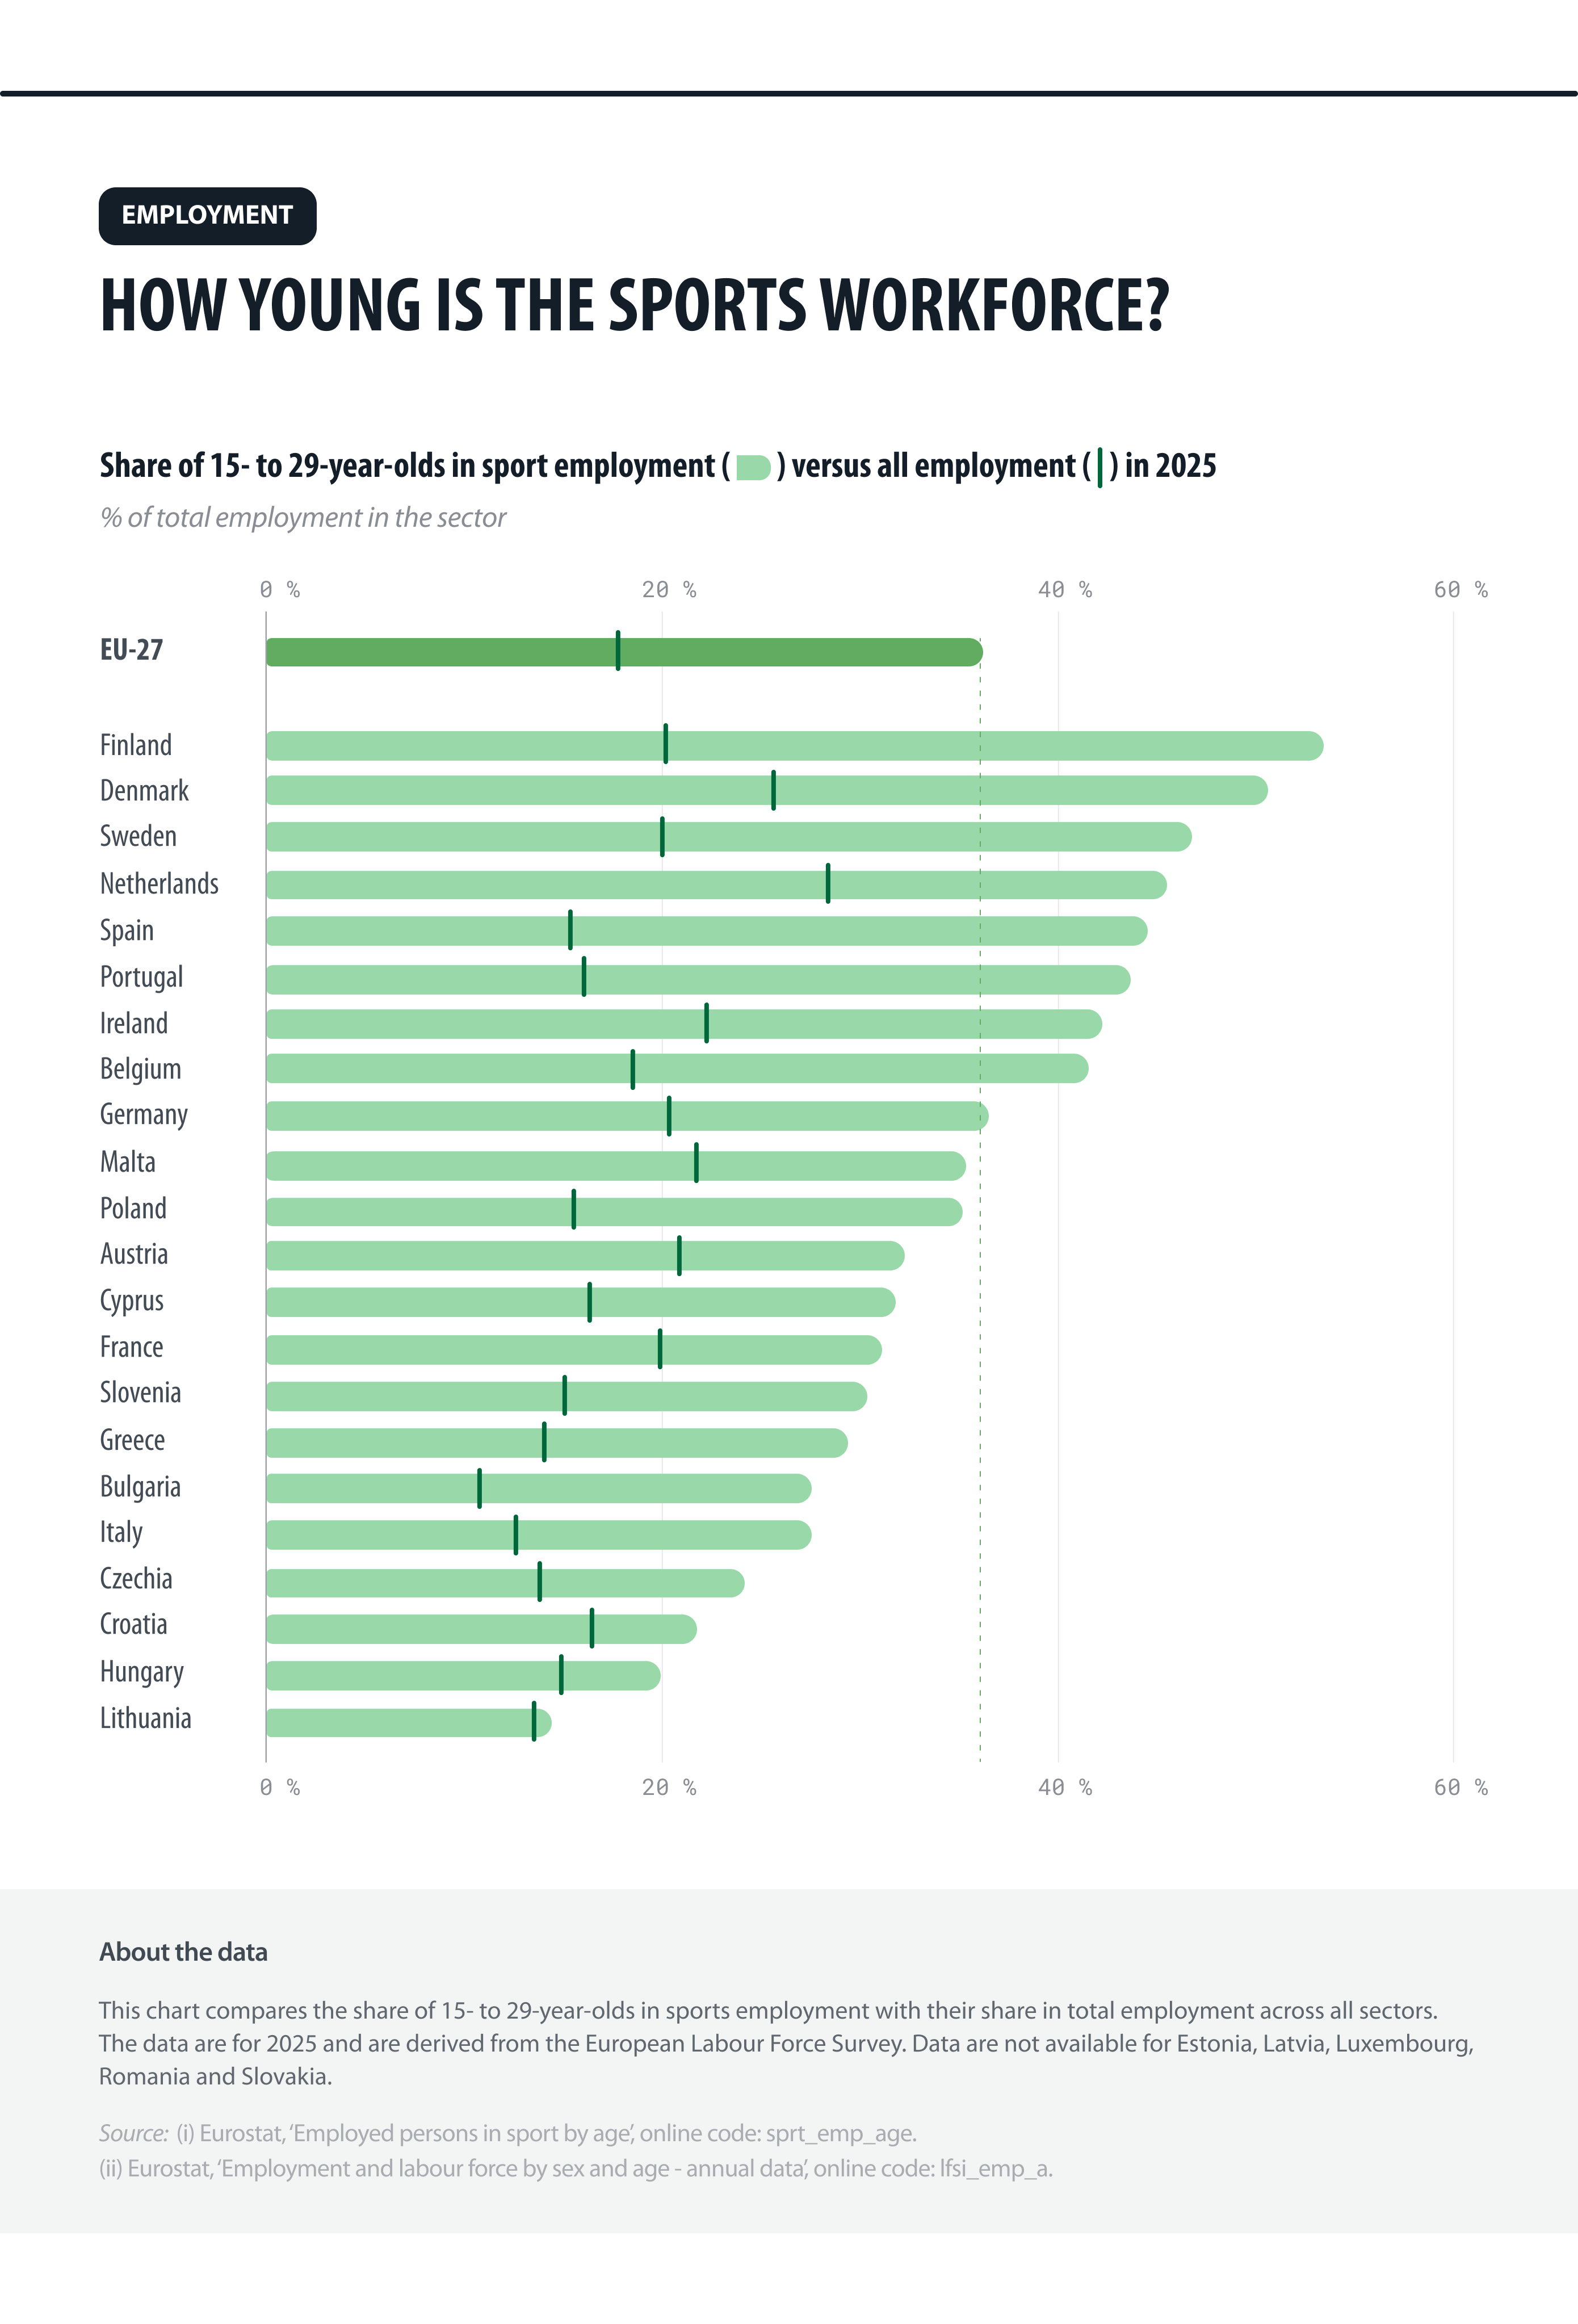
Figure 2b: Sport employment as a share of total employment across EU Member States
Sources:
- Employment in sport: Eurostat / European Data Portal;
- Total employment: Eurostat / European Data Portal.
How did Europe perform at the Paris 2024 Olympic Games?
The Olympic Games bring together athletes from across the world to compete at the highest level of sport. The results of the Paris 2024 Games provide an opportunity to explore how the EU performed and which countries contributed most to its success.
Figure 3 compares the number of medals won by each EU Member State with its population size. In general, larger countries tend to win more medals than smaller ones. France (as host) won the highest number of medals at the Paris 2024 Olympic Games with 64 medals, while Italy, Germany and Spain were also among the strongest performers. Some of the EU’s smallest Member States, including Luxembourg and Malta, did not win any medals, while several other smaller countries won only a handful. There are, however, notable exceptions to this relationship. The Netherlands secured 34 medals, the third-highest total in the EU, while Hungary won 19 medals despite having fewer than 10 million inhabitants.
The figure also shows how medals were distributed across sport categories and regions of the world. EU Member States won 309 medals at the Paris 2024 Olympic Games, while Europe as a whole secured 414 medals, more than any other continent. Europe’s strongest performance was in cycling, where EU Member States secured 32 of the 66 medals awarded. EU Member States also led in paddling and water sports (66 of 121 medals) and team ball sports (24 of 48 medals). The EU’s dominance was least pronounced in precision sports (11 of 60 medals) and gymnastics and acrobatic sports (12 of 61 medals), where EU Member States secured less than one fifth of all medals awarded.
Overall, Europe’s success at Paris 2024 was built on strength across a wide range of sports, from athletics and team sports to cycling and paddling.
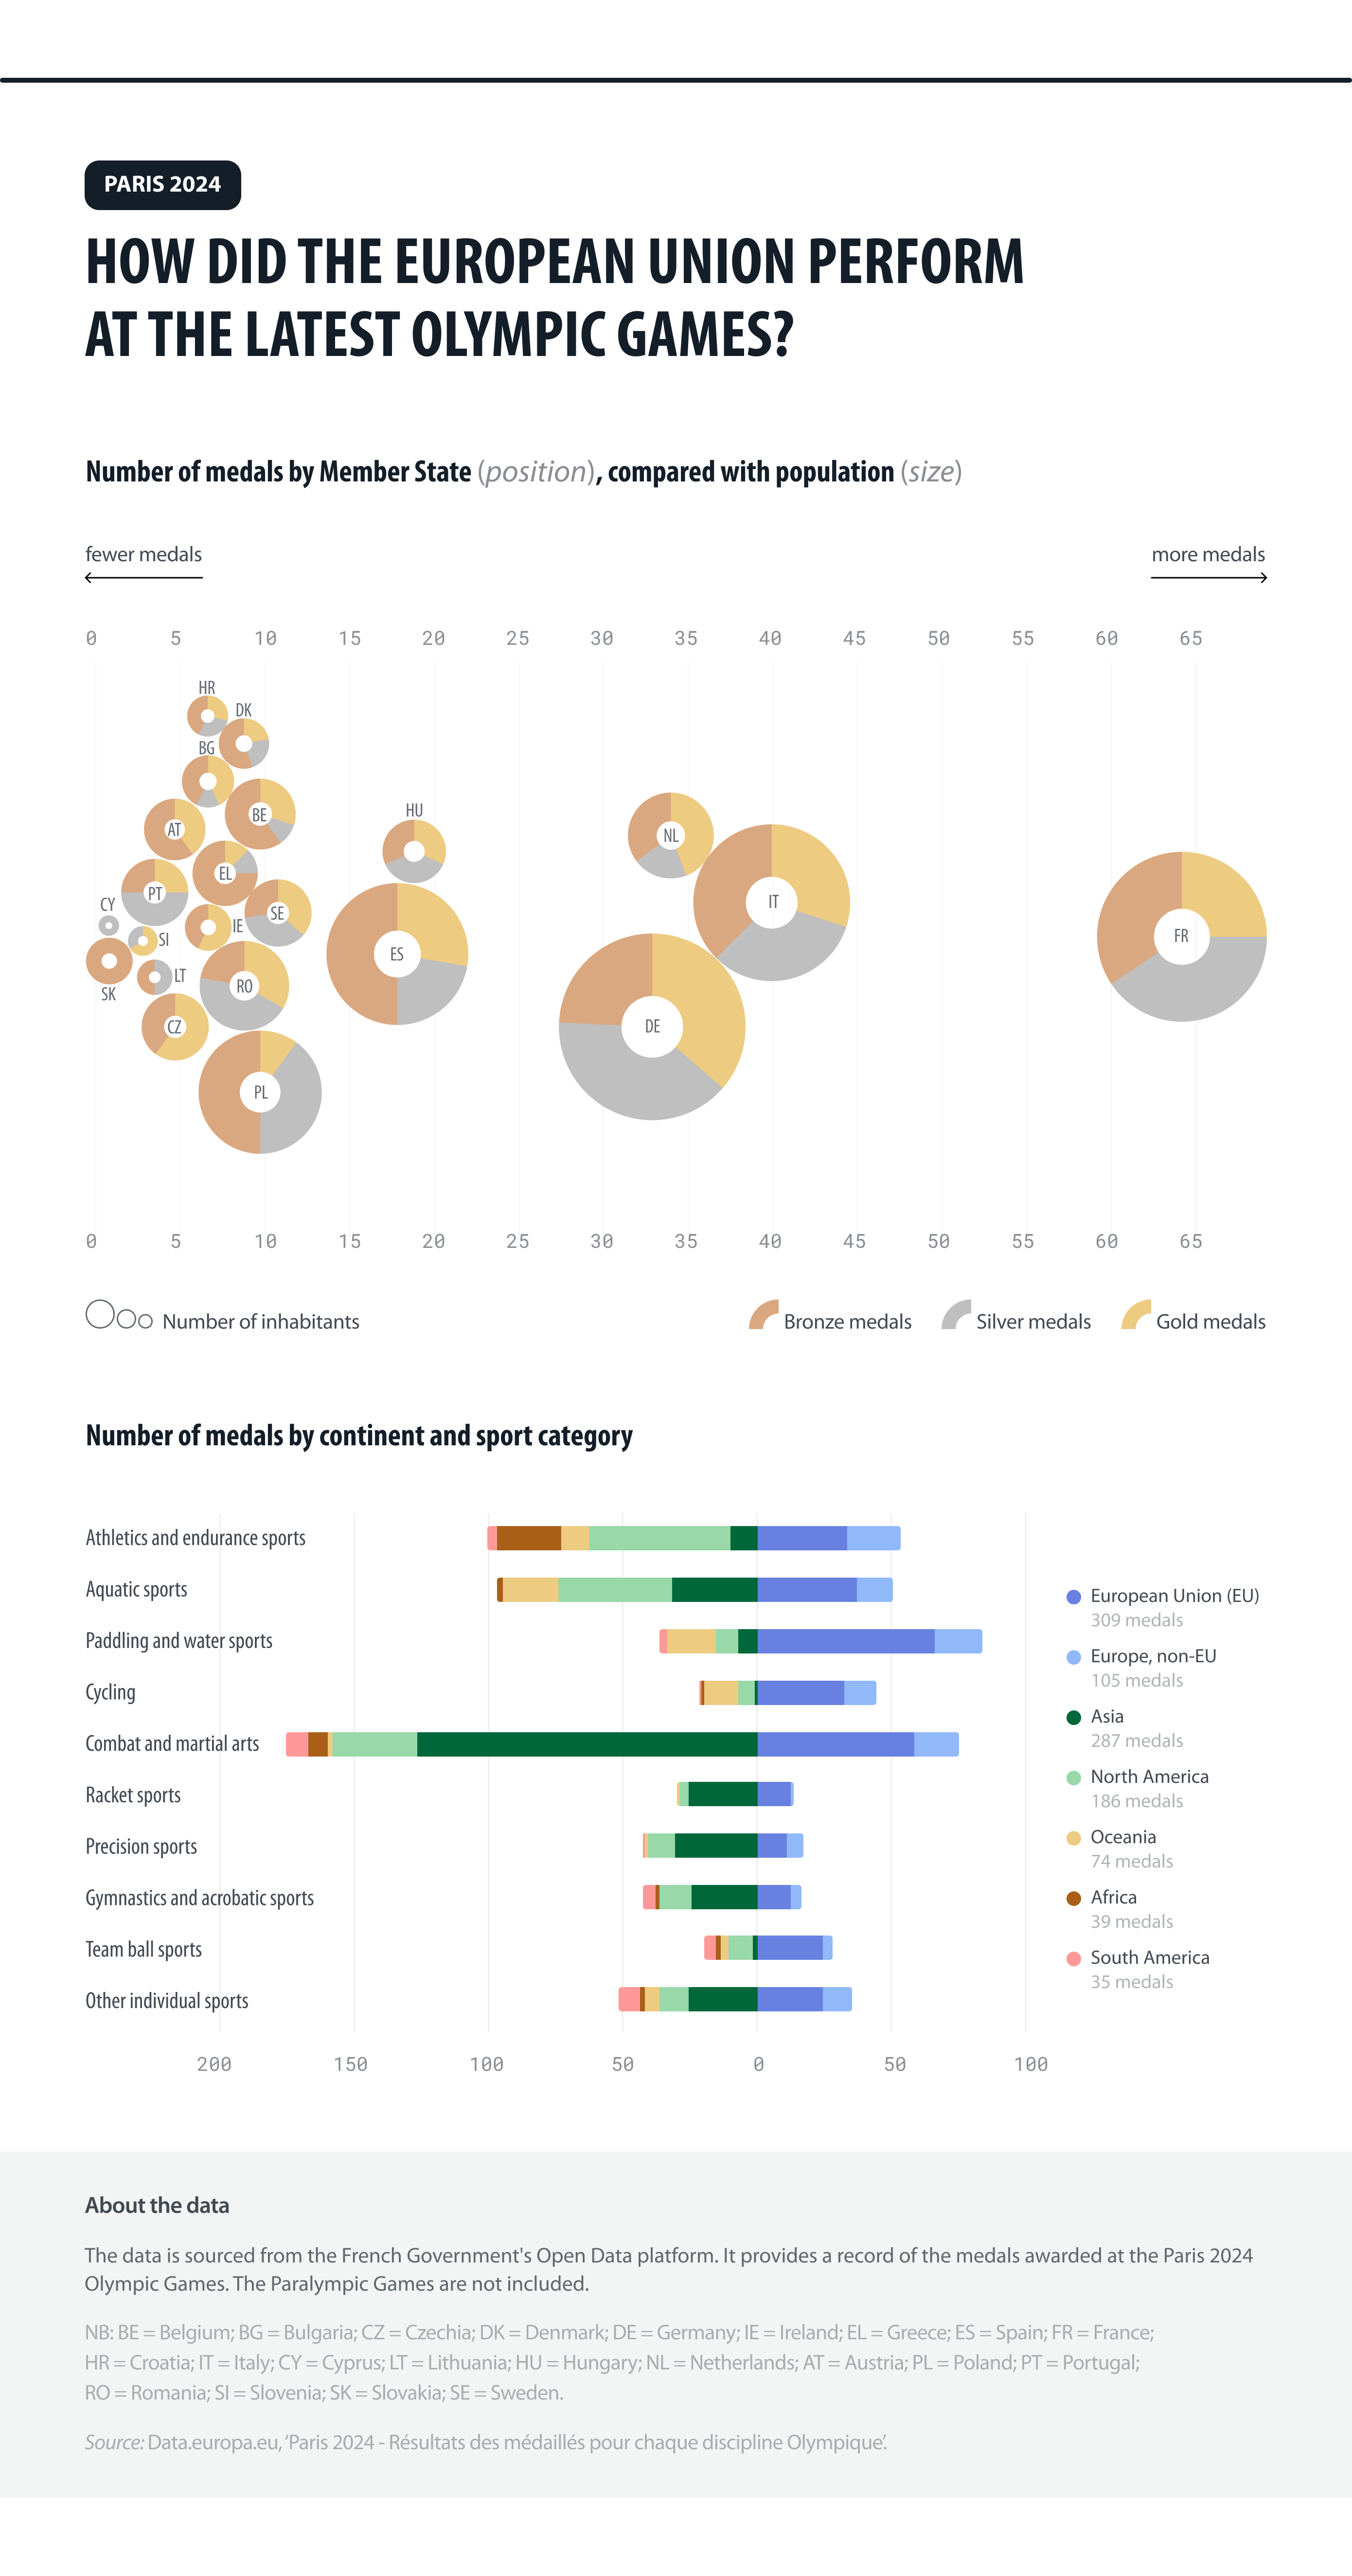
Figure 3: Olympic medal performance of EU Member States and continents at the Paris 2024 Olympic Games
Source: data.gouv.fr / European Data Portal.
Conclusion
Sport remains an important part of life across the EU, but participation, employment and performance vary considerably between Member States. While some countries report high levels of regular exercise, others lag behind, and a gender gap in sport remains visible across much of the EU.
Beyond participation, sport also contributes to the economy through employment. Although the sector accounts for a relatively small share of total jobs, it has grown steadily over time and plays a particularly important role for younger workers.
The Paris 2024 Olympic Games highlight another dimension of sport in Europe. Collectively, EU Member States performed strongly across a wide range of disciplines, demonstrating the breadth of Europe’s sporting strengths.
Taken together, these figures show how sport shapes European society in multiple ways: as a source of health and well-being, employment and international achievement. Open data helps make these patterns visible, offering insights into how Europeans participate in, work in and excel at sport.
So, when was the last time you exercised?