Adobe Illustrator is widely used to make charts and graphics for printed publications by visualisation designers. This is also the case in news rooms, where visual journalists were more and more confronted with the need to create visualisations that work well online and on all screen sizes.
That is why the graphics team at the New York Times developed a tool to export more accessible and responsive graphics from Adobe Illustrator. This tool is called ai2html, and was released as an open source plugin for Illustrator.
Out of the box, Adobe Illustrator can export bitmap images like JPG and PNG files as well as vector files like PDF and SVG. This has the drawback that when the graphic is scaled, the text scales with the graphic and can become too small to read or disproportionally big. The main feature of ai2html is that exports graphics as HTML: all non-text elements are exported as a JPG or PNG file, while all text elements are overlaid on top of the image as HTML text.
This means that the text can stay the same font size when the underlying image is scaled. And this also means that the text in the visualisations is not baked into the images and is accessible to assistive technologies like screen readers. Another advantage is that text can be wrapped over multiple lines more easily (this is much harder with text in SVG).
With ai2html it is also easy to design different versions of your visualisation for different screen sizes. When you have multiple artboards in your Illustrator file, ai2html can export all of them (into a single HTML document, or into a separate HTML document for each of them). When this HTML is inserted into your web page, CSS media queries can be used to hide and show the relevant artboard/HTML on different screen sizes.
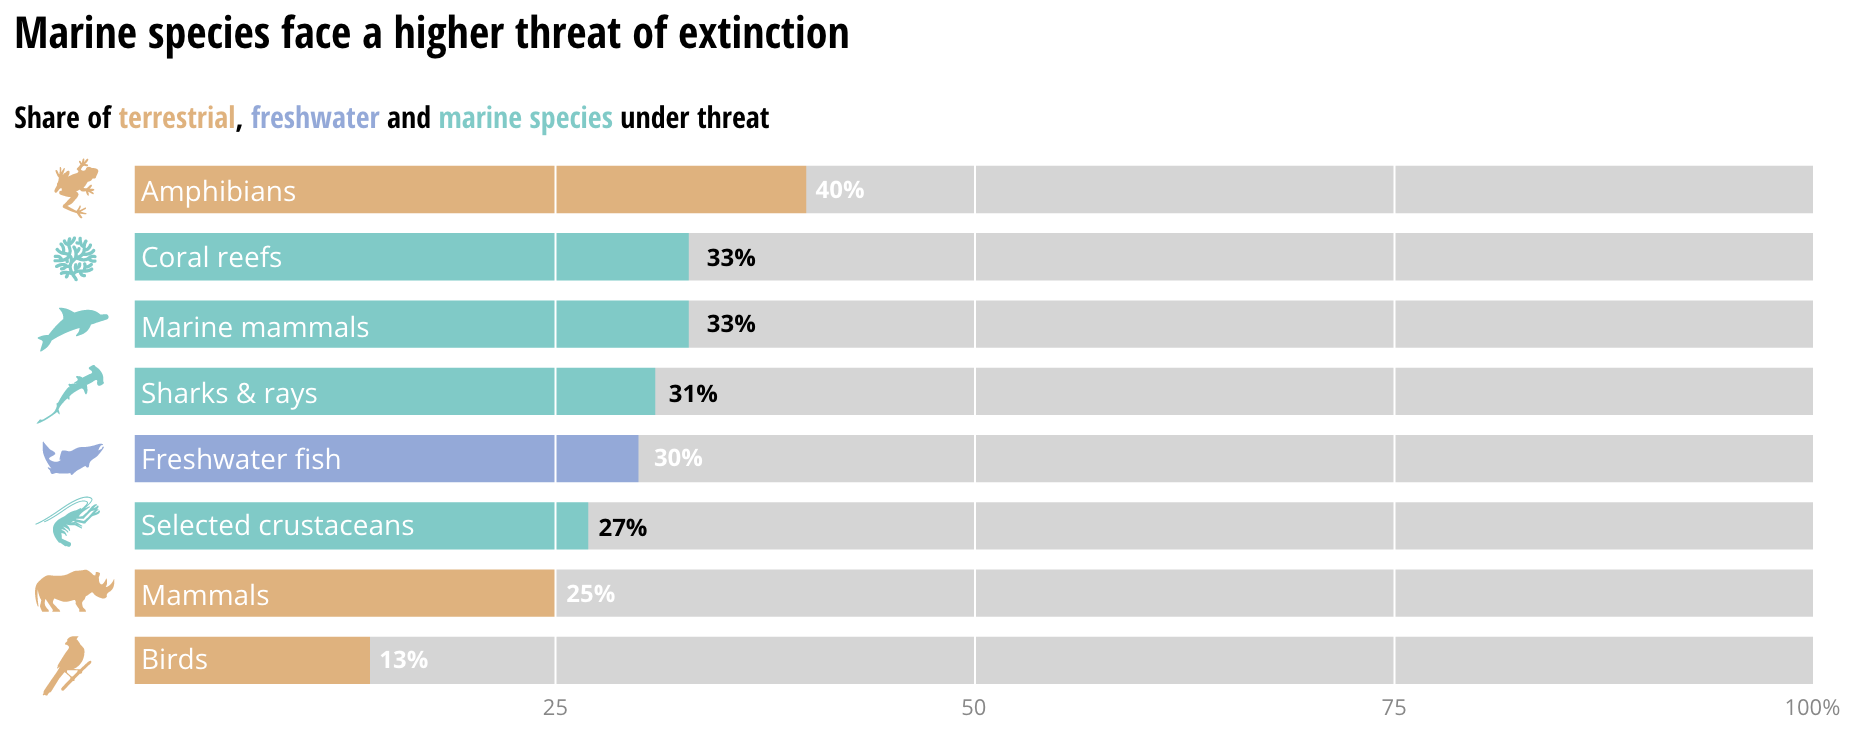
This bar chart was made with ai2html and is part of the article Marine species under threat of the Sustainable Development Goals Atlas 2020 of the World Bank. Below is the mobile version of the chart. Try the visualisation on different screen sizes, and also try the screen reader accessibility of the chart. Source: Sustainable Development Goals Atlas 2020, World Bank
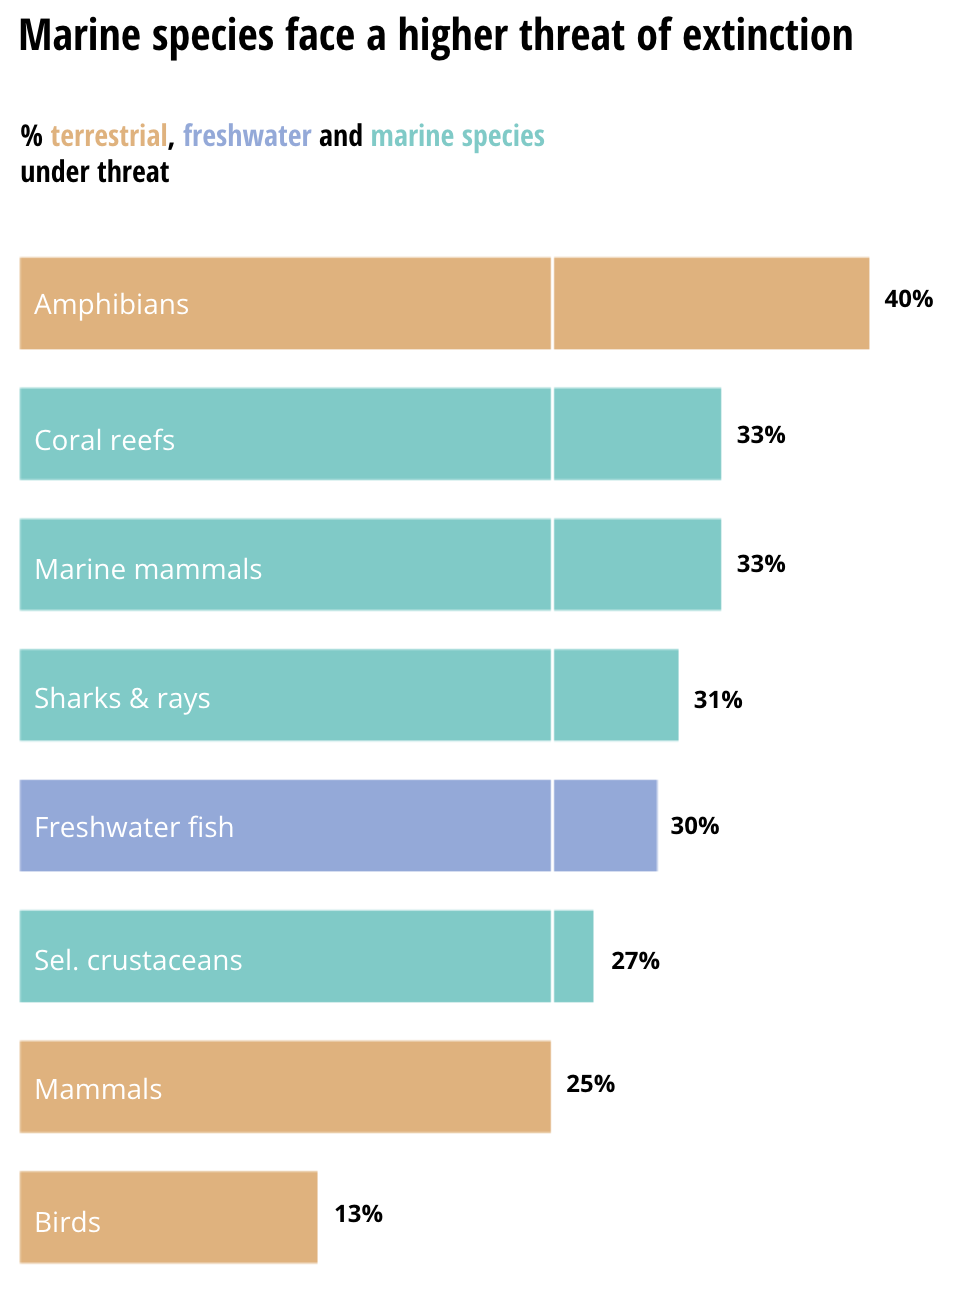
Source: Sustainable Development Goals Atlas 2020, World Bank
The following CSS snippet will toggle the visibility of 2 HTML elements with id’s “small-artboard” and “big-artboard”. When the browser window is smaller than 640 pixels, the small art board will be shown, but when the browser window is wider, the big art board will be shown.
@media (max-width: 640px) {
  #small-artboard {
    visibility: visible;
  }
	#big-artboard {
		visibility: hidden
	}
}
@media (min-width: 640px) {
  #small-artboard {
    visibility: hidden;
  }
	#big-artboard {
		visibility: visible
	}
}