Paying, desktop app
How to create graphs in Illustrator
Illustrator is the vector image editor tool in Adobe’s collection of design tools. It is a very flexible tool, but the built in charting tools are old and limited in functionality. Illustrator is widely used in data visualisation to apply finishing touches to vector images generated with other tools, and to create custom and creative data visualisations (check the work of Federica Fragapane for examples).
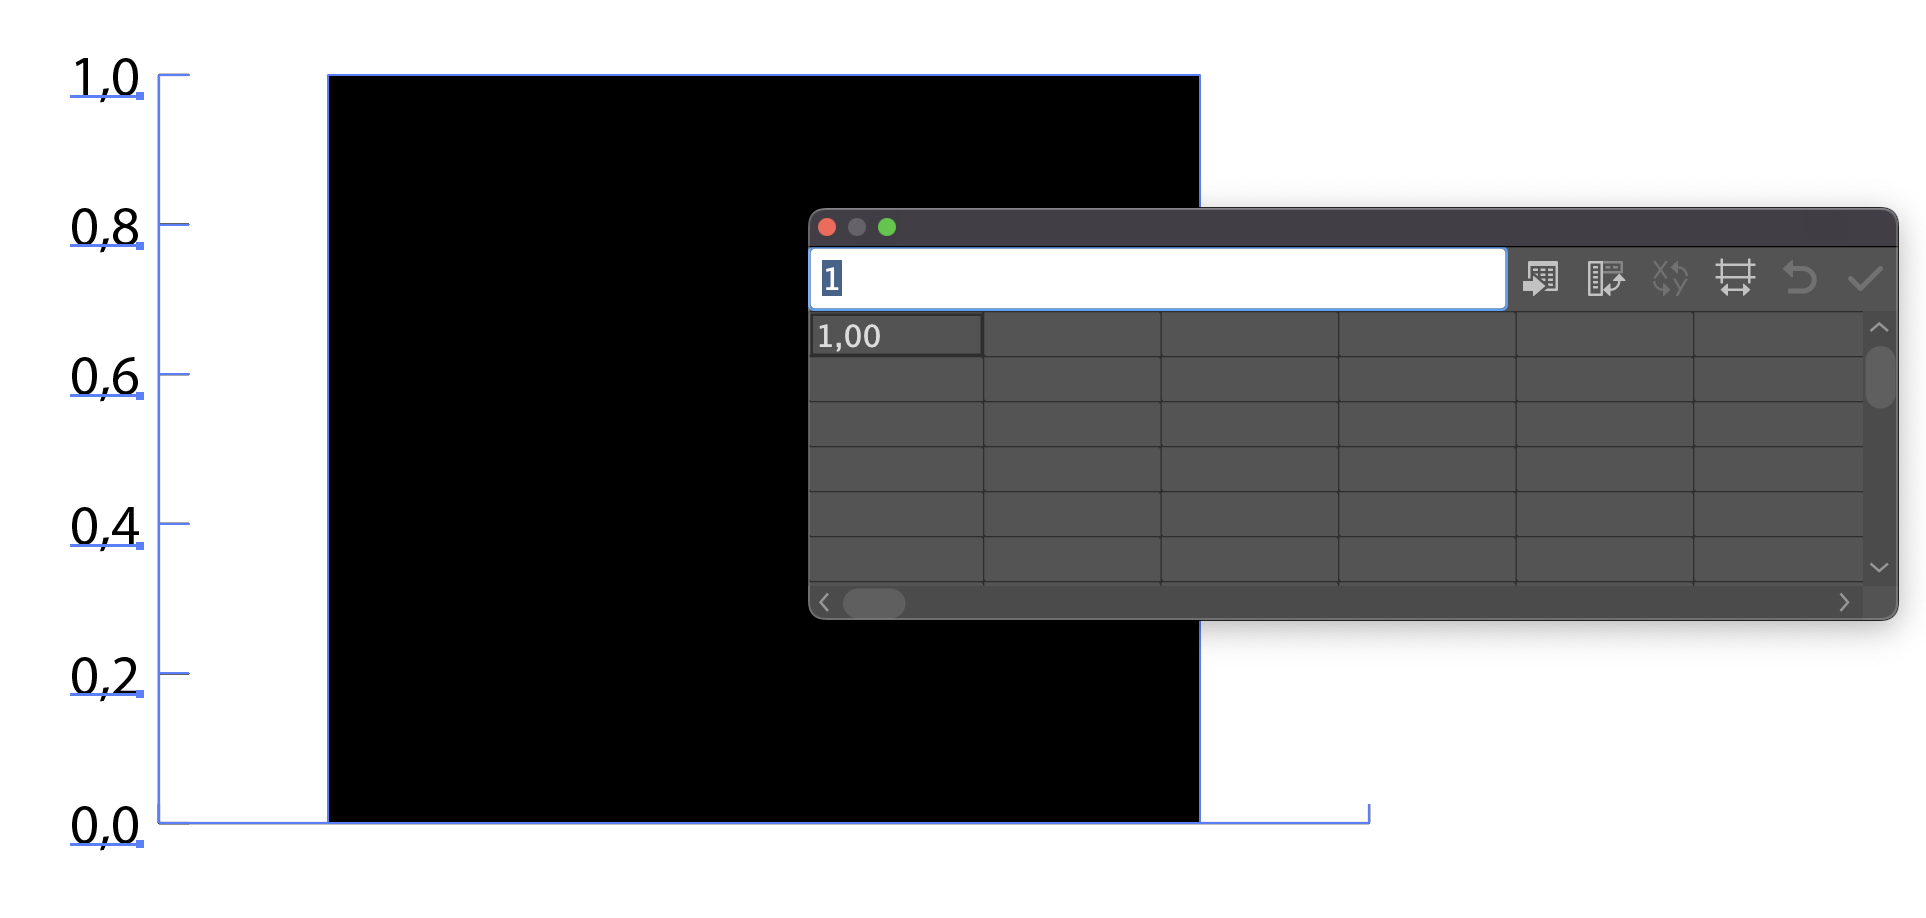
Illustrator’s interface for making a bar chart. Source: Maarten Lambrechts, CC BY SA 4.0