Highcharts is a JavaScript library to make a wide variety of charts and maps. To make Highcharts more accessible, Highcharts offers an Accessibility module (there are also additional modules to offer a link to download the data shown on a Highcharts visualisation).
Some of the accessibility features in Highcharts are:
- add a text description of a chart and make it available to screen readers
- makes the data points in a visualisation and the chart menu navigable and interactable with a keyboard
Demo of a Highcharts map that is navigable with the keyboard and accessible to screen readers. Source: highcharts.com/accessibility
- double encoding to not only rely on colours. This is implented through the use of different fill and dot patterns
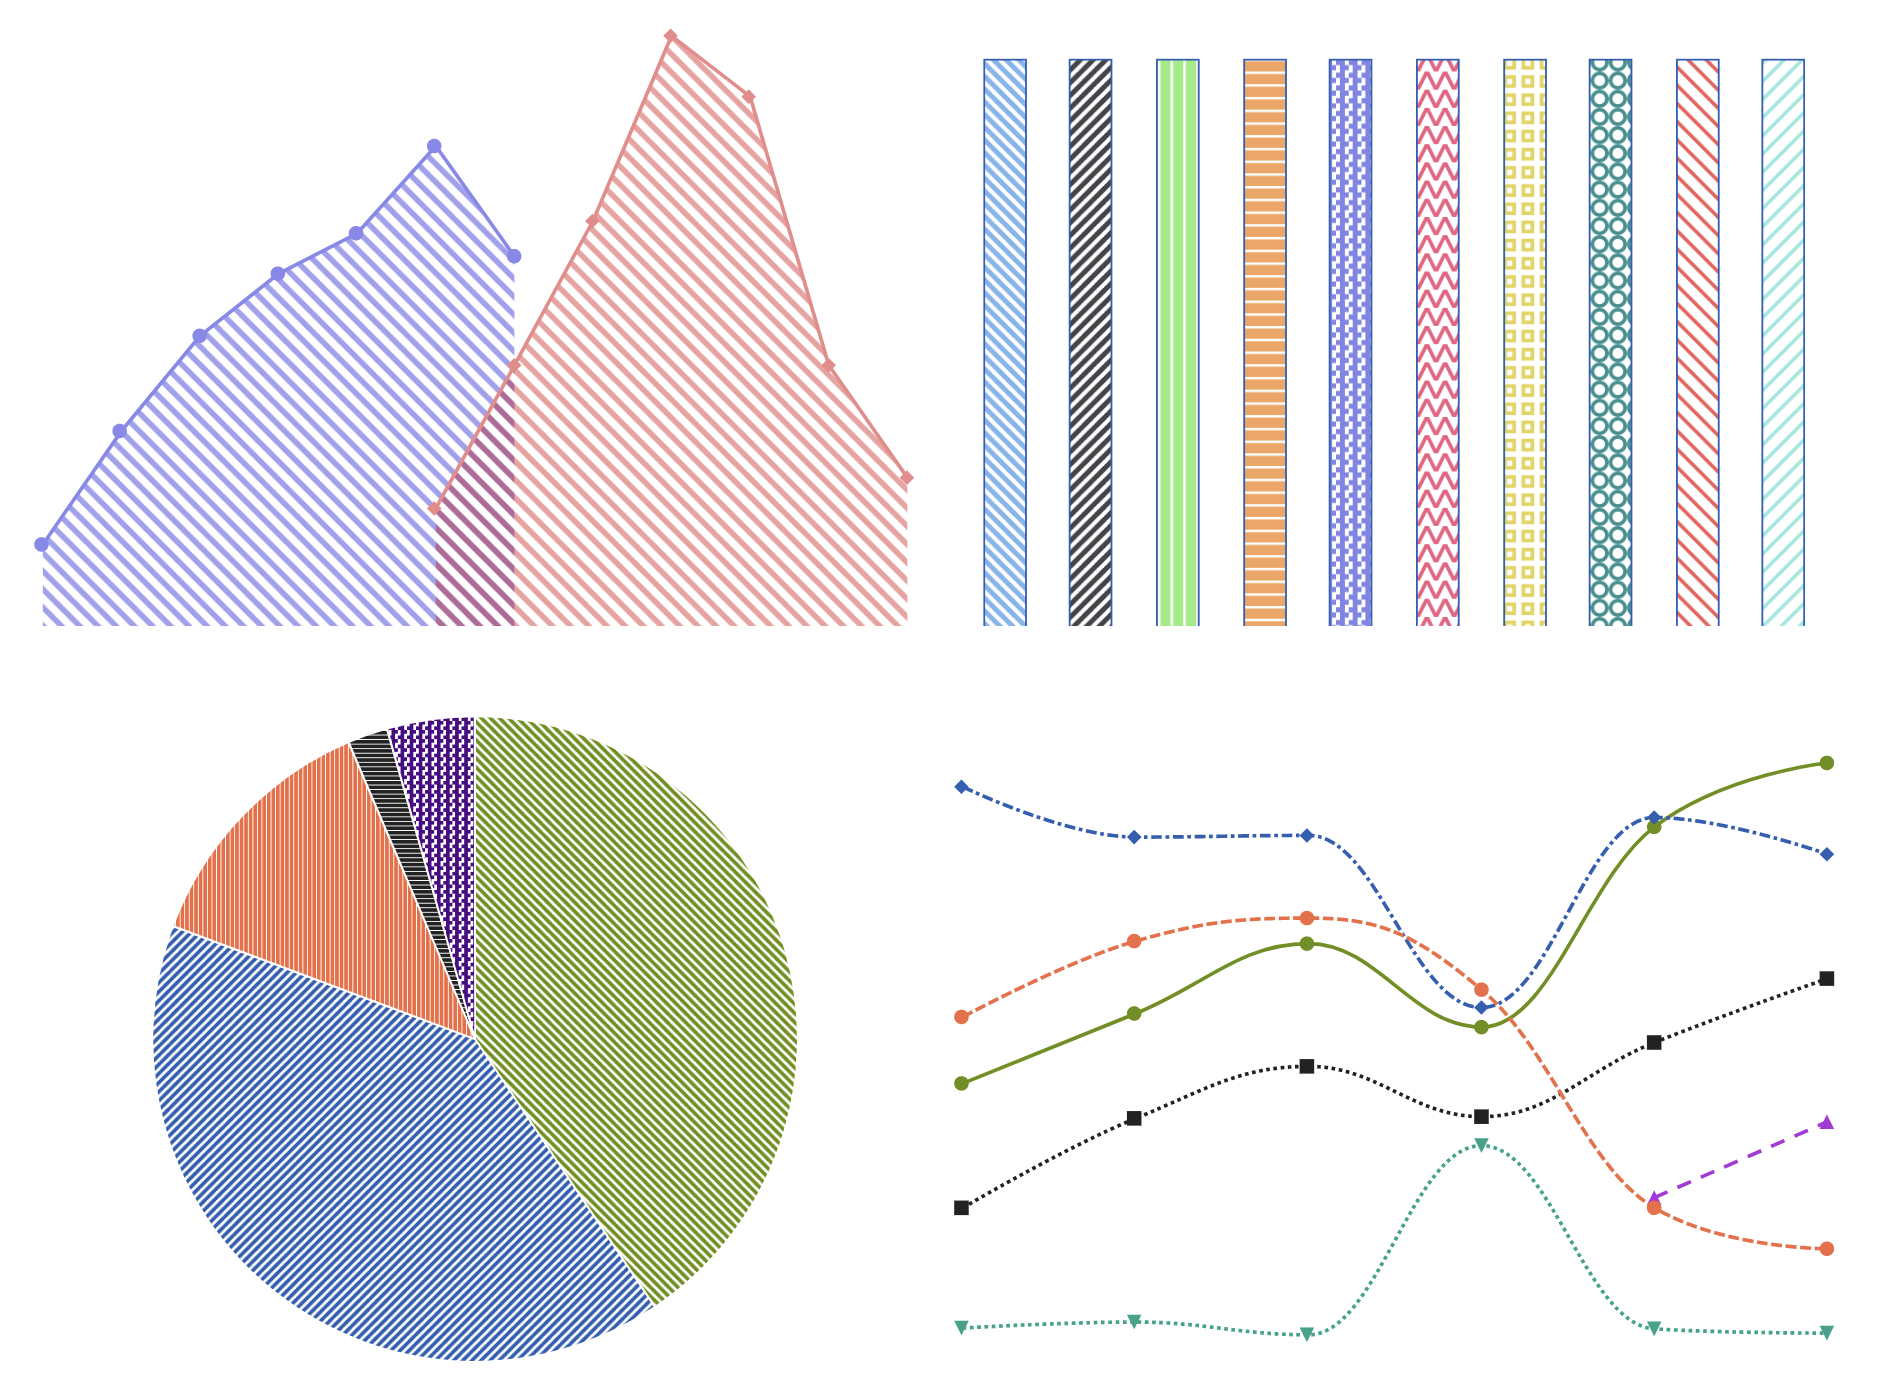
Source: highcharts.com/accessibility
- export of an SVG version of charts, that can be turned into a tactile graphic
- sonification of data, that turns data into sound