Because the grid creates a regular pattern (see The grid), with clean alignments and layout, any element that is not aligned to the grid of a publication, creates tension and dynamism. When breaking the grid is used well, it creates more interesting and engaging designs.

The title is breaking the grid, and connects the left and right part of the design. Source: Andre Ribeiro

Wrapping the text in the 2 columns around a central object creates a dynamic design. Source: Ted LoCascio
The technique of breaking the grid can be used to draw attention to a data visualisation, or to specific data points in a visualisation. It is a very efficient technique to draw attention to outliers (data points with extreme values) in data sets.
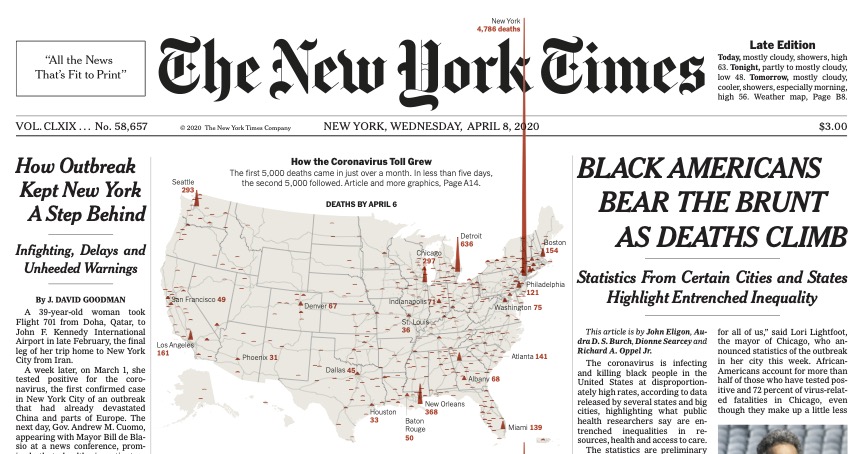
A spike map of covid-19 deaths in the United States, on the front page of the New York Times. The New York spike breaks out of the module of the map, and even spills over the heading. Source: nytimes.com
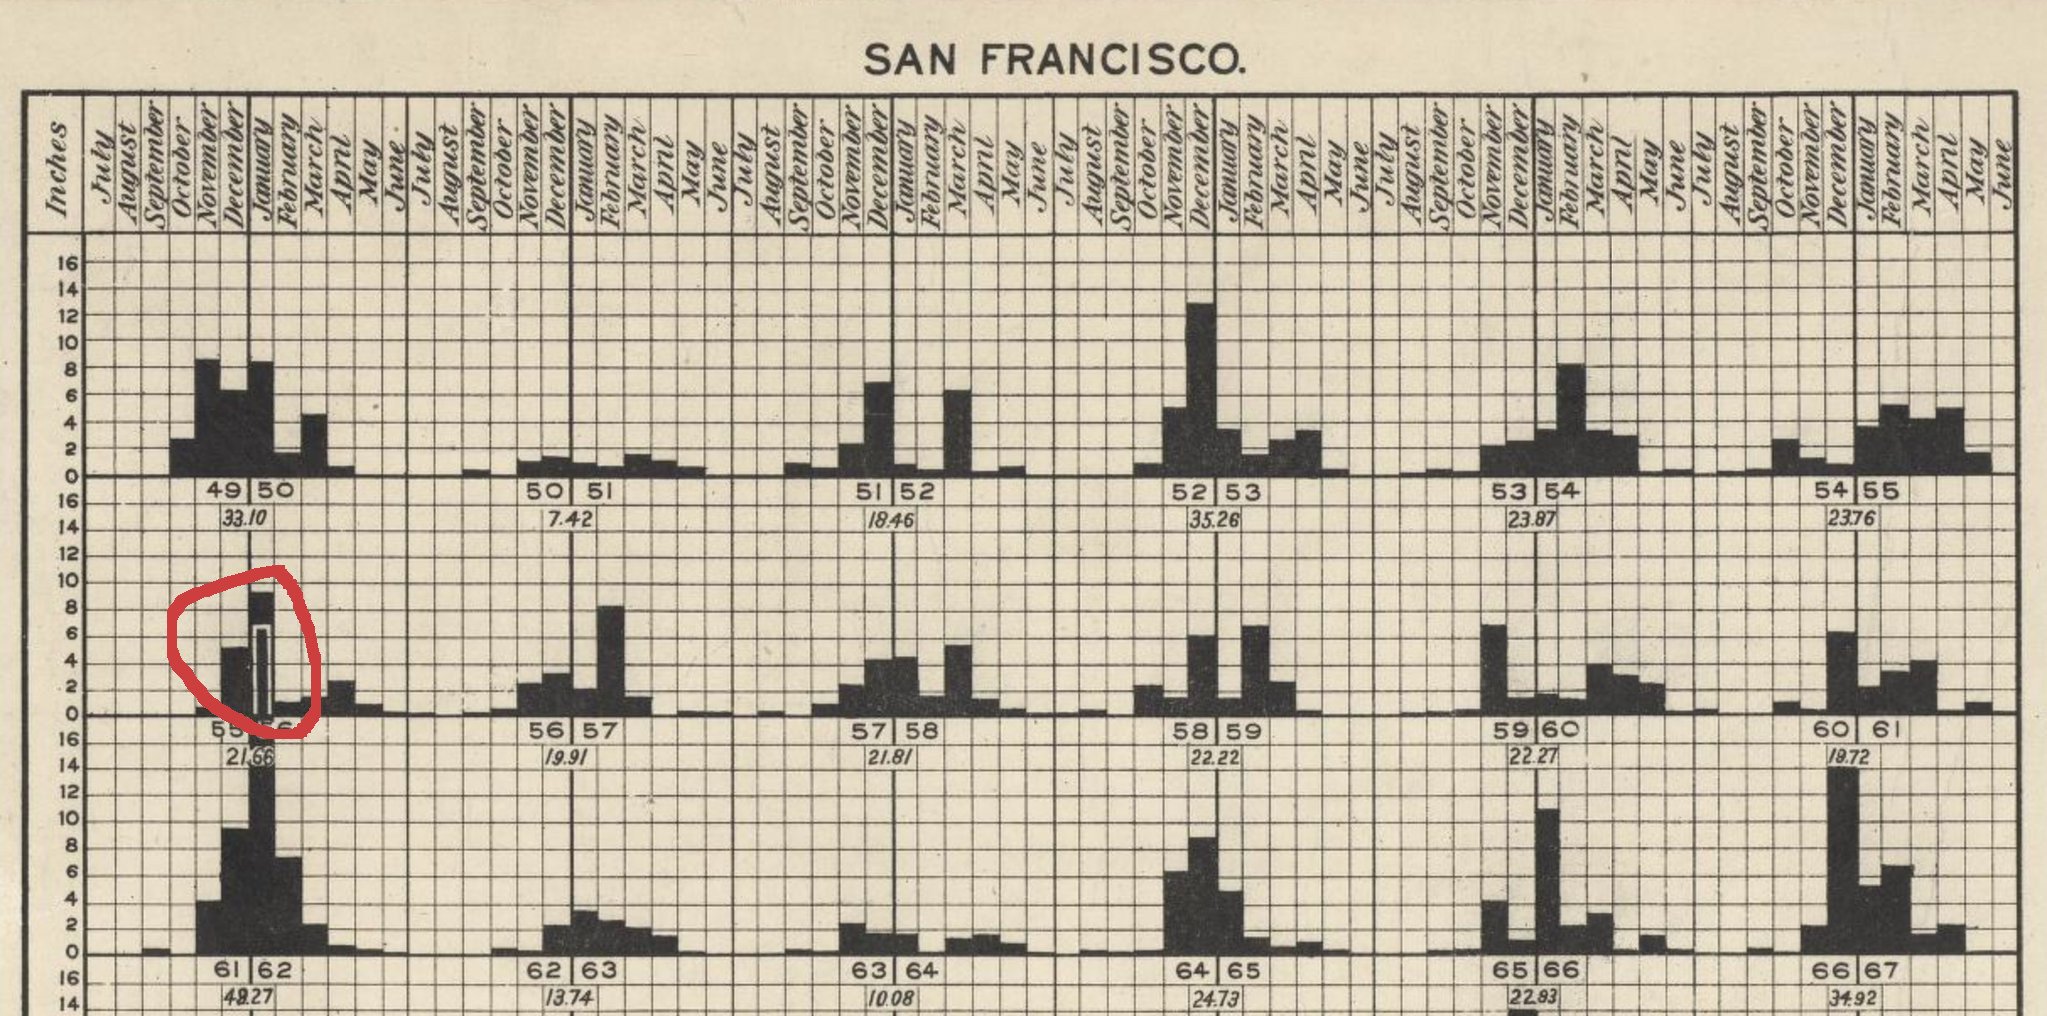
Source: davidrumsey.com
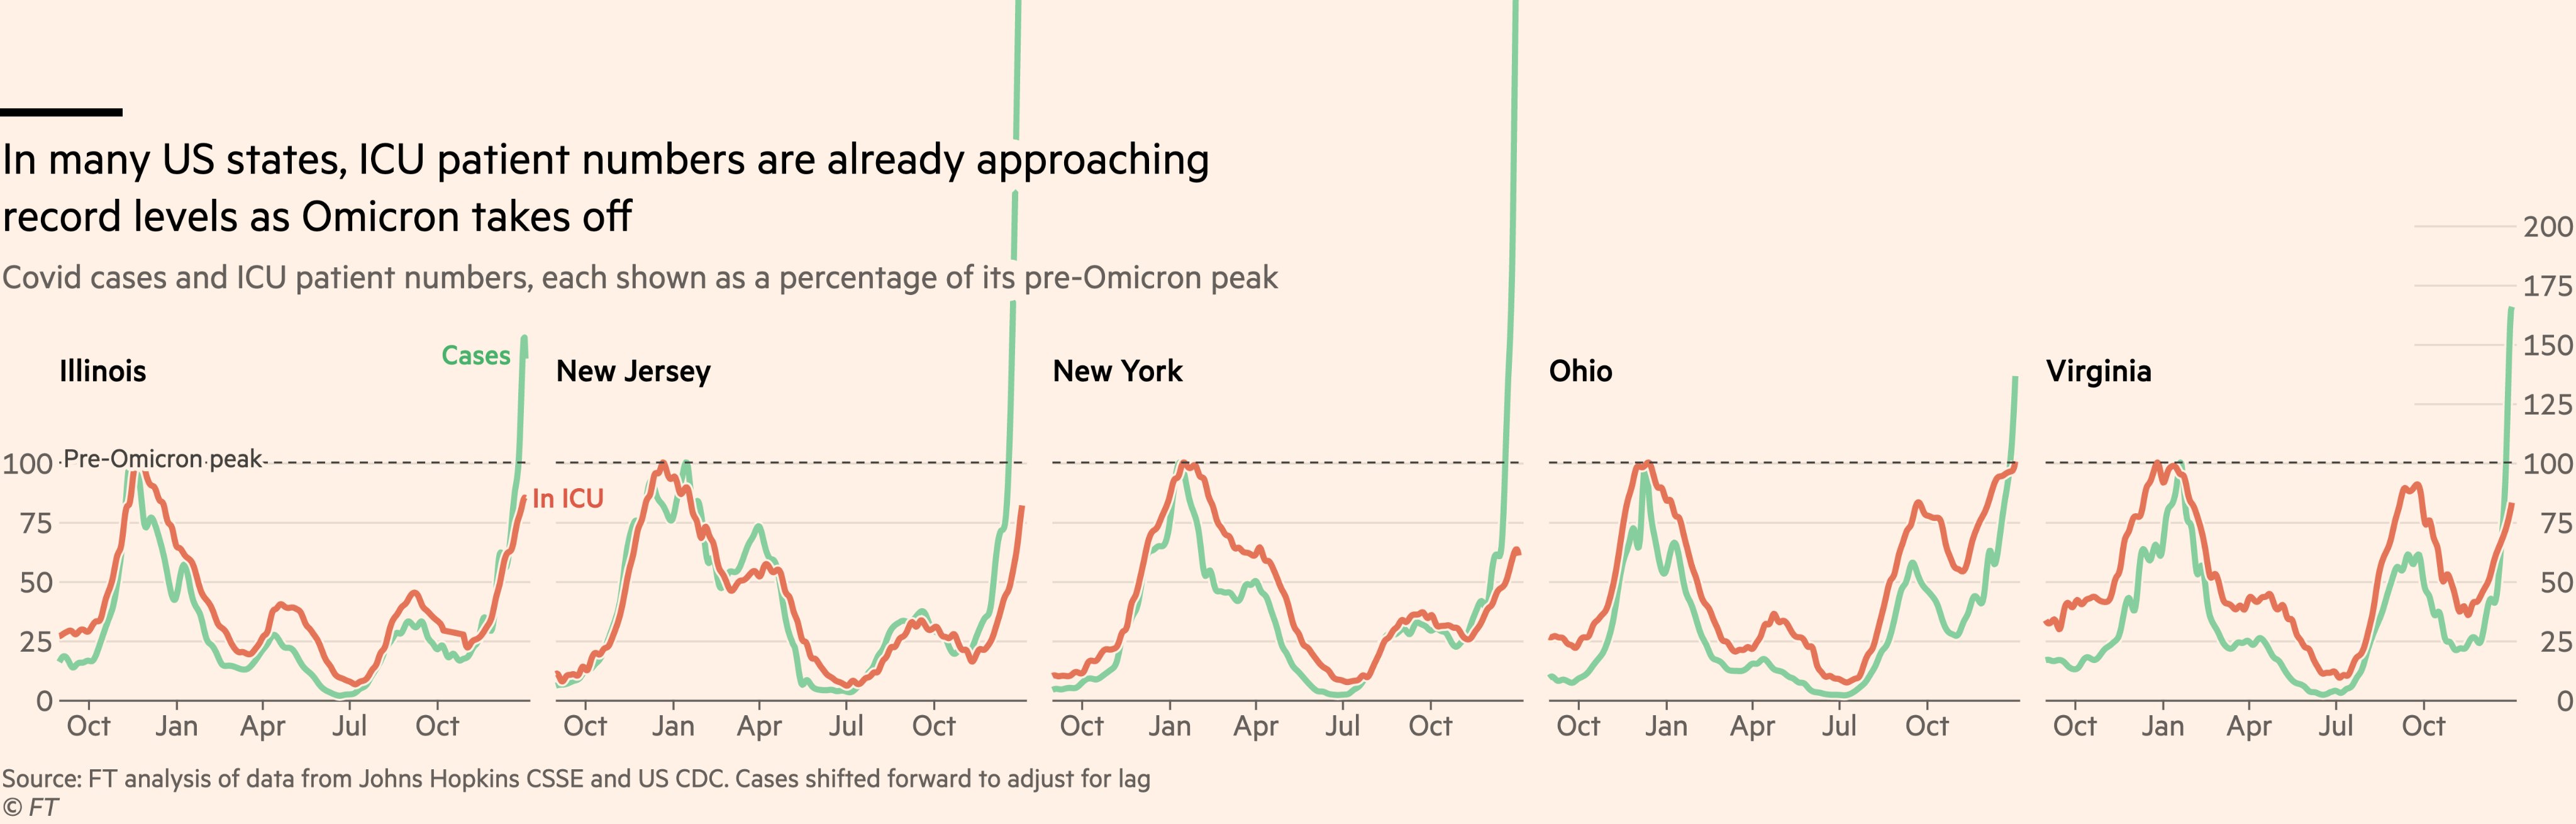
The Financial Times used this technique to show that some values were literally “off the charts”:
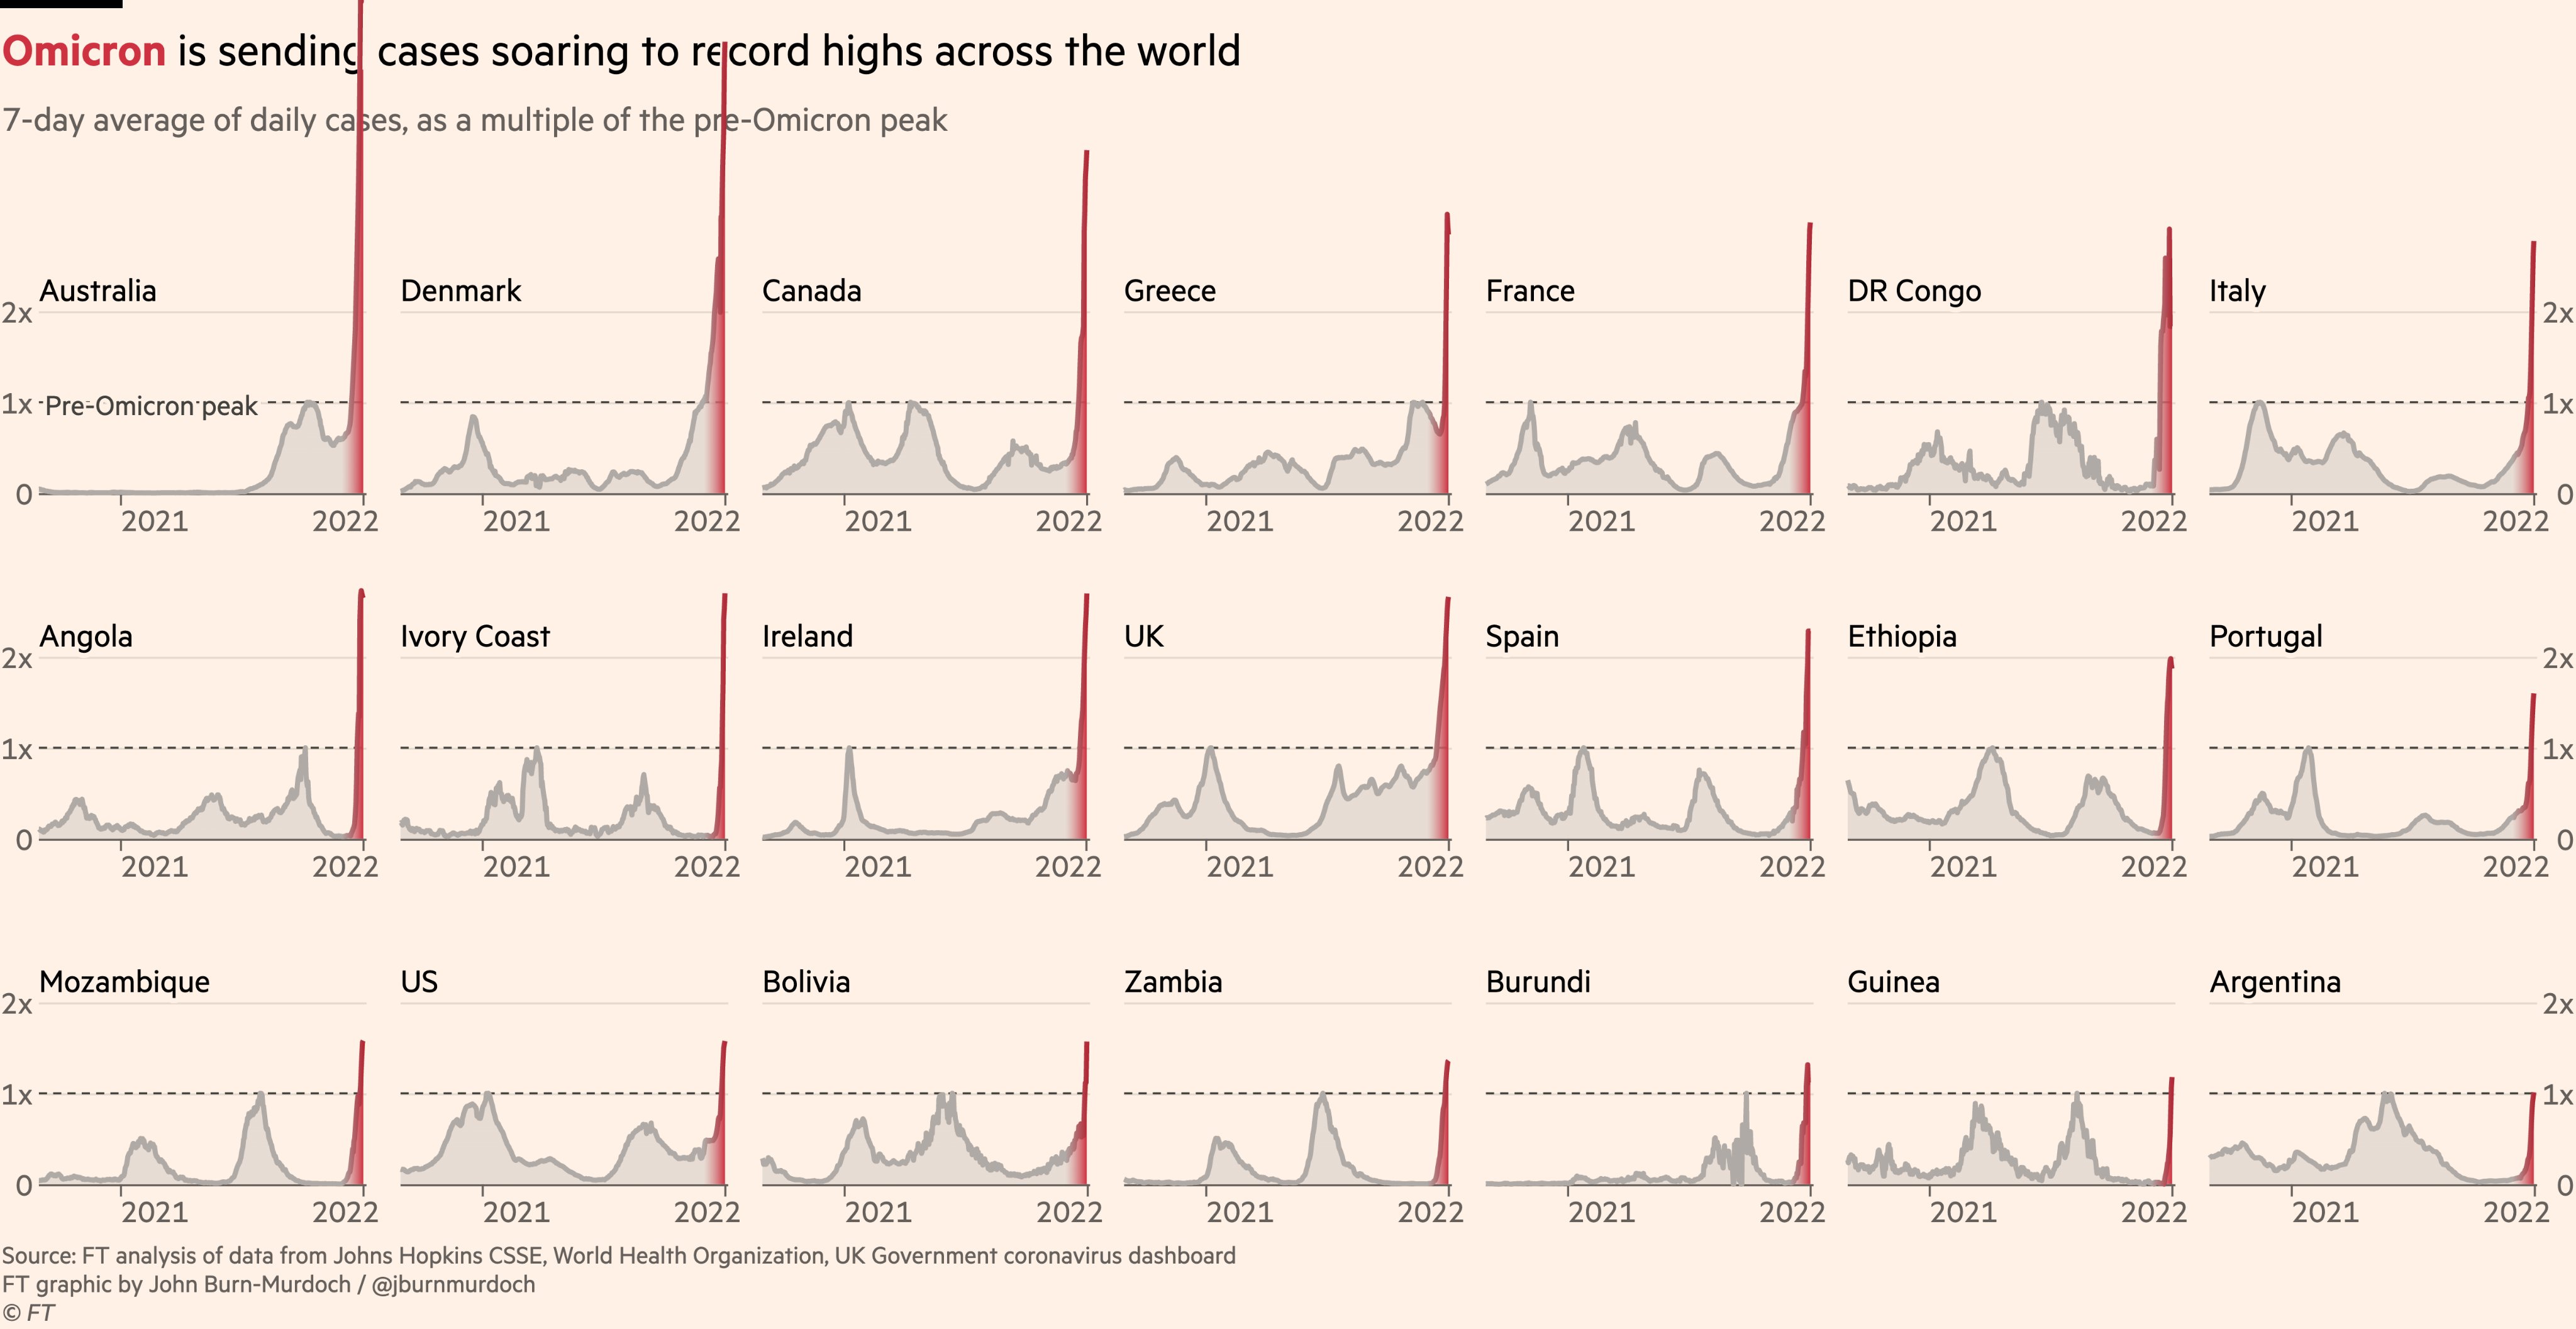
Source: twitter.com/jburnmurdoch/status/1478339853930618885