Home icon
Data Visualisation Guide

Combining with other media: layout

1 minute read

Combining with other media

Sometimes the shape a visualisation takes makes it suitable to be integrated into the layout of an article.

Here is an example by The Washington Post. The shape of the bar chart is “wrapped around” the article itself instead of being embedded in it.

A bar chart integrated into the top of an article on washingtonpost.com. The highest value on the bar chart runs next to the text of the article for several paragraphs

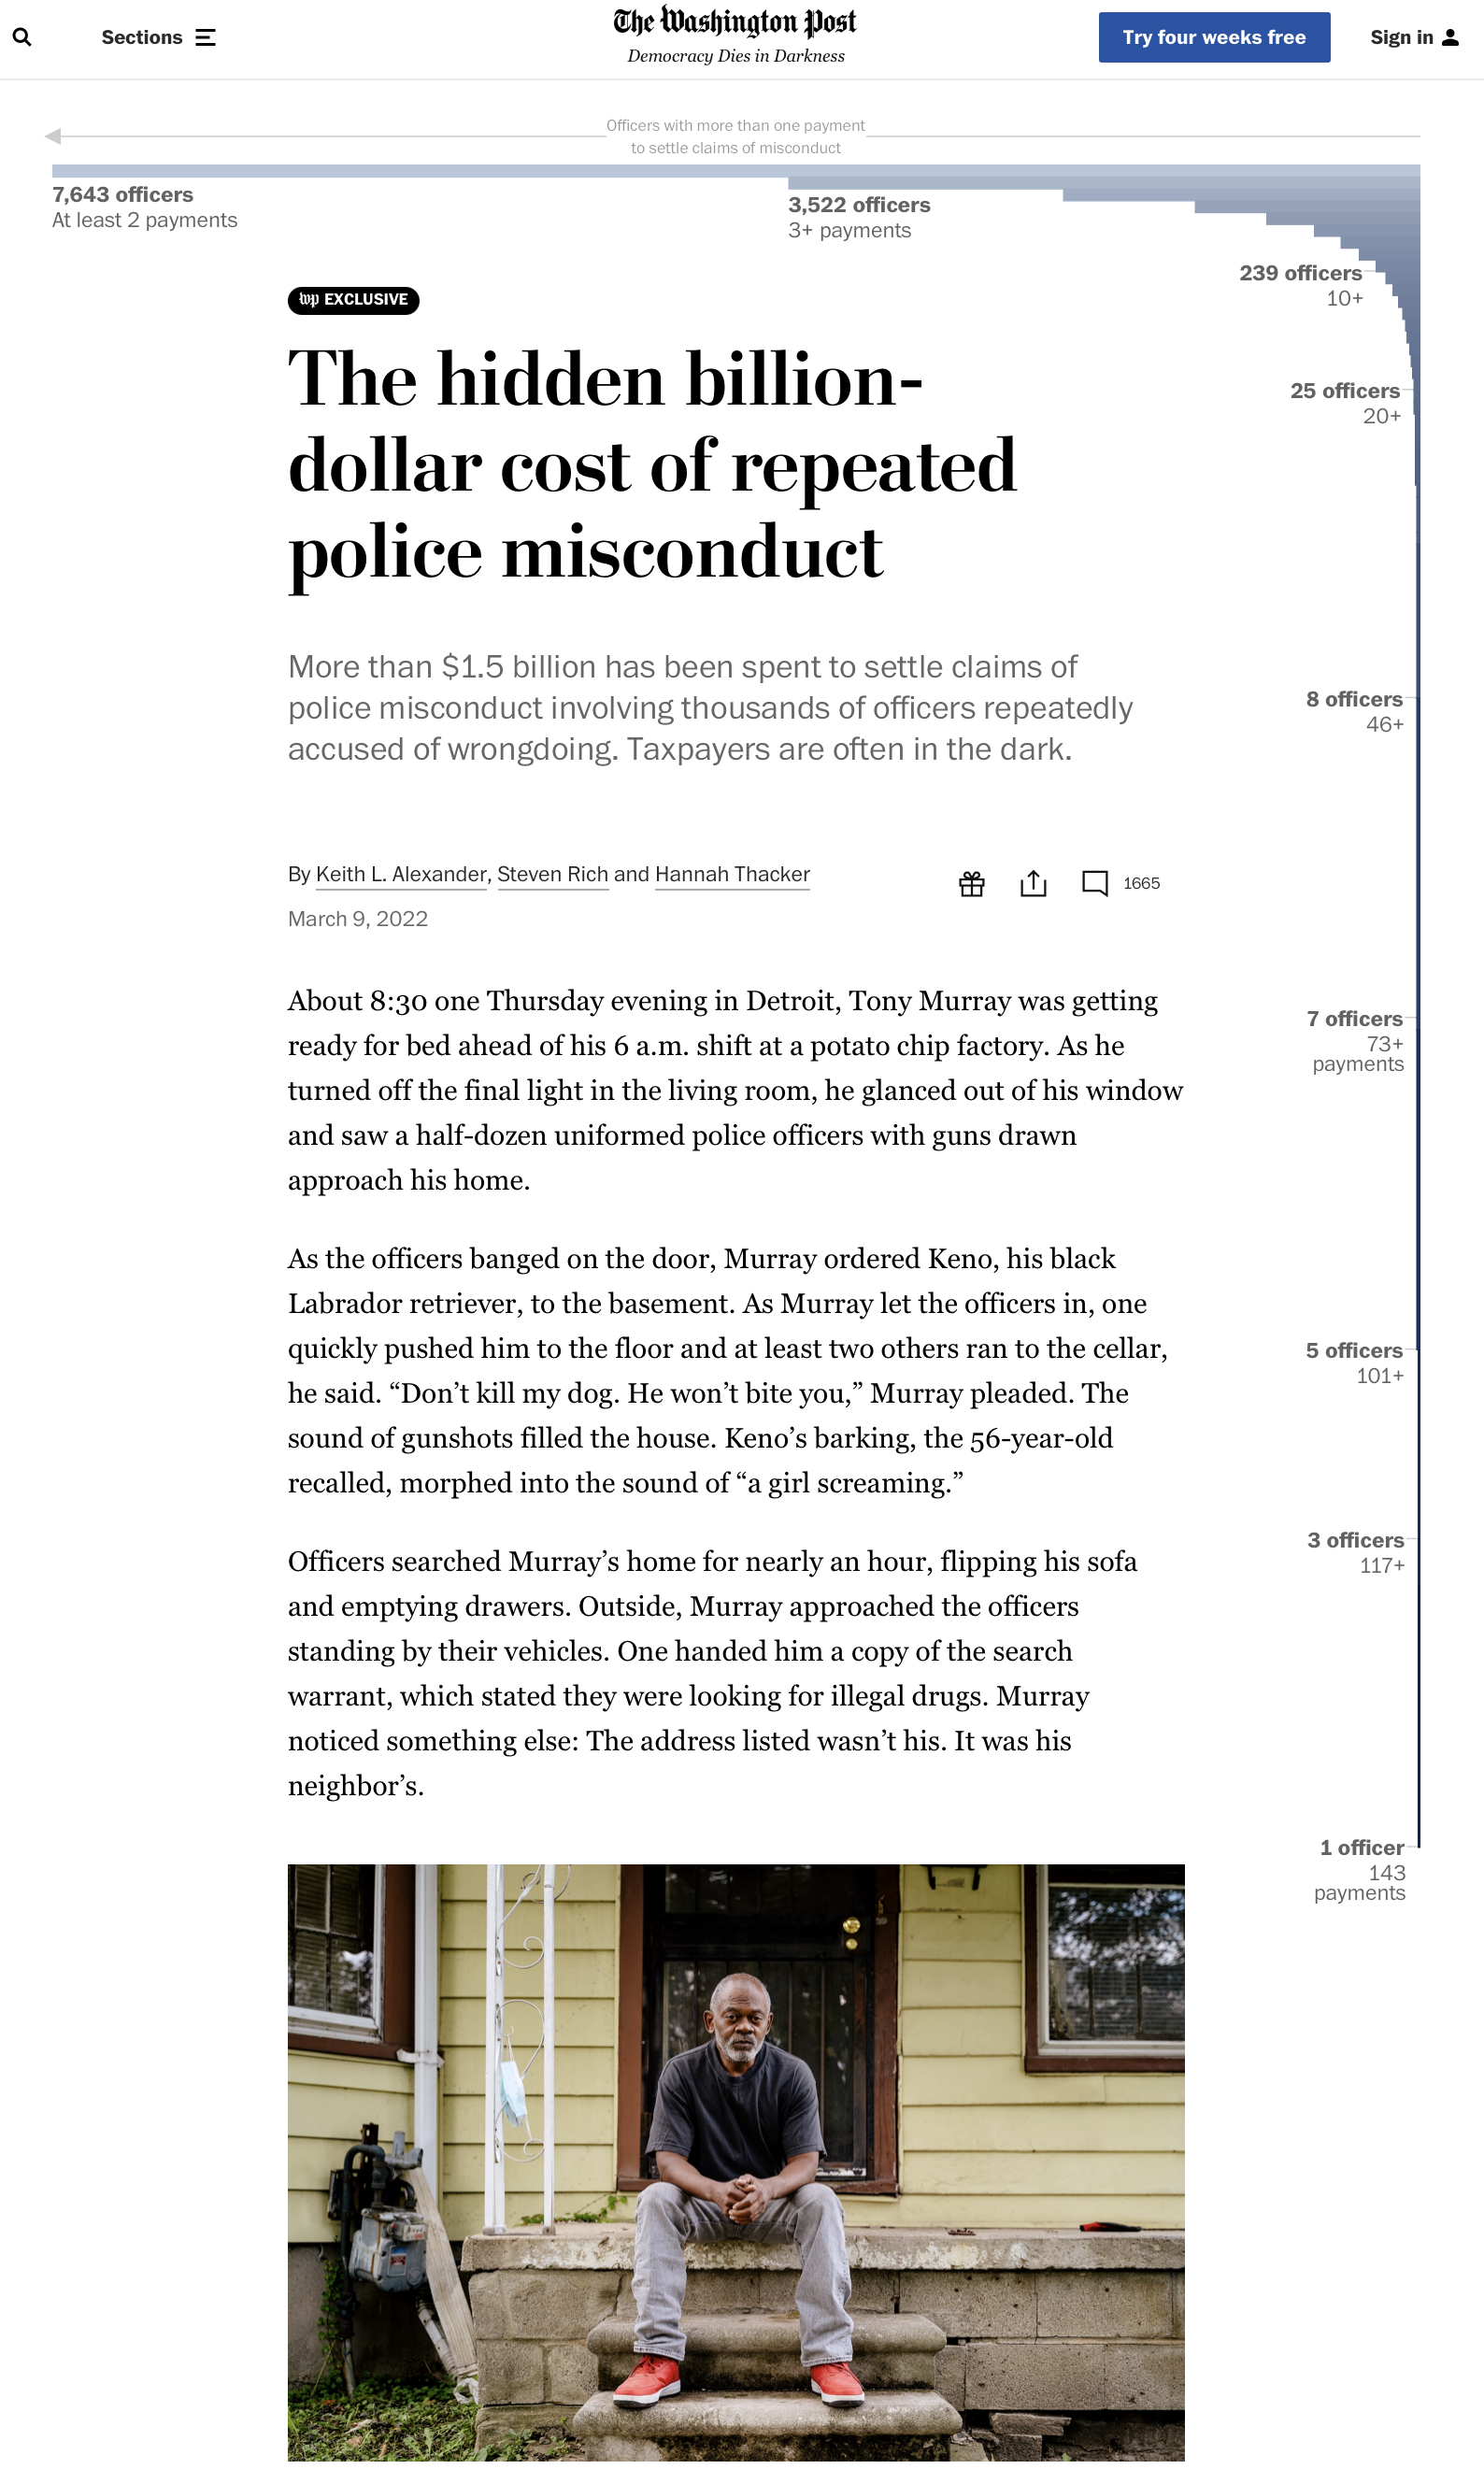
Source: The hidden billion-dollar cost of repeated police misconduct, washingtonpost.com

Here is a similar approach, but this time from Les Echos and in print. The chart showing the Chinese gdp growth is “running of the page”:

A spread of newspaper Le Monde, with a line chart running over the text and onto the next page

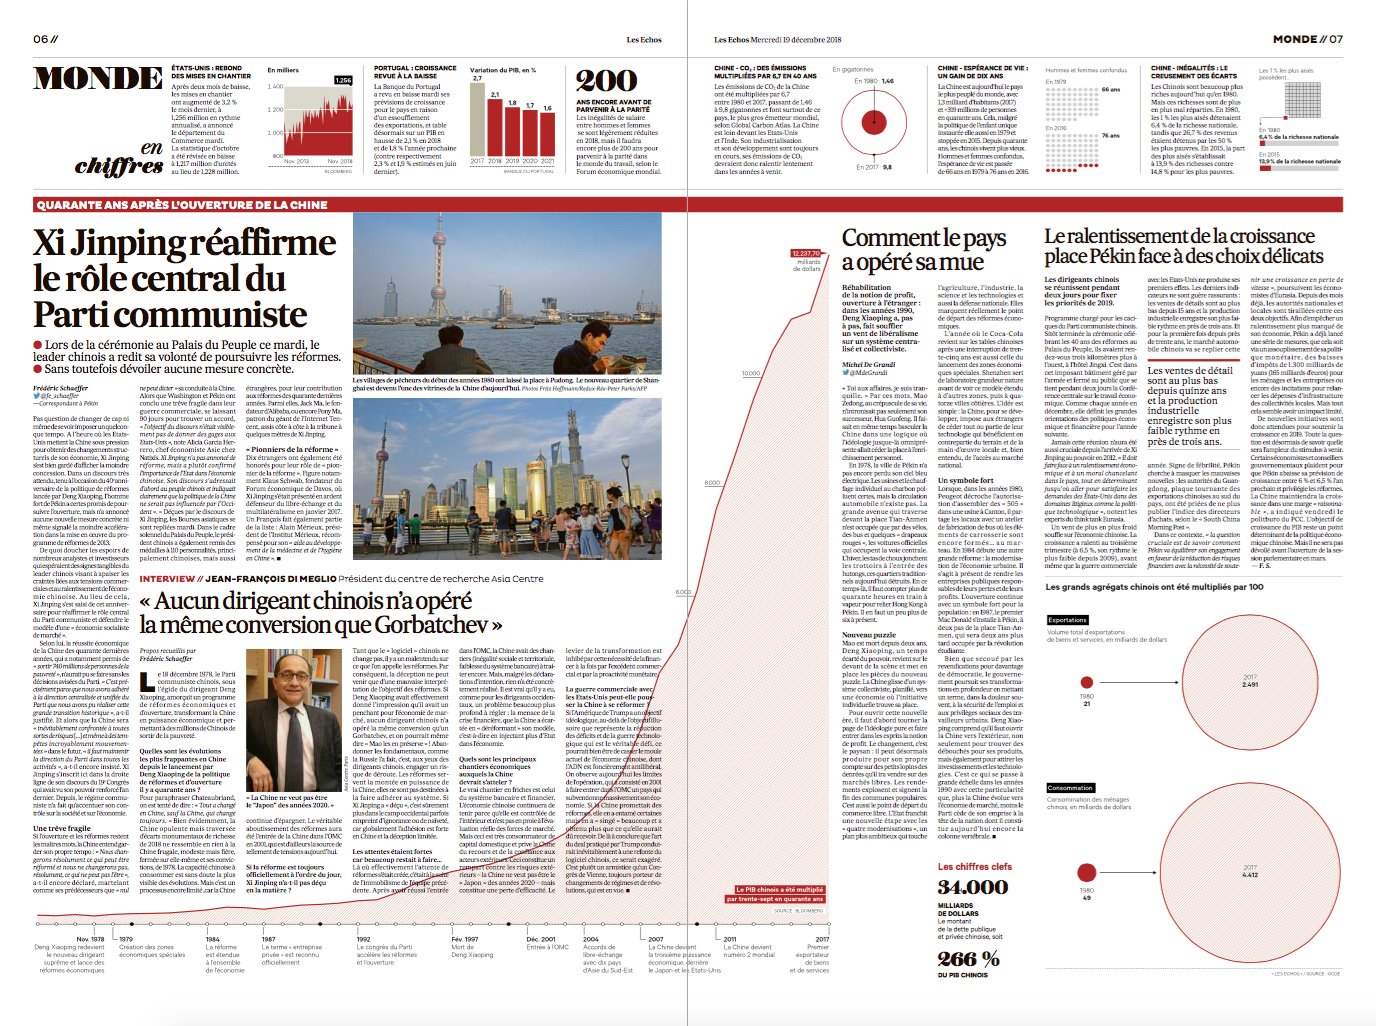
Source: @JulesGrandin

Related pages

Chart anatomy

Arrangement and reading direction

Combining with other media: drawings and illustrations

Combining with other media: data comics

Annotated chart narrative visualisation

Combining with other media: photoviz

Combining with other media