Home icon
Data Visualisation Guide

Combining with other media: data comics

1 minute read

Combining with other media

Trying to tell a story with data visualisation is similar to how comic strips use sequences of frames to tell a story. Researchers noted this and started to study the field of data comics, which combines both fields. Below you can find some examples.

A spread of the data comic 'Open borders'

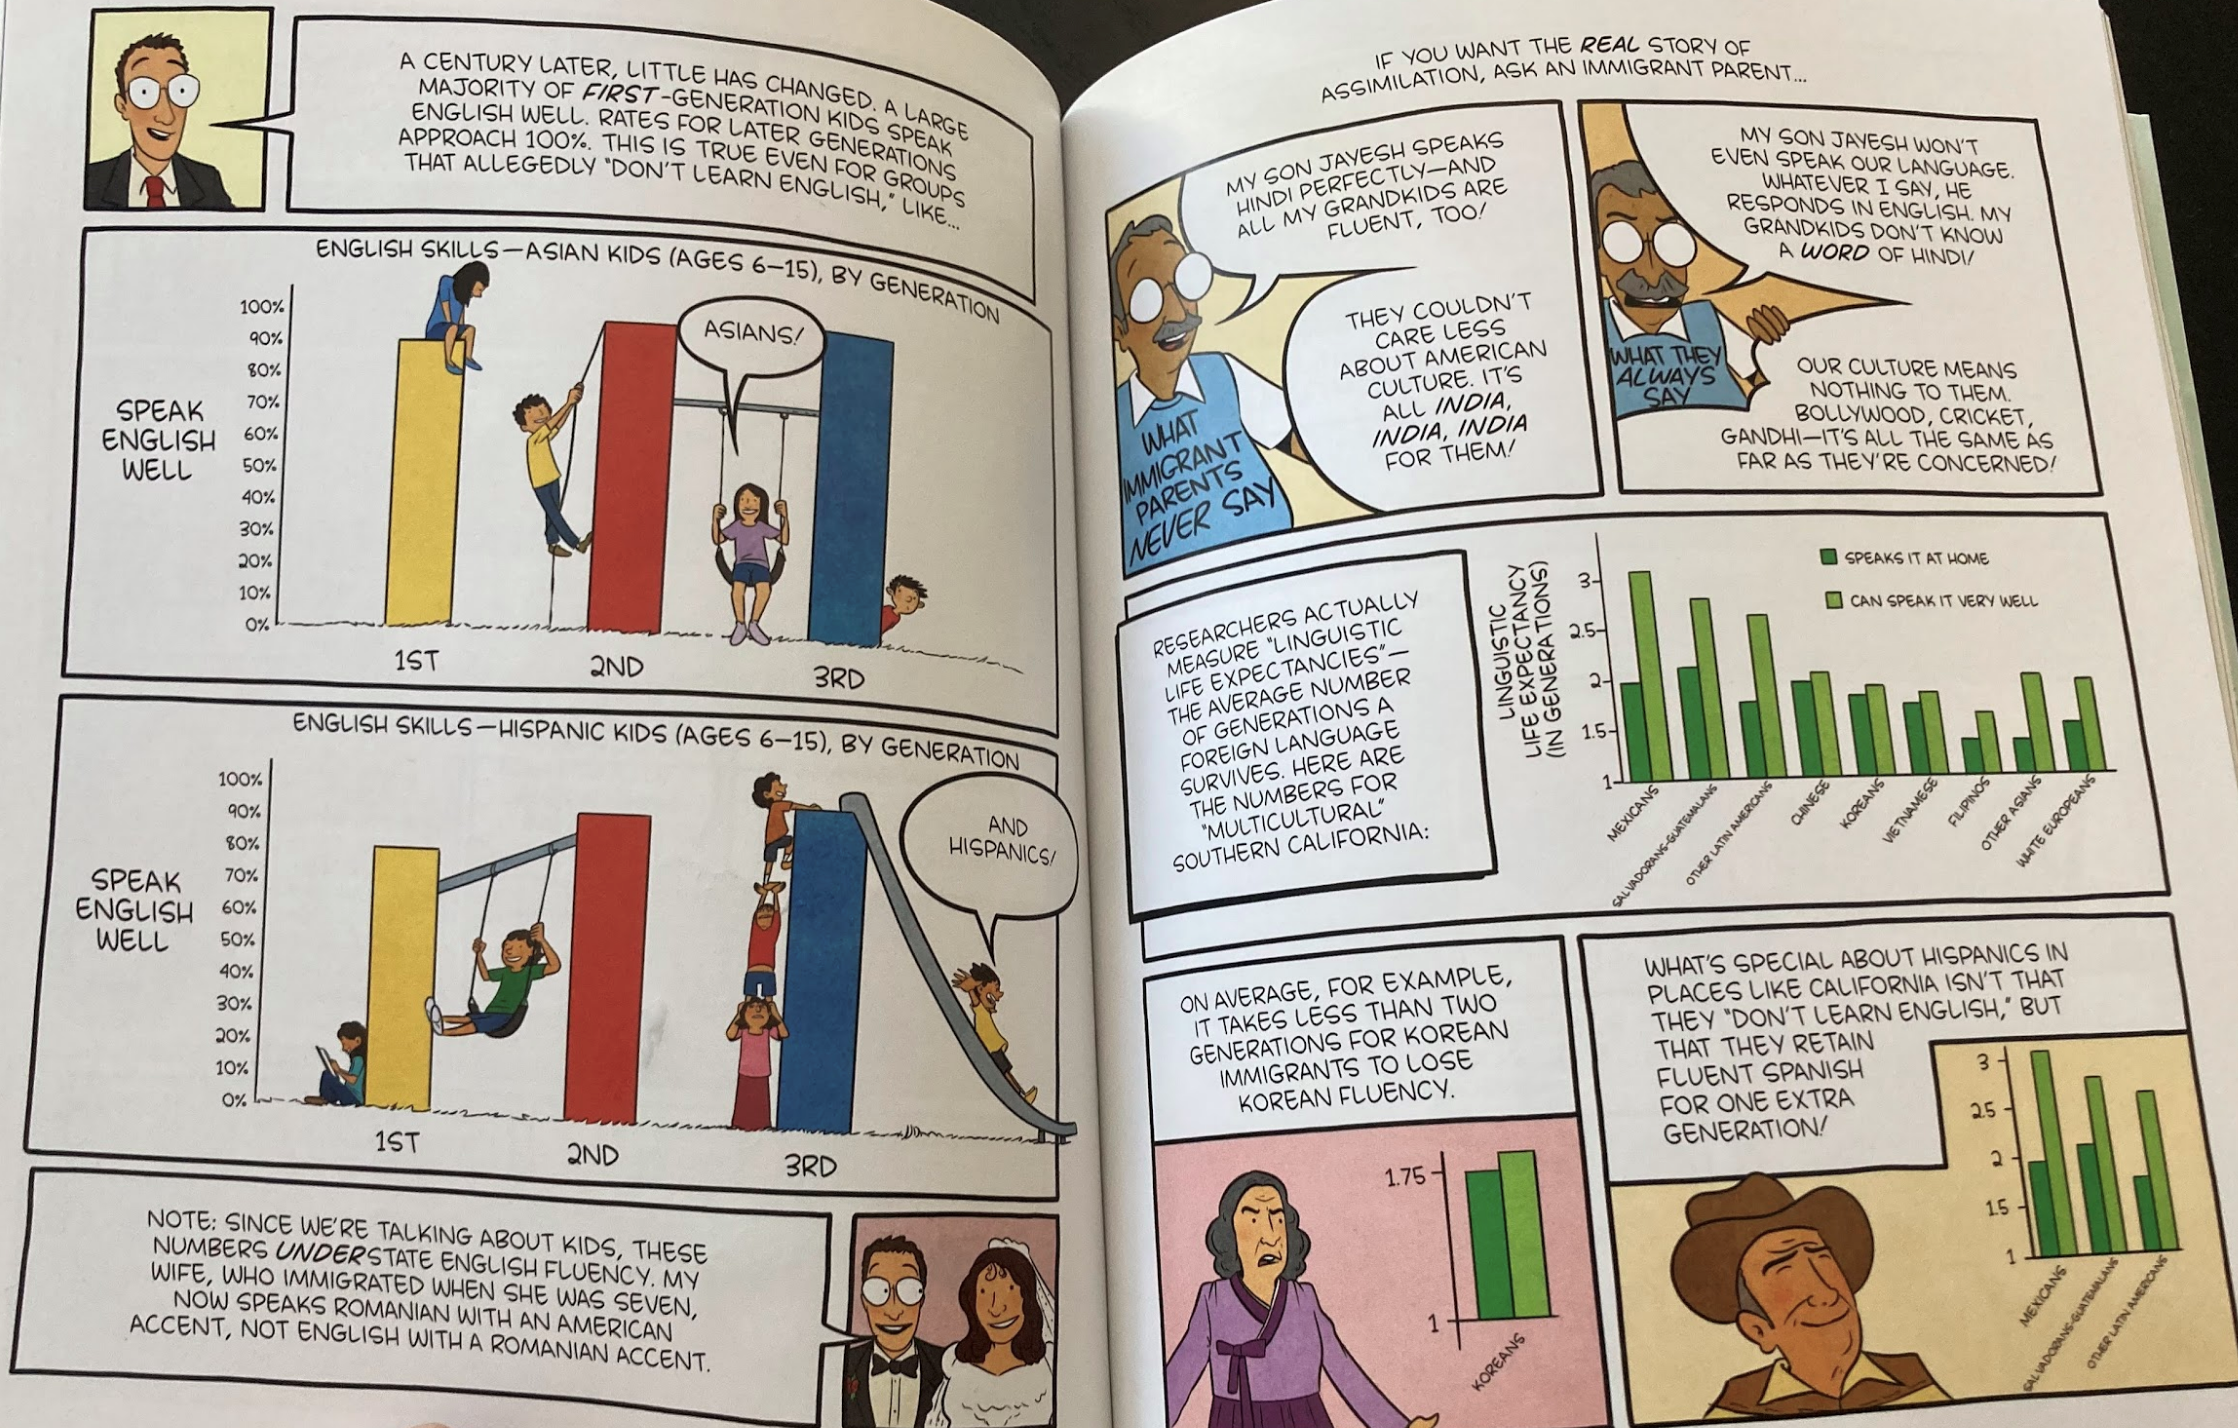
Source: Open borders : the science and ethics of immigration, Bryn Caplan and Zach Weinersmith

A data comic by XKCD titled 'How big a change is that?'

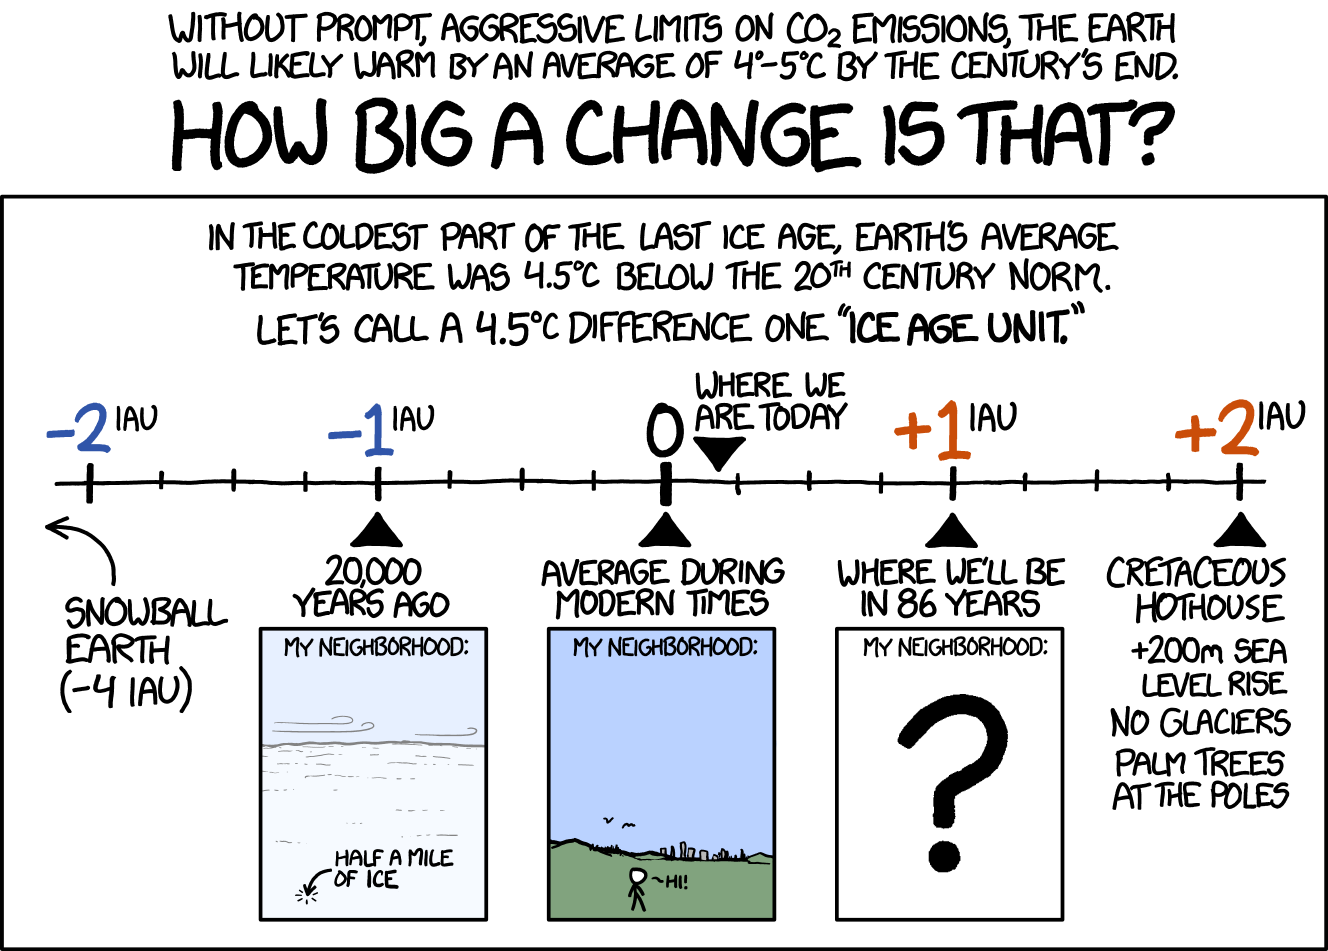
Source: xkcd.com/1379

A data comic showing the time use of an average American titled 'A day in the life of Americans'

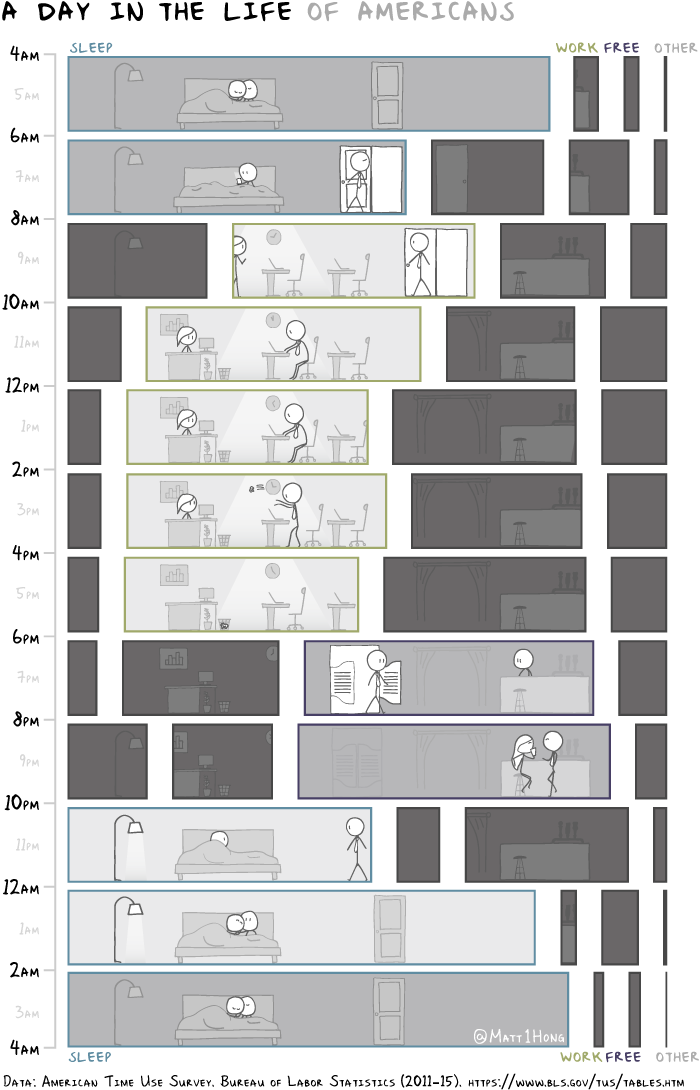
Source: A day in the life of Americans: a data comic, Matt Hong

A data comic about trends in productivity and wages data

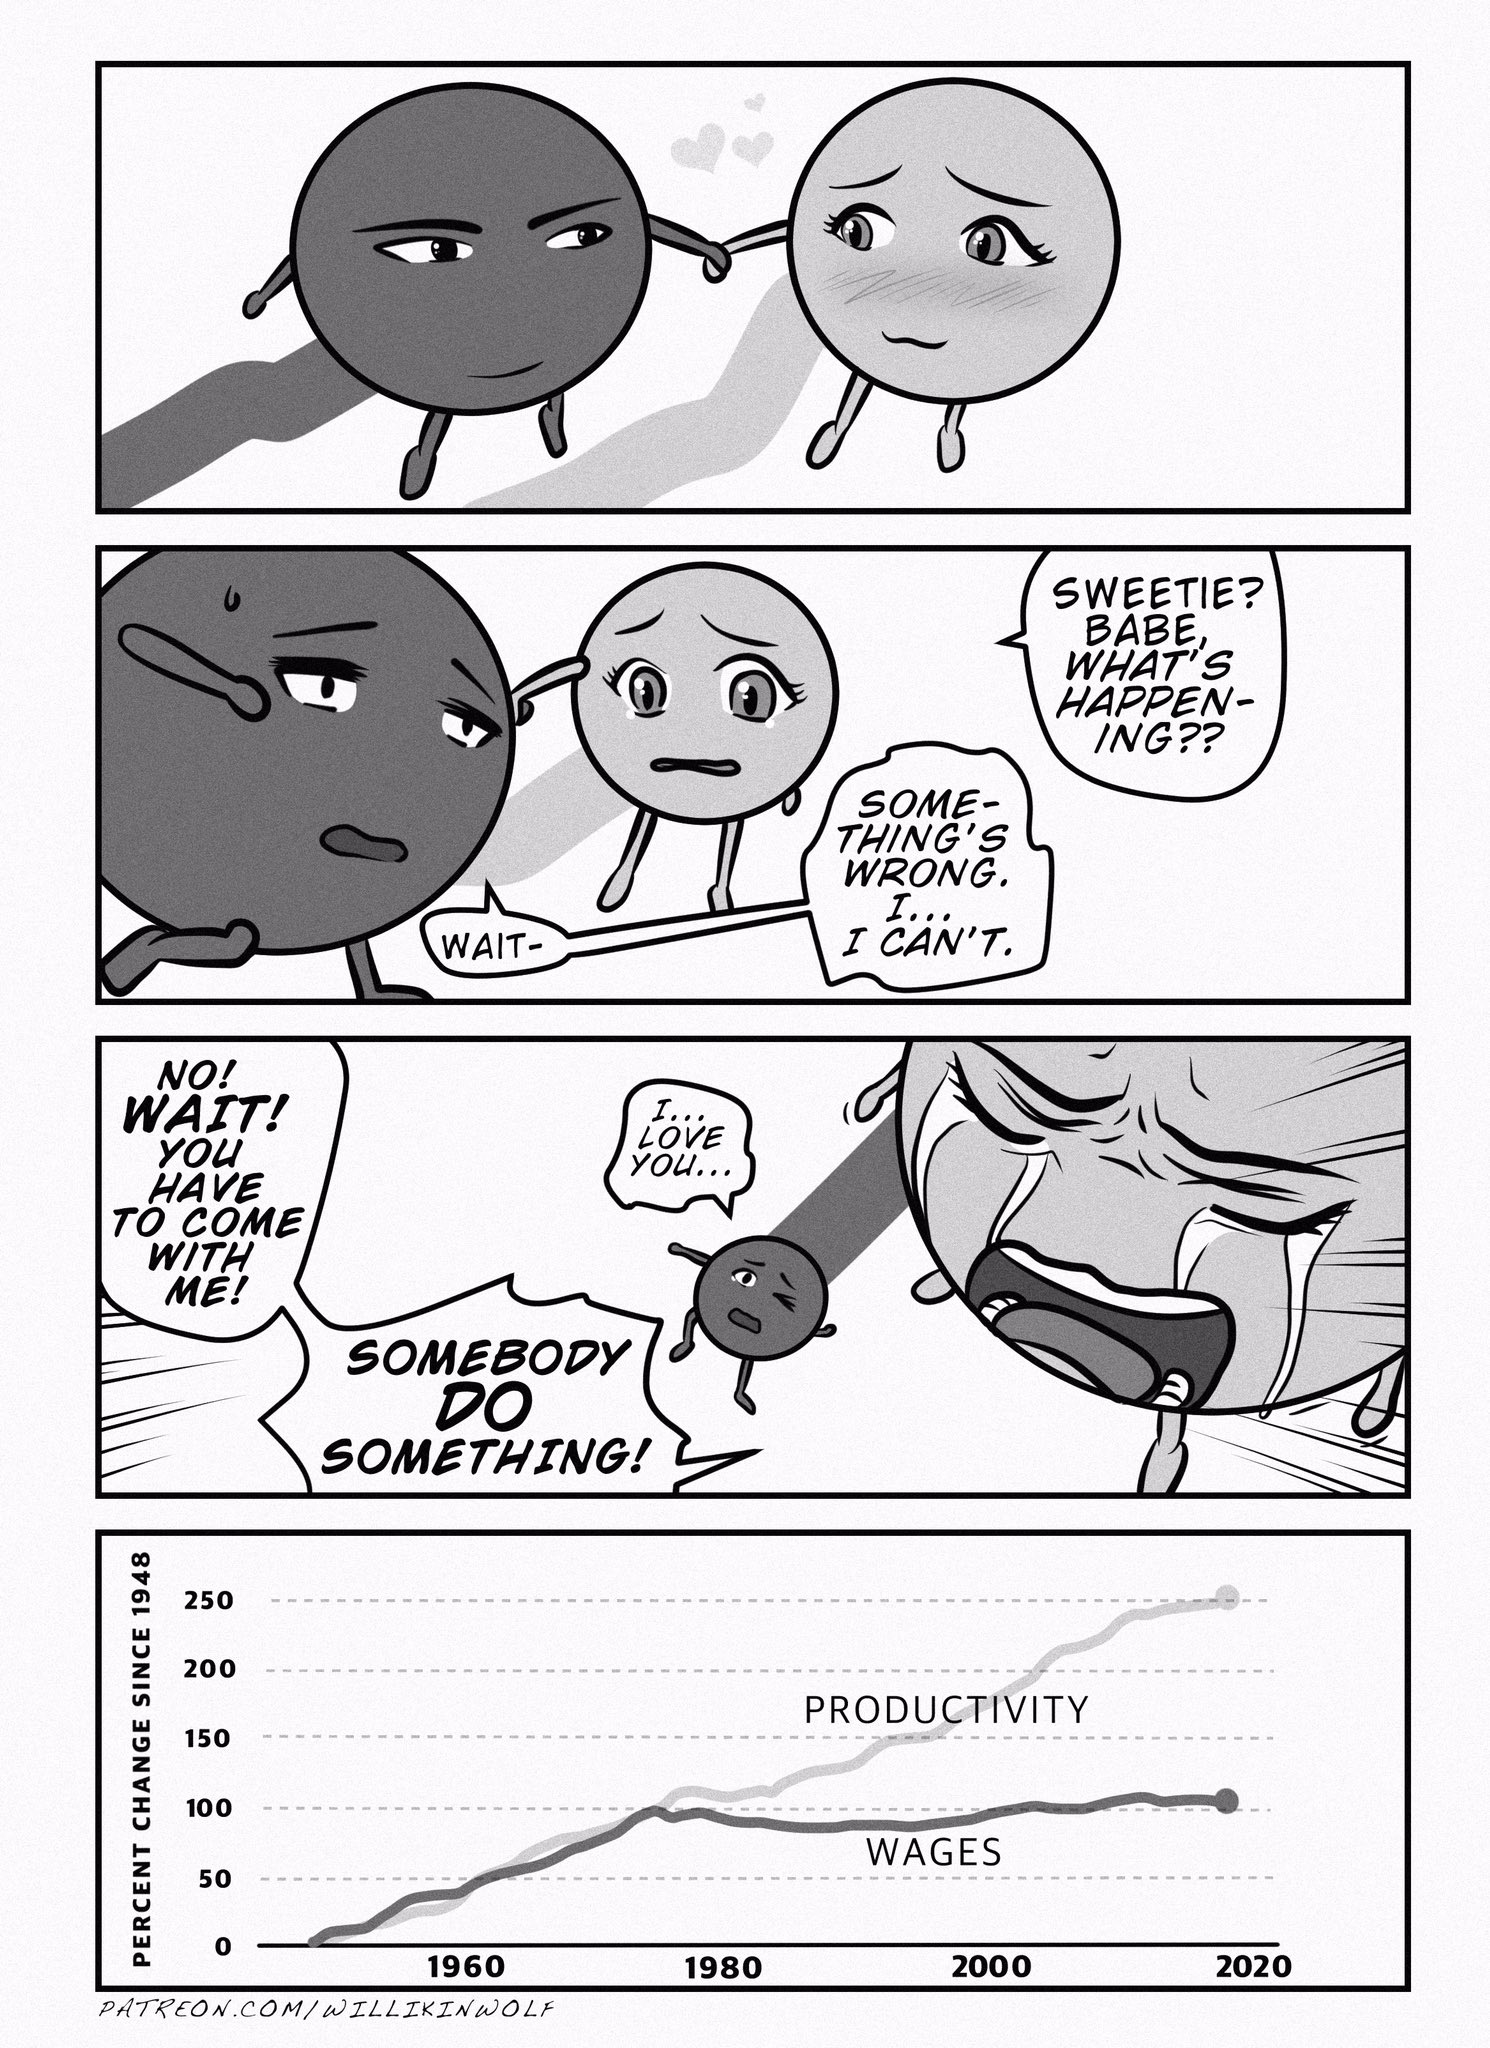
Source: @WillikinWolf

Related pages

Annotated chart narrative visualisation

Comic strip narrative visualisation

Combining with other media: photoviz

Combining with other media: sound

Combining with other media: video

Combining with other media: drawings and illustrations

Combining with other media