As with any other visualisation tool, making a visualisation with the Grammar of Graphics start with the data. The input data for a visualisation is almost always tabular data, with rows representing the records and columns representing the dimensions (also sometimes called measures, or fields) for each record. In the language of tidy data (see Intro to tidy data), rows are called observations, and columns are variables.
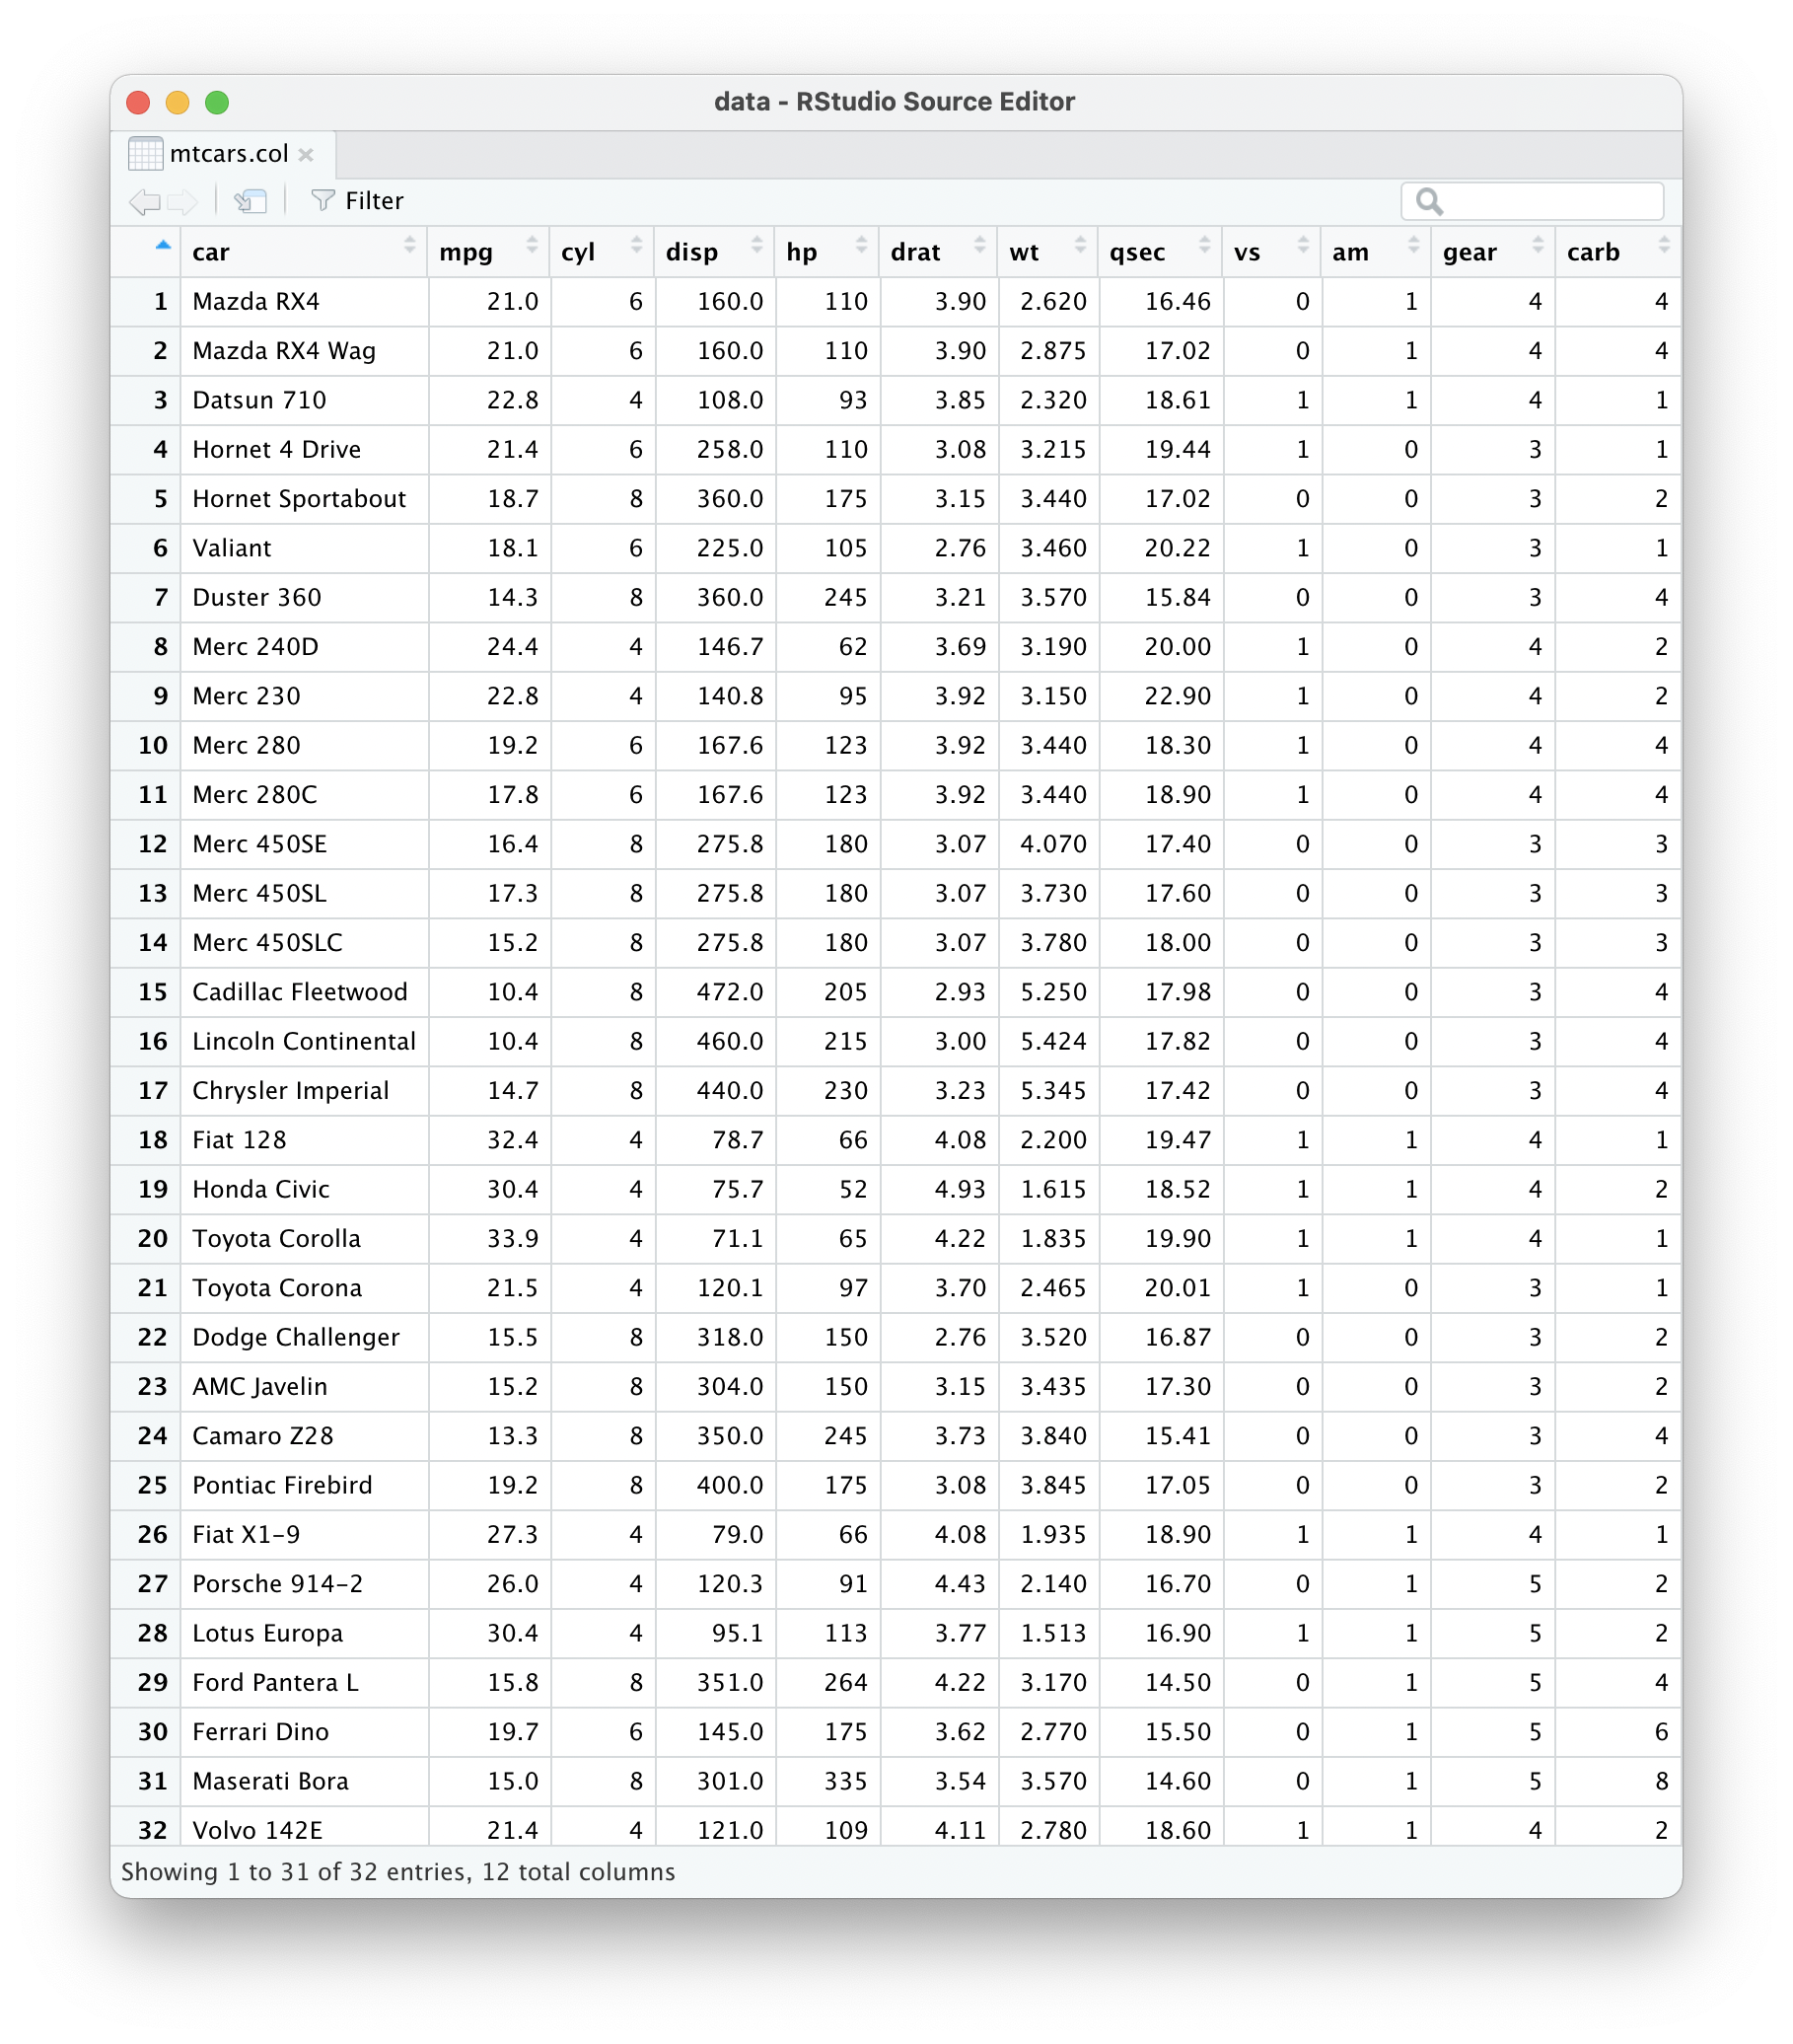
Example of a data table, with each row representing a type of car and each column representing a variable measured on each car. Source: Maarten Lambrechts, CC BY SY 4.0
Most tools have functionality to load data from different sources and with different file formats, and to convert data into the format required for producing visualisations.
Variables can be of different types: they can be integers, continuous numerical values, categorical values and date/time stamps. The type of variable determines how it can be mapped to the aesthetics of geometrical objects. For example, it is not meaningful to use a categorical variable to the height of a bar, or using a continuous numerical variable to encode the shape of symbols.
Because of this, you need to make sure the tool you are using recognises the type of each variable in the data and parses its values correctly. If not, errors will be generated, or the visualisation process will lead to unexpected results.