Scales control the way dimensions in the data are mapped to aesthetics of geometric attributes. For example, when a categorical dimension is mapped to the colour aesthetic, the scale will determine which colour is mapped to which category in the data.
The scale for the x axis can can be used to set the minimum and maximum values of the axis, the direction of the axis and the tick values that should be displayed on the axis.
The type of scale is determined by the type of the data that is mapped onto it. When a categorical dimension is mapped to the x or y aesthetic, the scale for the mapping will be a discrete scale, with even spaces for each of the values in the categorical dimension. When a date or time dimension is mapped to the x aesthetic, the resulting scale will be a time scale. Different types of scales have different configuration properties. A time scale, for example, will have settings for the formatting of the dates displayed on the axis.
Scales can also be used to apply a transformation on the data without using an explicit transformation. An example of this are logarithmic scales, which in contrast to regular linear scales, apply a logarithmic transformation on the data before they are plotted.
Every mapping of data to an aesthetic property requires a scale. But in all tools based on the Grammar of Graphics, default scales with sensible settings are applied. This means that you don’t need to explicitly add a scale (and configure it) for every aesthetic mapping. You only need to do so when you want to override the configuration of the default scale that the tools provides you with.
Guides
Guides are elements in the plot that help readers read values from a plot. For position scales (x and y), guides are axes. For other scales, guides are legends.
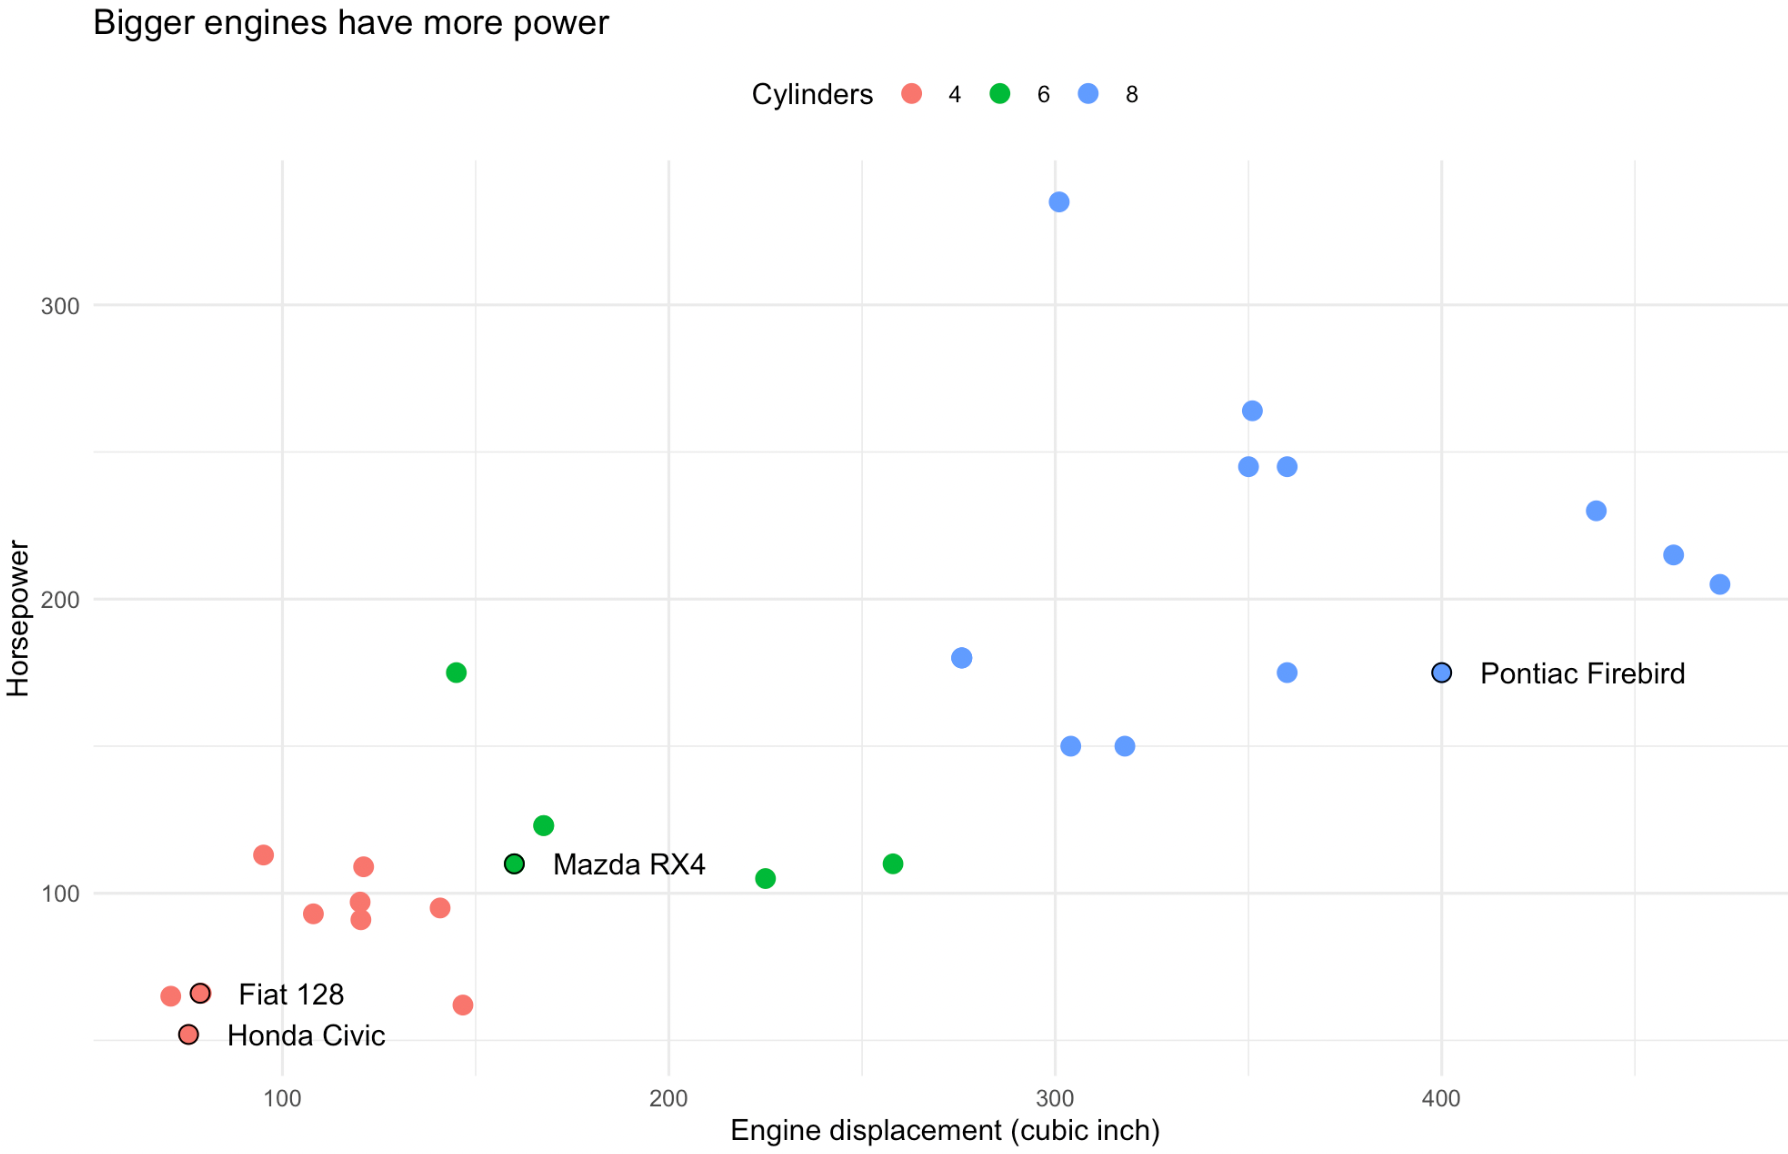
This scatter plot has 3 guides: an x axis, a y axis and a colour legend. Source: Maarten Lambrechts, CC BY SA 4.0