Aesthetics are the visual properties of geometries that are used to encode dimensions in the data. The aesthetics of a geometry are tied to the type of the geometry: for example, a point geometry can have position, size, shape and colour aesthetics. A rectangle, on the other hand, can have position, width, height and colour aesthetics. So not all aesthetics are available for all geometries.
For some geometries, alternative sets of aesthetics can be available. For example, instead of having x, y, width and height aesthetics, rectangles could have 4 aesthetics for each of their 4 corners, for example.
Some of the more common aesthetics, shared by many geometries, are:
x: the x position of a geometryy: the y position of a geometrysize: the size of point geometries, or the thickness of line geometriescolour: the colour of point geometries, the colour of the stroke of line geometries, or the fill colour of 2-dimensional geometriesopacity: the transparency of the geometry. This is sometimes also called alpha aesthetic.
Some geometries have very specific aesthetics. For point geometries, categorical variables in the data can be mapped to the shape of the geometry.
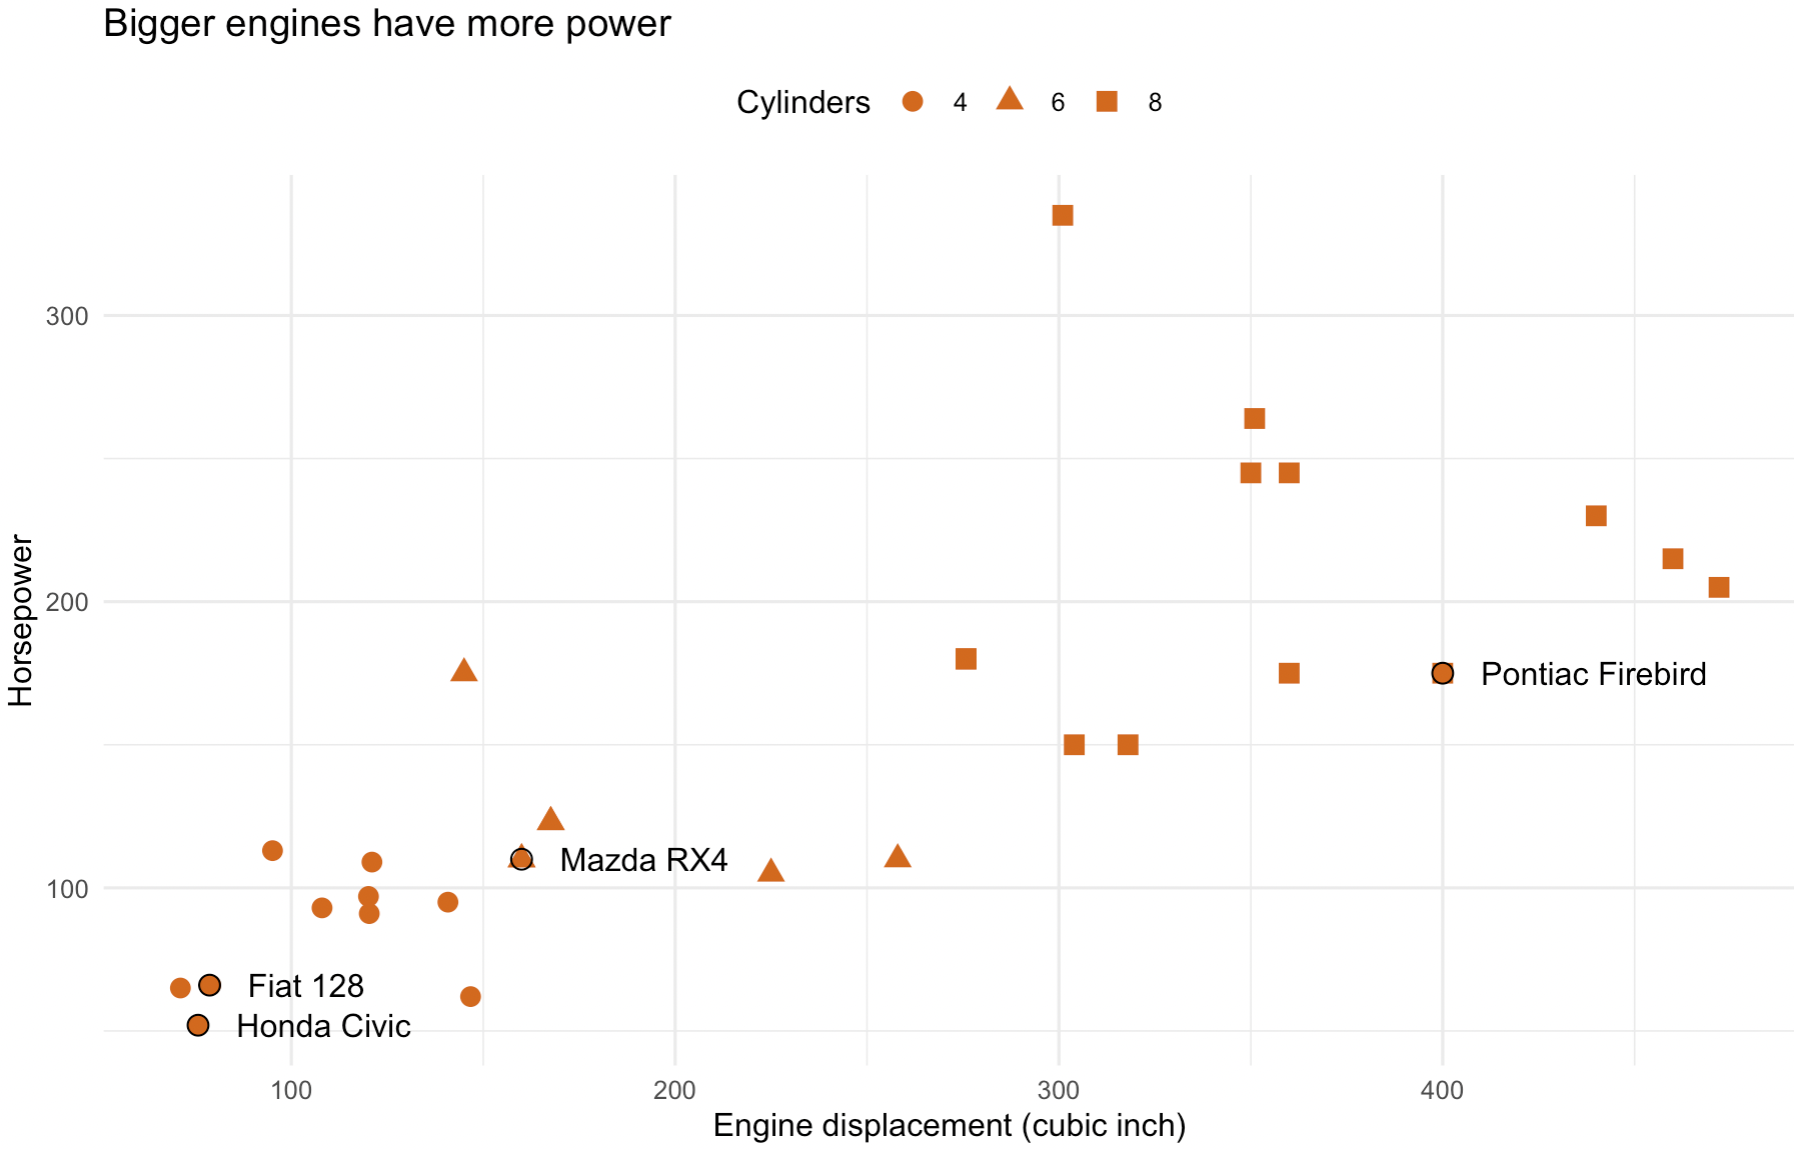
Instead of mapping the cylinder variable to colour, it is mapped the shape aesthetic. Source: Maarten Lambrechts, CC BY SA 4.0
Text geometries have aesthetics that are unique to them, like the content of the text itself, the font size and the font family.
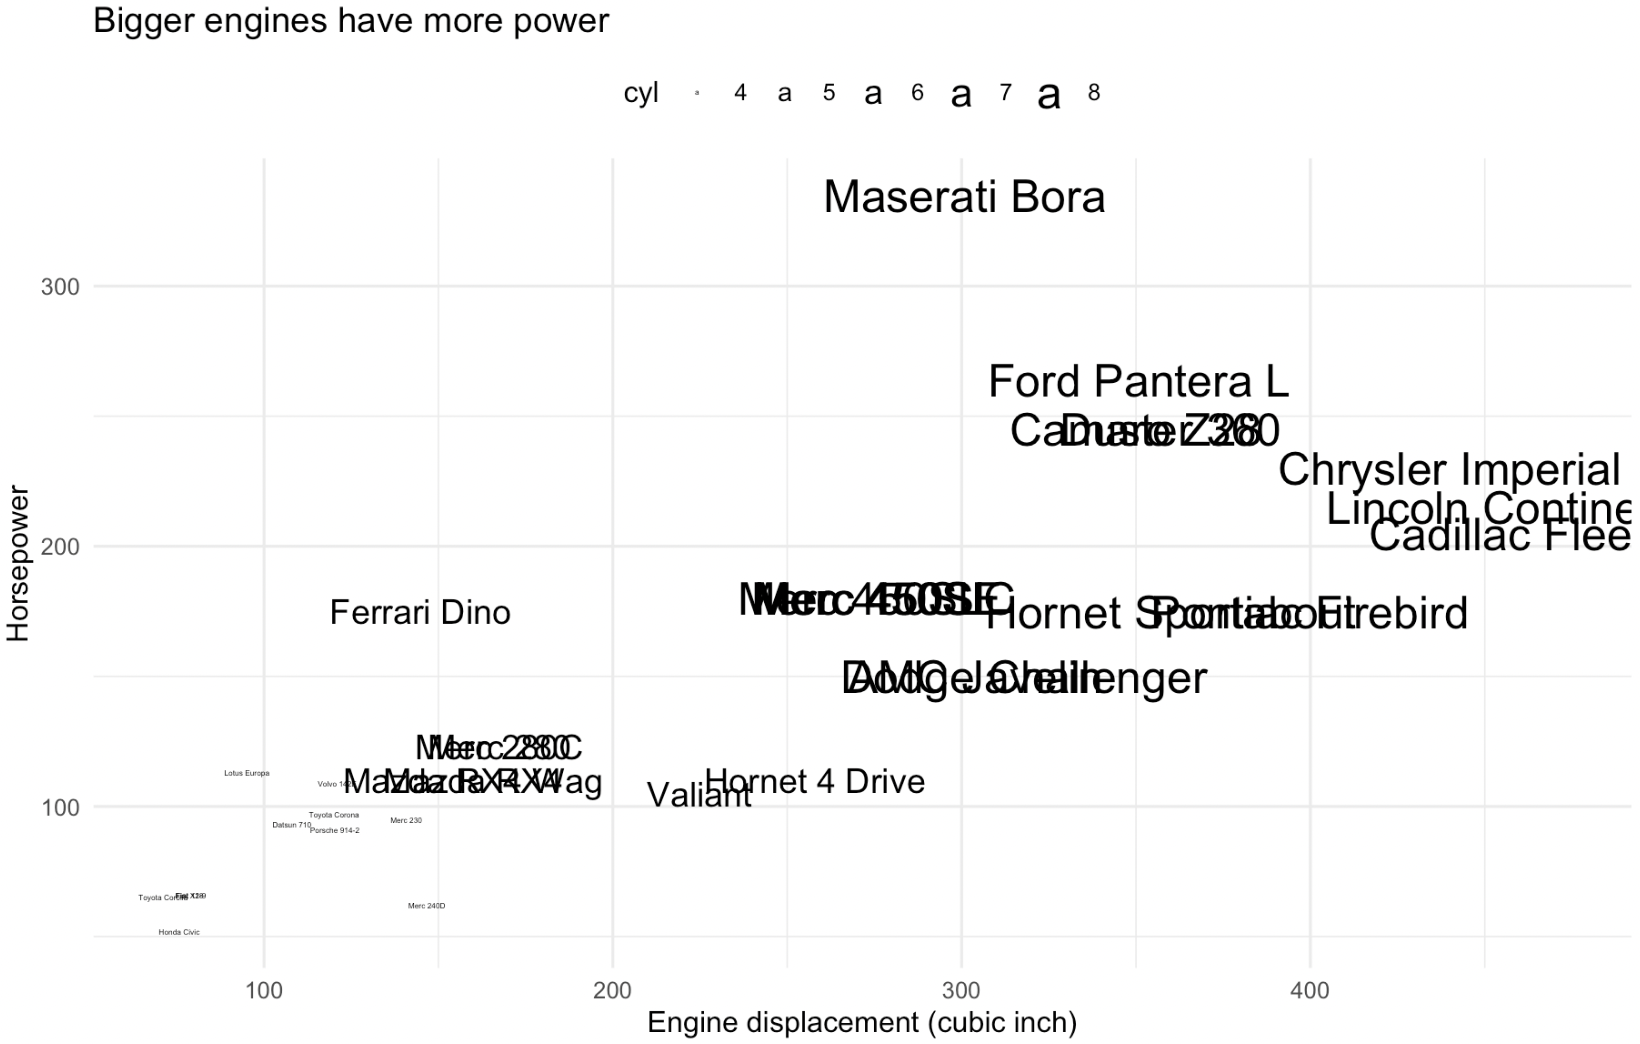
In this scatter plot, the cylinder variable is mapped to the font size aesthetic of text geometries. The text content aesthetic is mapped from the car variable in the data. Source: Maarten Lambrechts, CC BY SA 4.0
For line charts with multiple time series (multiple lines), an aesthetic needs to be provided that groups the values in each time series together. For example, in a line chart in which the lines represent different countries, the column containing the country names should be mapped to the group aesthetic (some tools use the z aesthetic for this, and alternatively mapping the country name column to the colour aesthetic can also work).
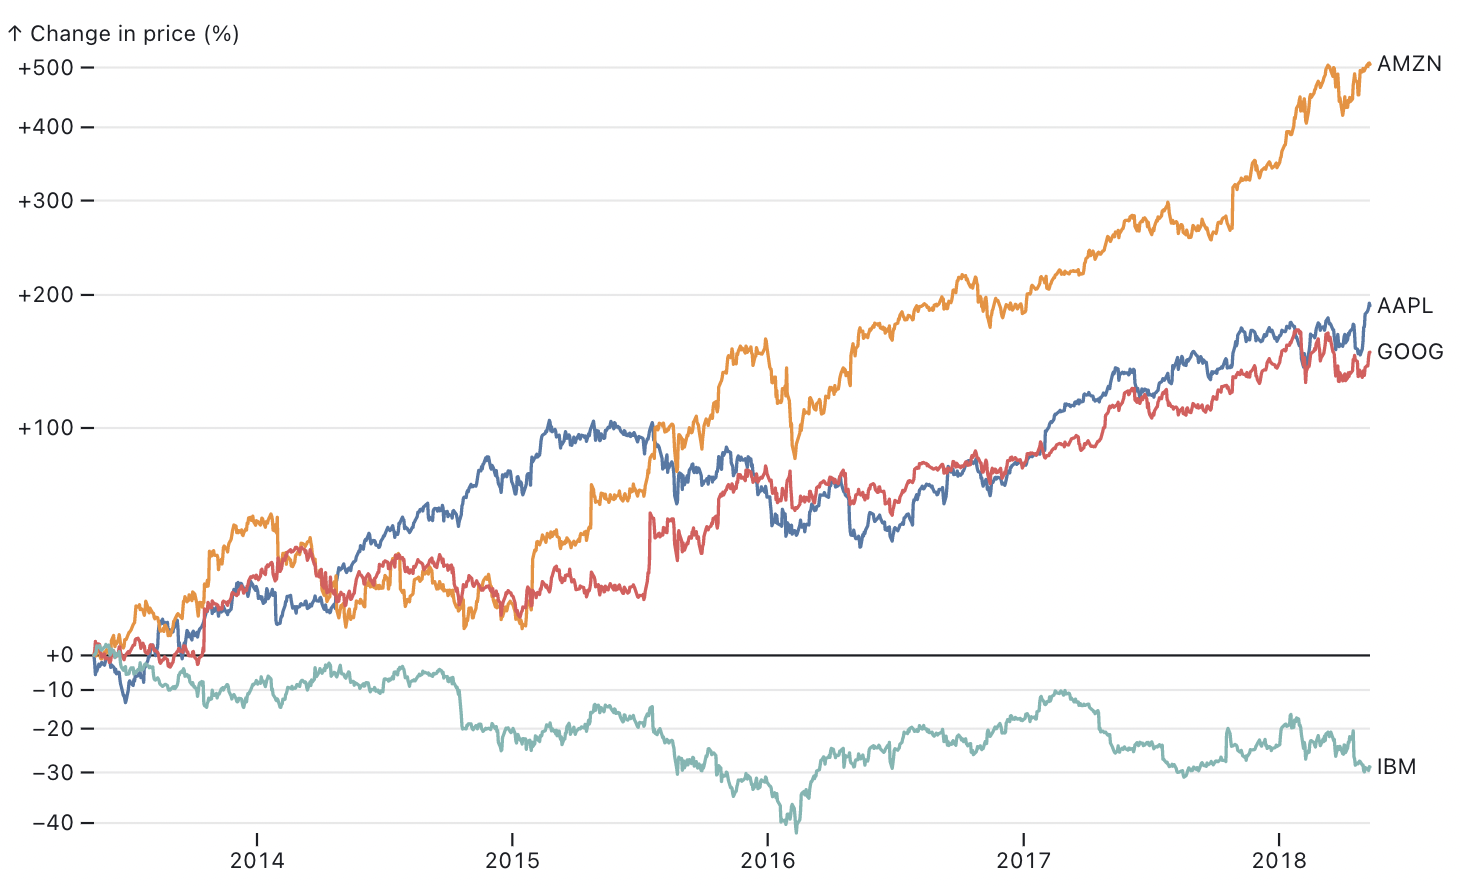
A chart showing the trend in prices for stocks of 4 companies. The stroke colour in this plot is mapped to the name of the companies, which automatically creates a separate line for each of the 4 companies. Source: observablehq.com/@observablehq/plot-line