The operable principle of accessibility deals with user interaction, and as such applies mainly to interactive data visualisation.
- Any interaction that is possible by using a mouse should also be possible using the keyboard. This means that the controls and the visualisation should be navigable with the tab and arrow keys, that focussing on an element mirrors the behaviour of hovering over the element with a mouse and that clicking on elements can be done by first focussing on an element and then pressing enter or the spacebar.
- The keyboard focus should be clearly visible. Most web browsers show the focus as a blue rectangle, but this can be overridden by designer of the web page.
- Interactive elements should be big enough to be interacted with easily with a mouse or by touch. If by the nature of the data and the chart type elements are rendered too small, an alternative presentation of the data, like a table should be presented.
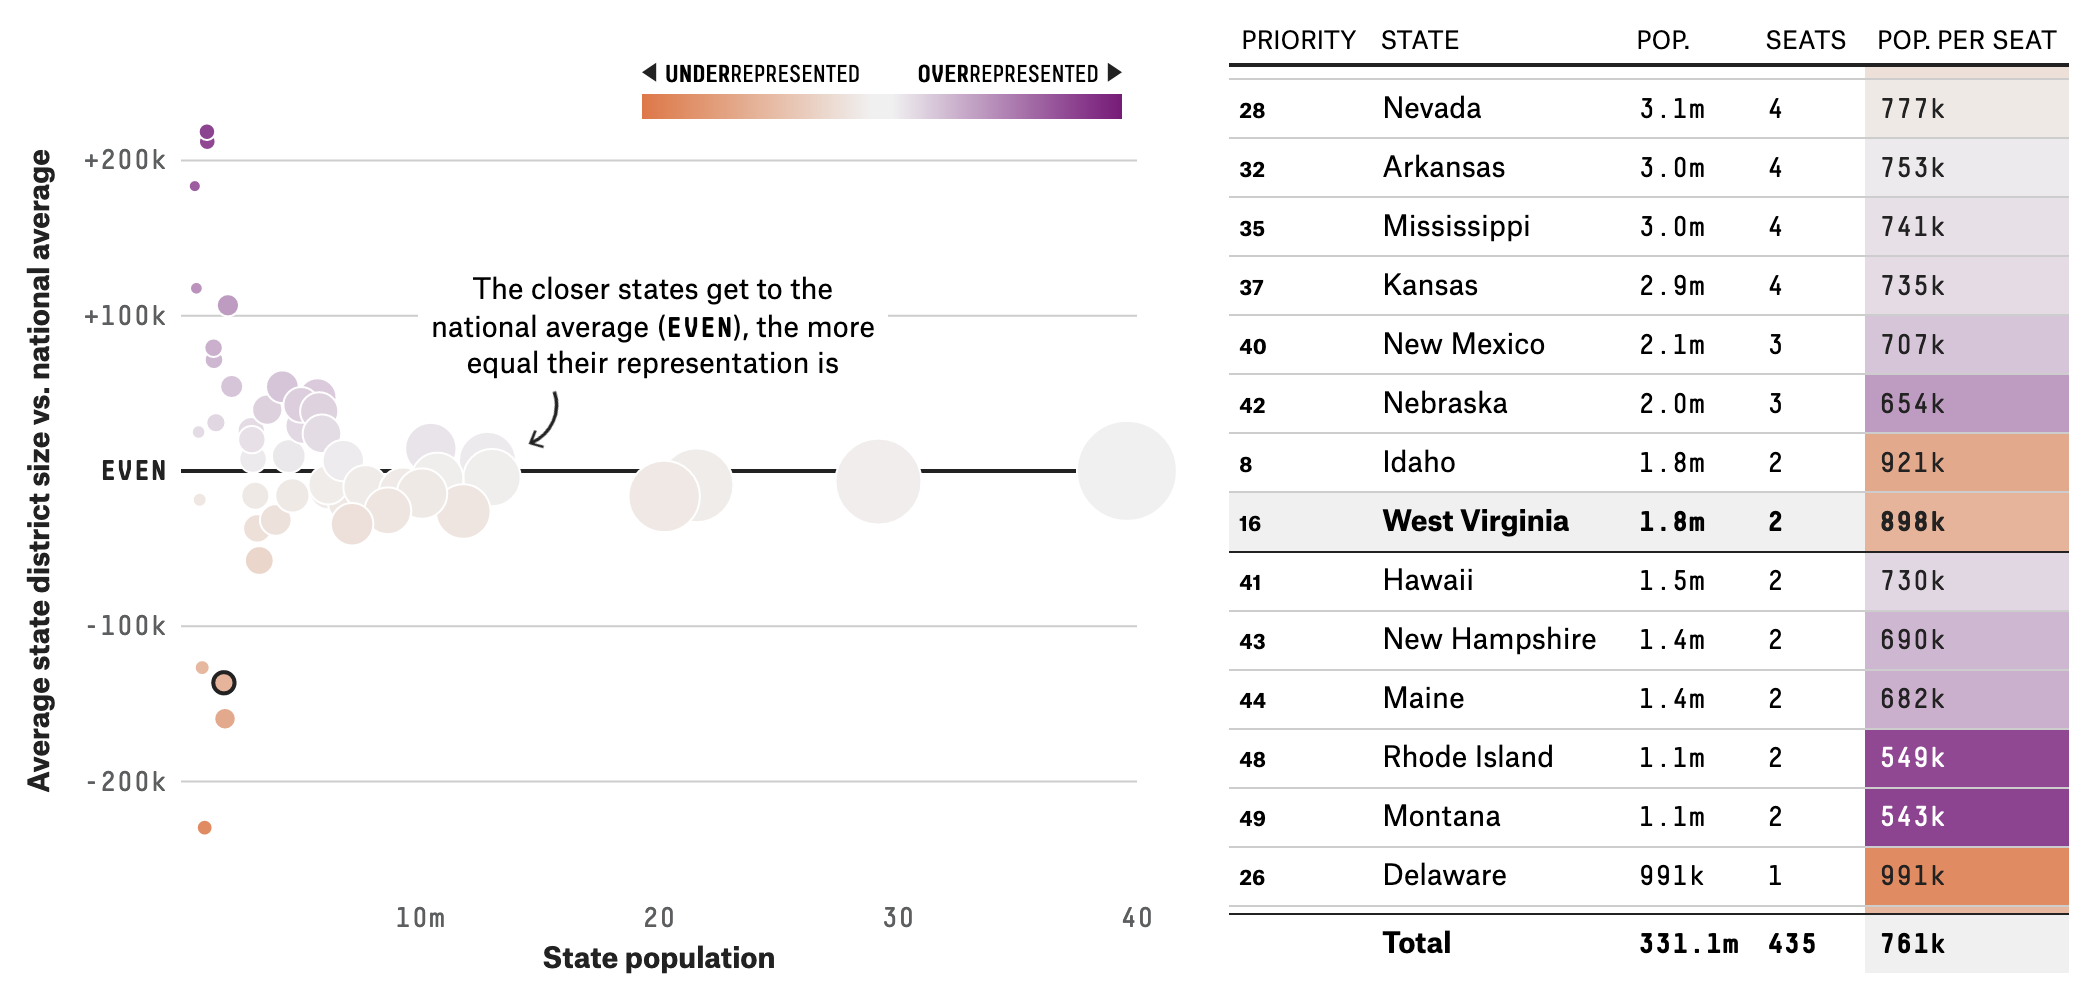
In the visualisation on the left, hovering over a dot reveals its data in the table next to it. But the interaction is two way: you can also navigate the table and hover over a row to highlight the dot in the visualisation. Source: projects.fivethirtyeight.com/435-representatives
- The interactive functionalities should be recognisable as such, and the interactivity should be explained to the user.
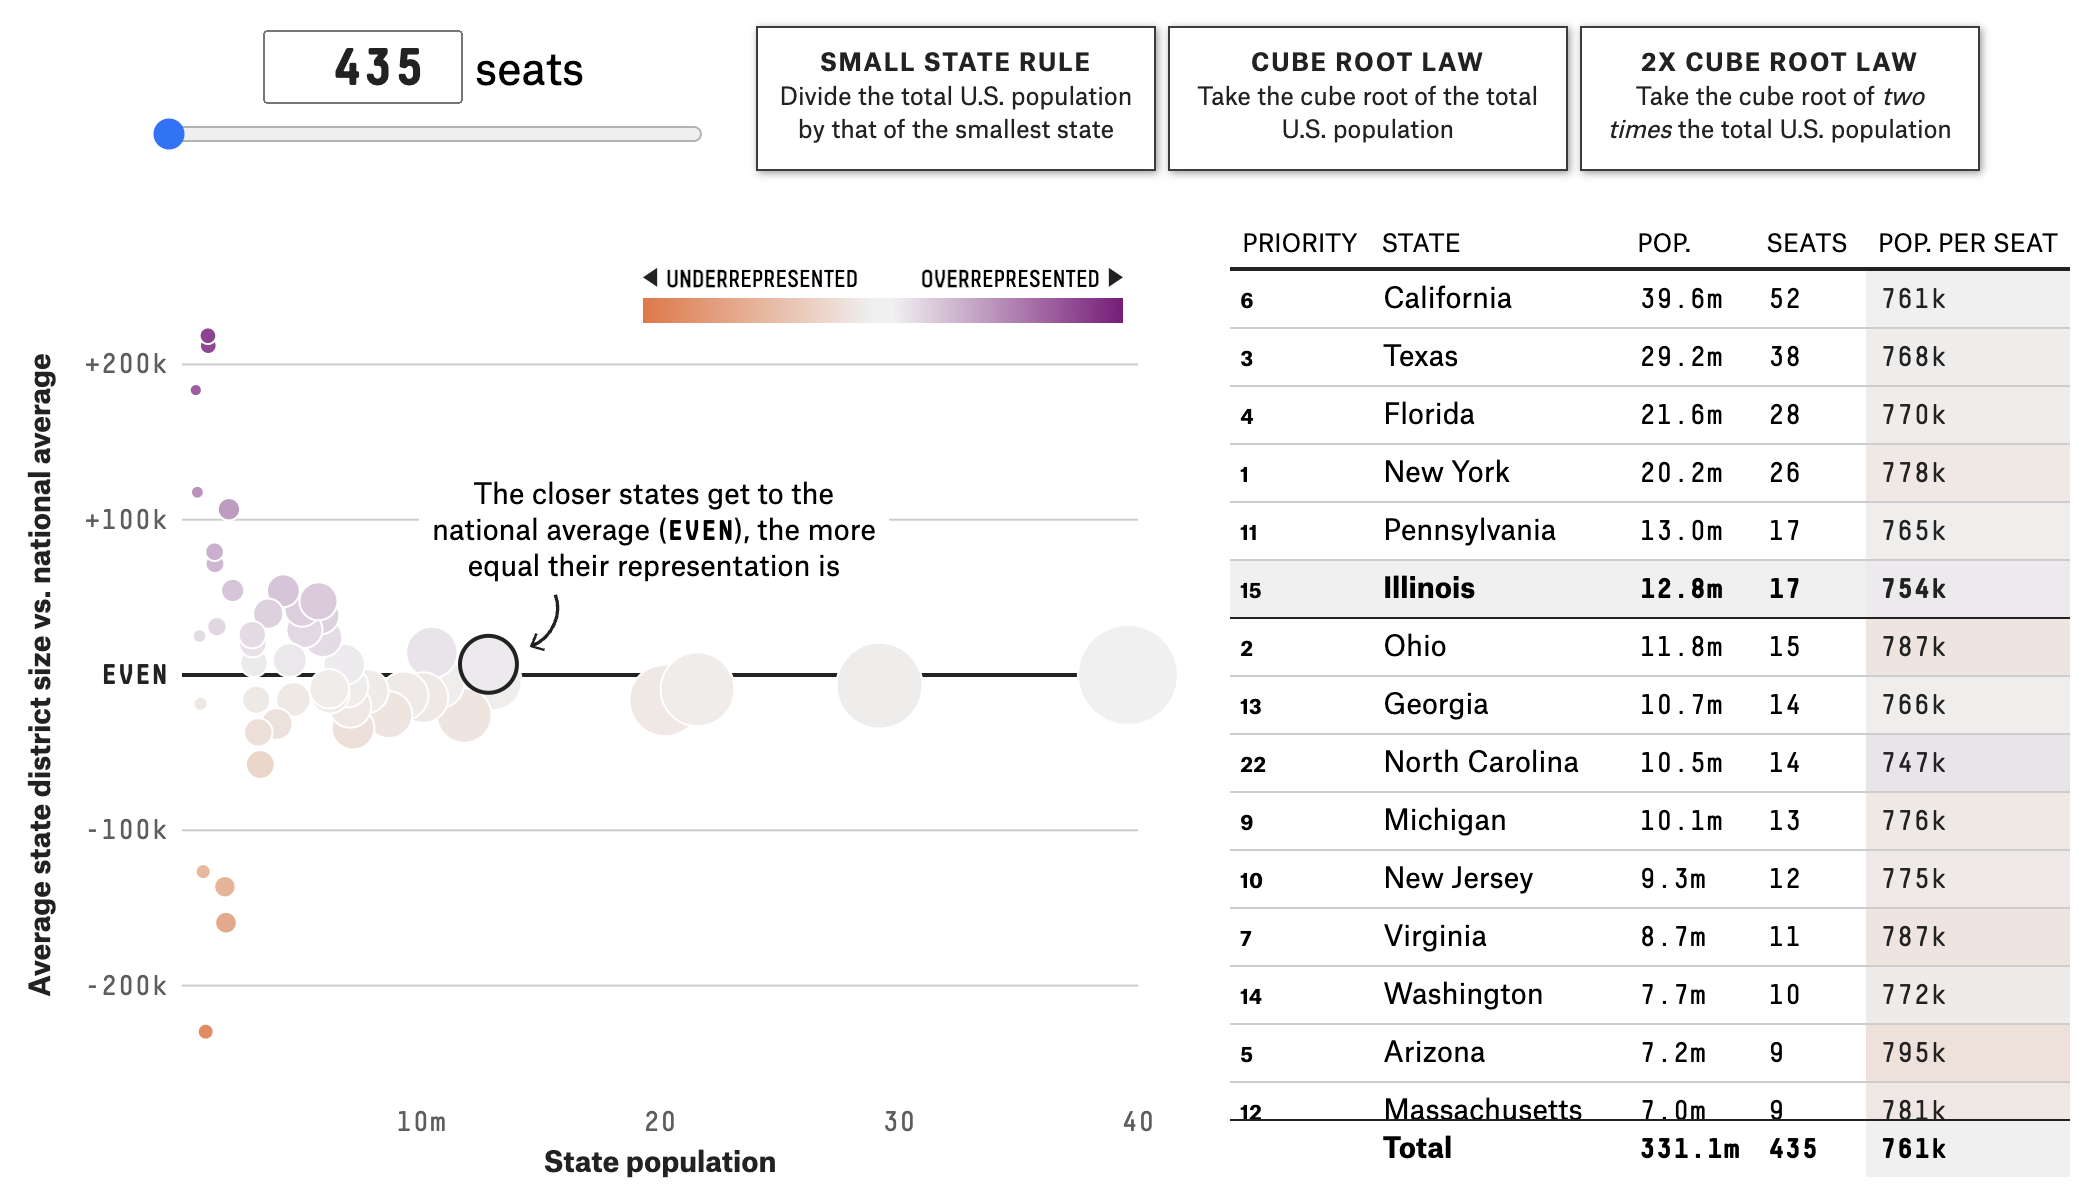
The buttons at the top of this interactive visualisation not only have a title, but also a description of what will happen when they are clicked. Source: projects.fivethirtyeight.com/435-representatives
- The state of interactive elements (like whether a toggle button is active or inactive, for example) should be clearly visible. This means that the visual properties that indicate the state of a visualisation should not rely on colour alone and sufficient contrast needs to be guaranteed.