In order to be understood, a data visualisation and its components need to be perceived by the viewer. Assuming that some people in your audience might suffer from visual impairments, or might even lack sight completely, this means that the information contained in a visualisation needs to be presented in a way that other senses can perceive it.
In practice this means a visualisation and its message should be accessible to screen readers, so that they can be read out loud. How this can be accomplished technically, and how data visualisations should be summarised in a textual way is covered by Alt text.
For people with other visual impairments than blindness, the perceptibility of a data visualisation can be improved by optimising its design. Accessible data visualisation design includes:
- font sizes that are big enough. The space for text on a data visualisation is usually limited, which can tempt data visualisation designers to use small font sizes. This renders the text inaccessible for many people. In a digital environment the font size of text should be configurable by the users’ settings.
- the colours used in a visualisation should be colour blind safe: they should be distinguishable by people suffering from different kinds of colour blindness. Tools exist to test for colour blind safety and to compose colour blind safe palettes, see Accessible colour palettes.
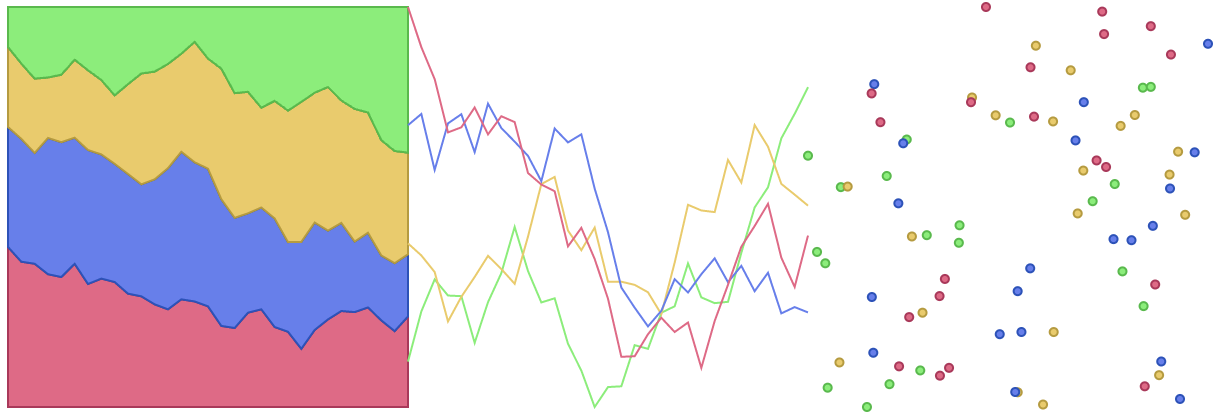
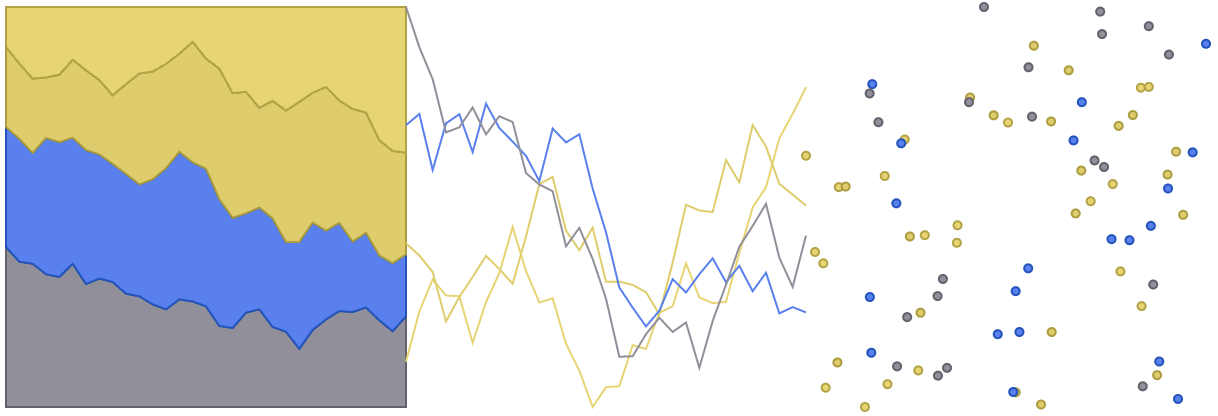
A colour palette with green, orange, blue and red applied to a stacked bar, a line chart and a scatter plot. In the visualisations at the bottom the colours are seen through eyes with protanopia (red colour blindness). Source: Maarten Lambrechts, CC BY 4.0
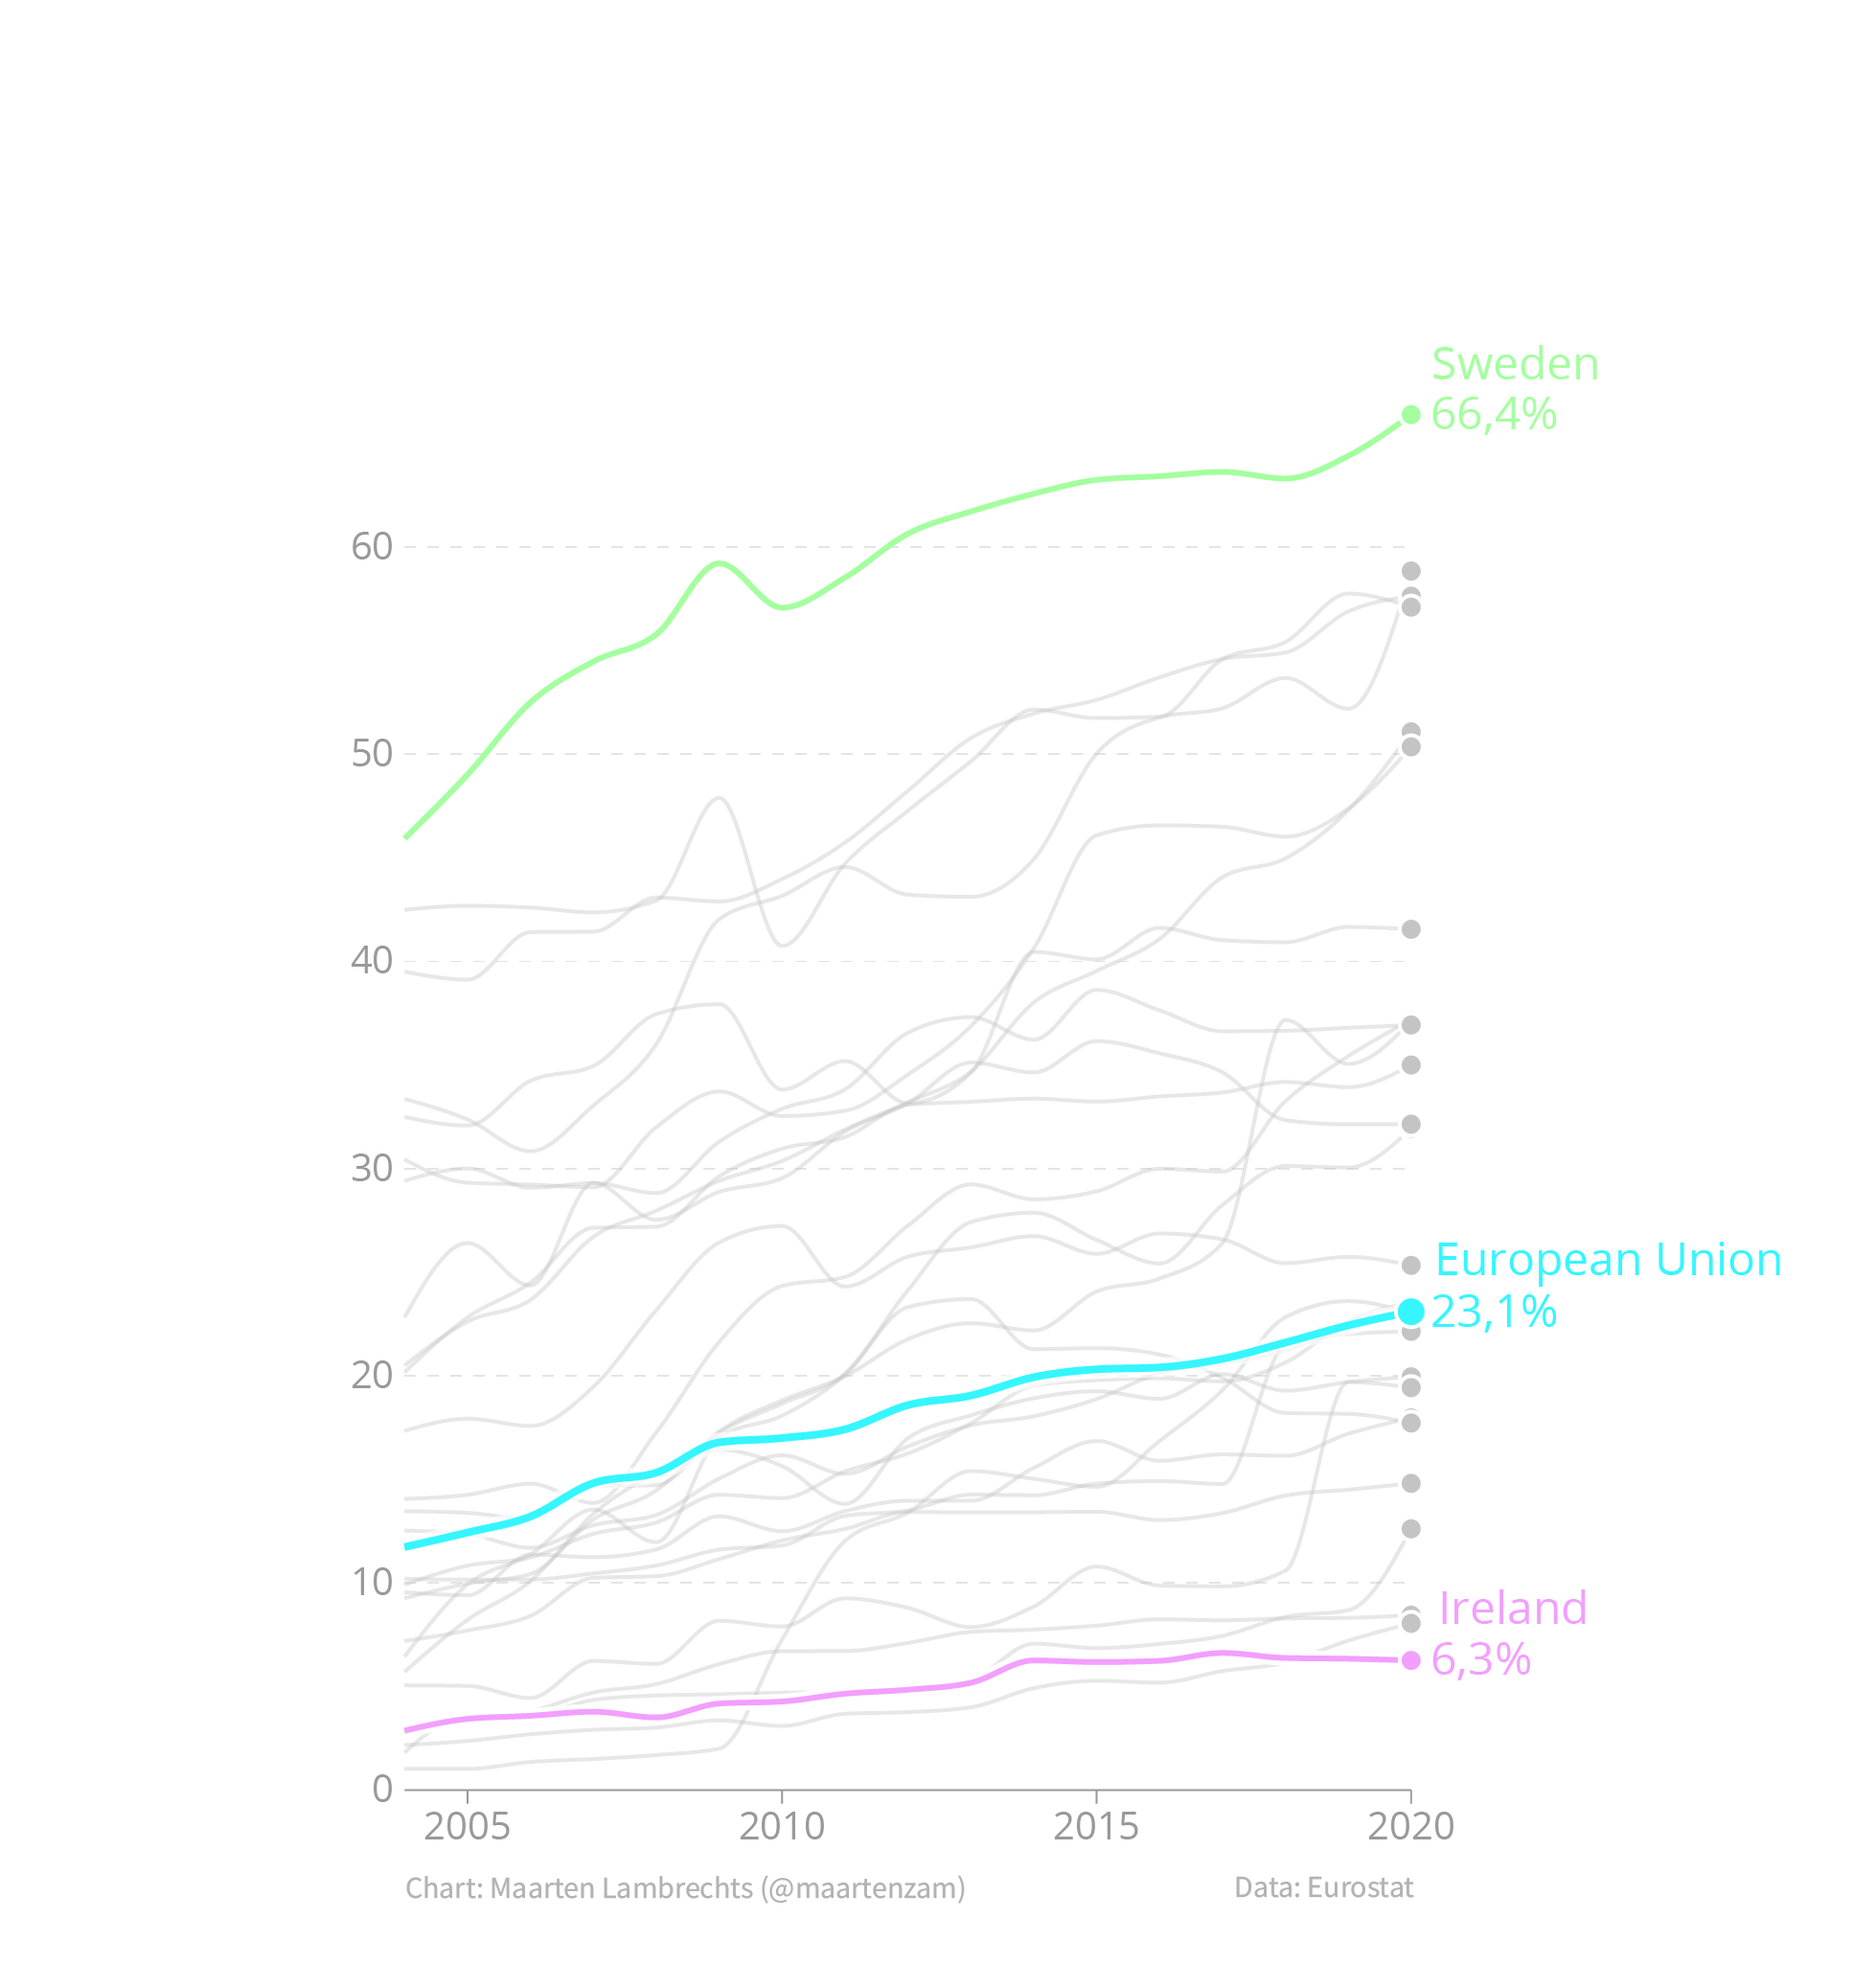
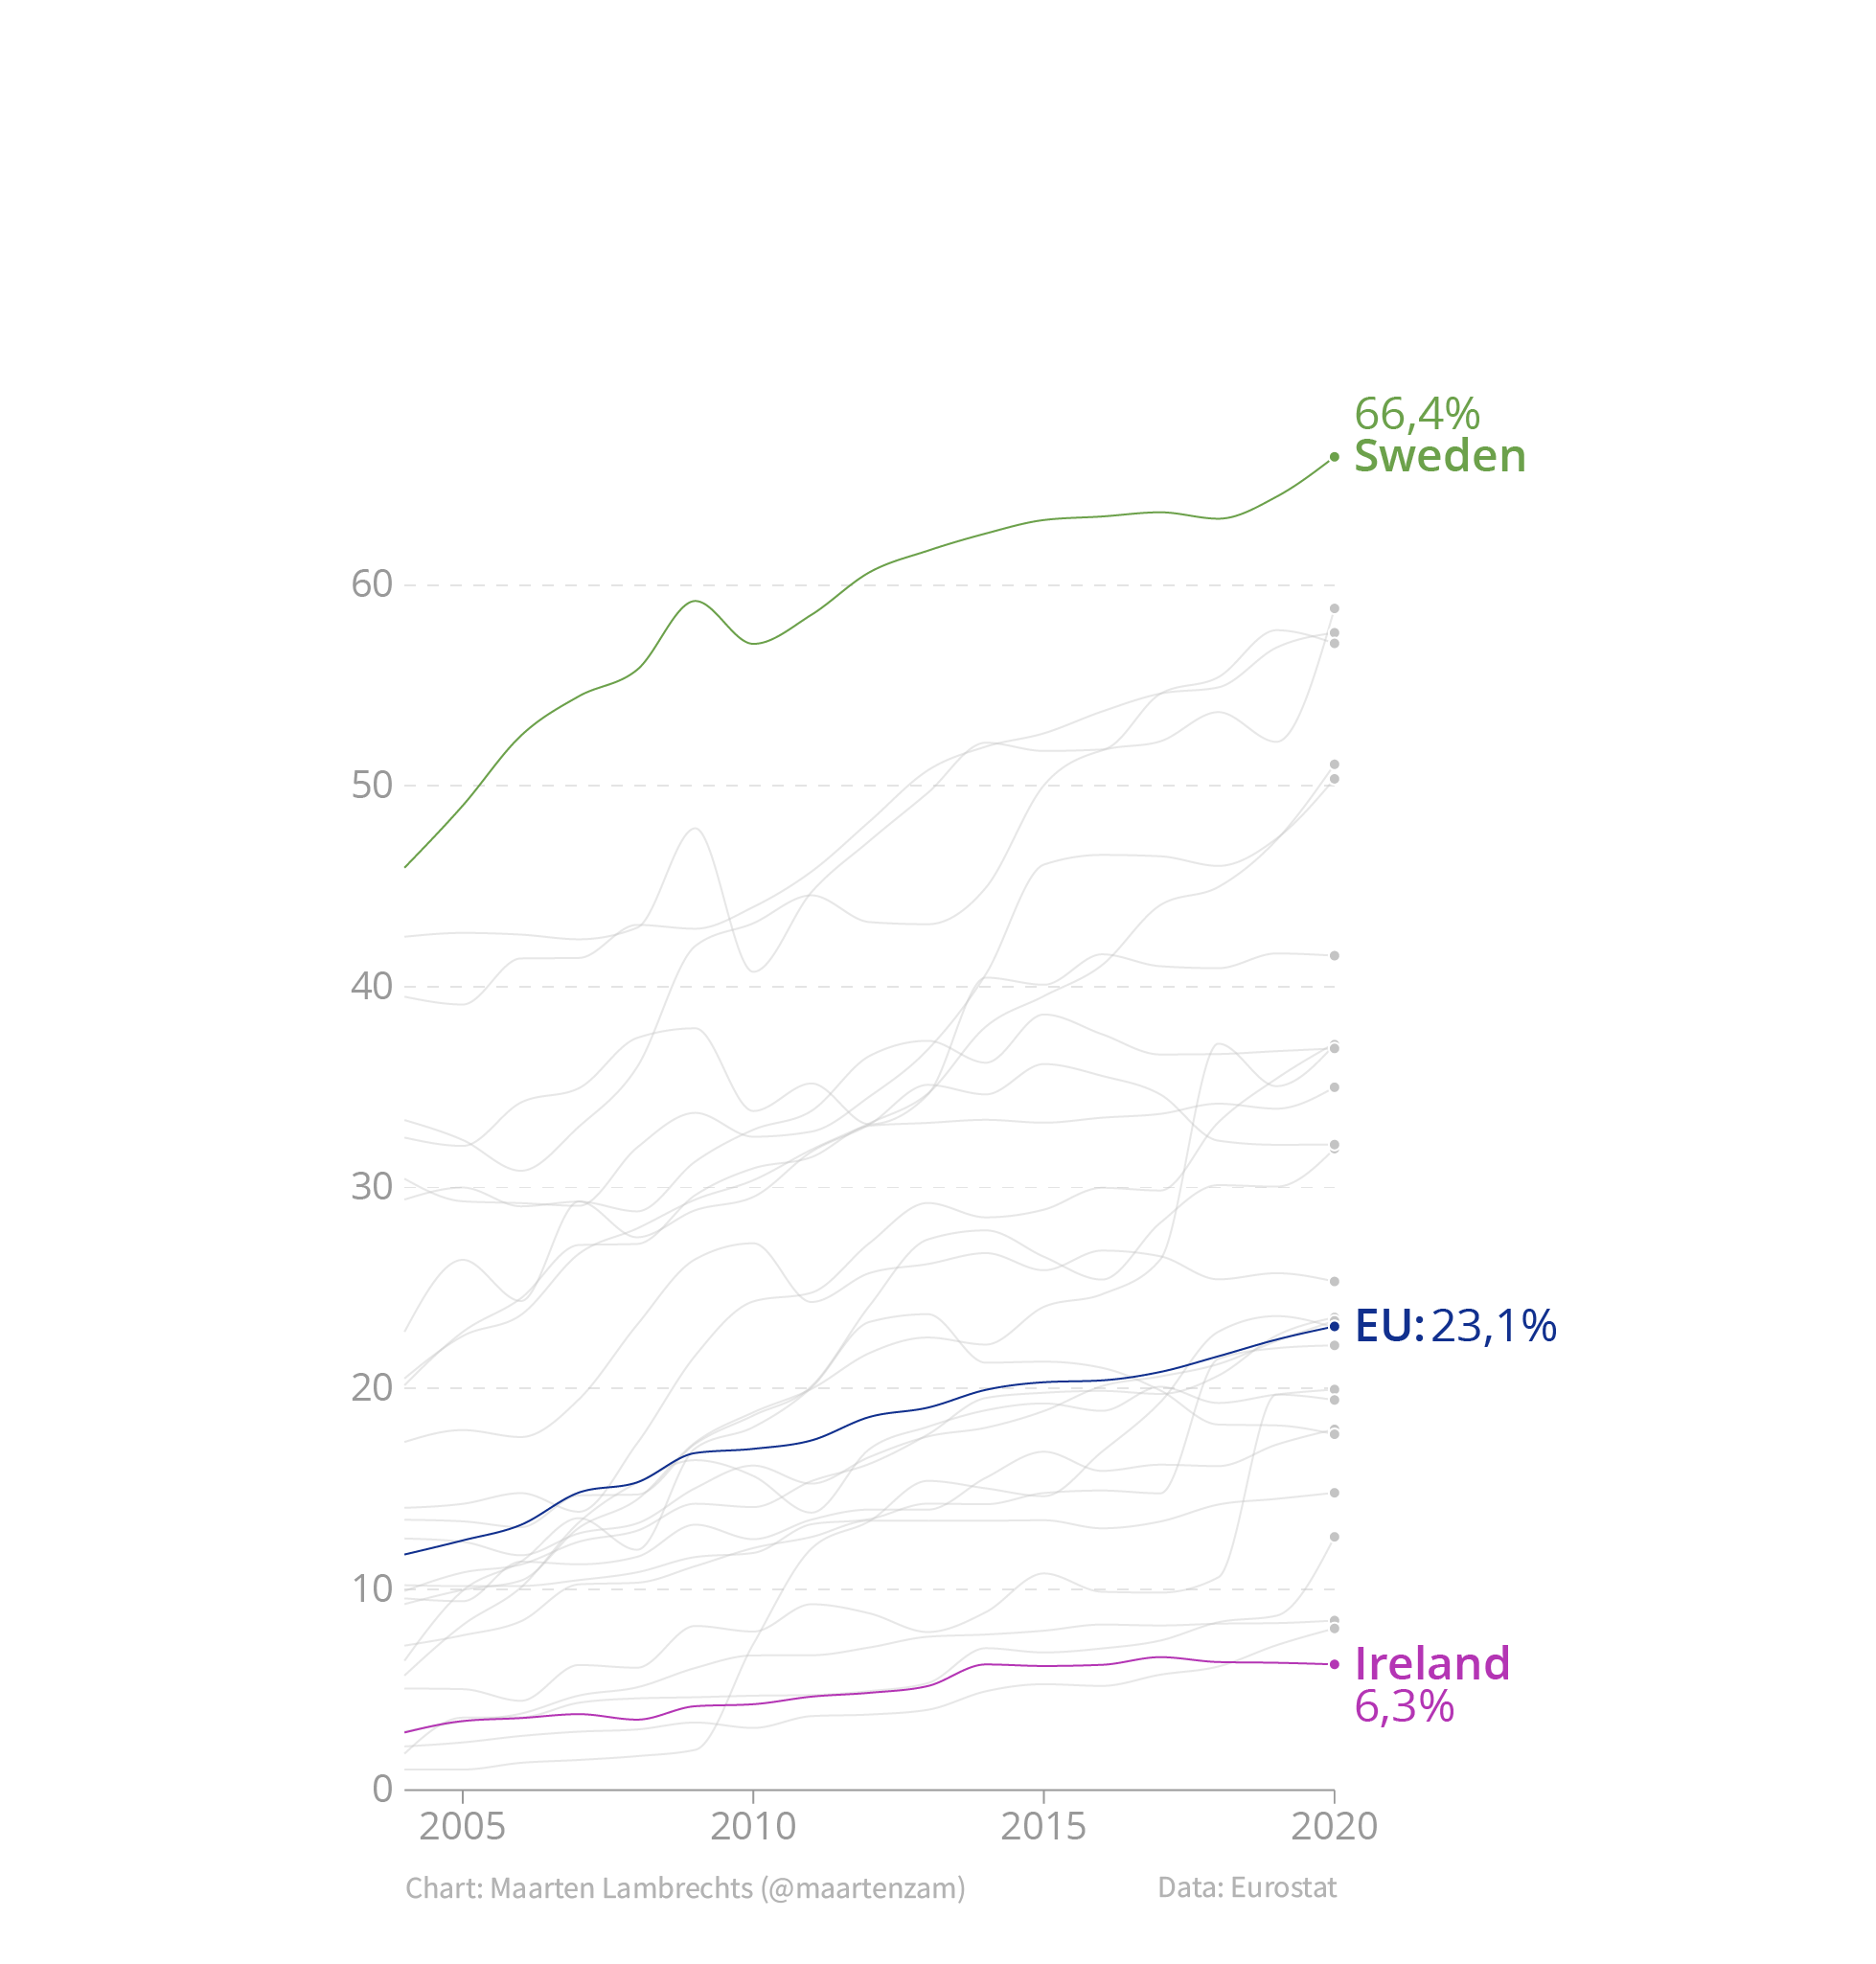
- to go beyond colour blind safety and to make visualisations perceivable in greyscale, the colour encoding should be complemented with encodings by other visual channels. A great example of this is a technique called direct labelling: instead of a separate legend that fully relies on colour to identify features of a visualisation, the position of text elements can be used to identify features more clearly. In the visualisations below, the 3 thicker lines are directly labelled in the chart on the right, and can be identified without any problem by people who can not perceive any colour at all.
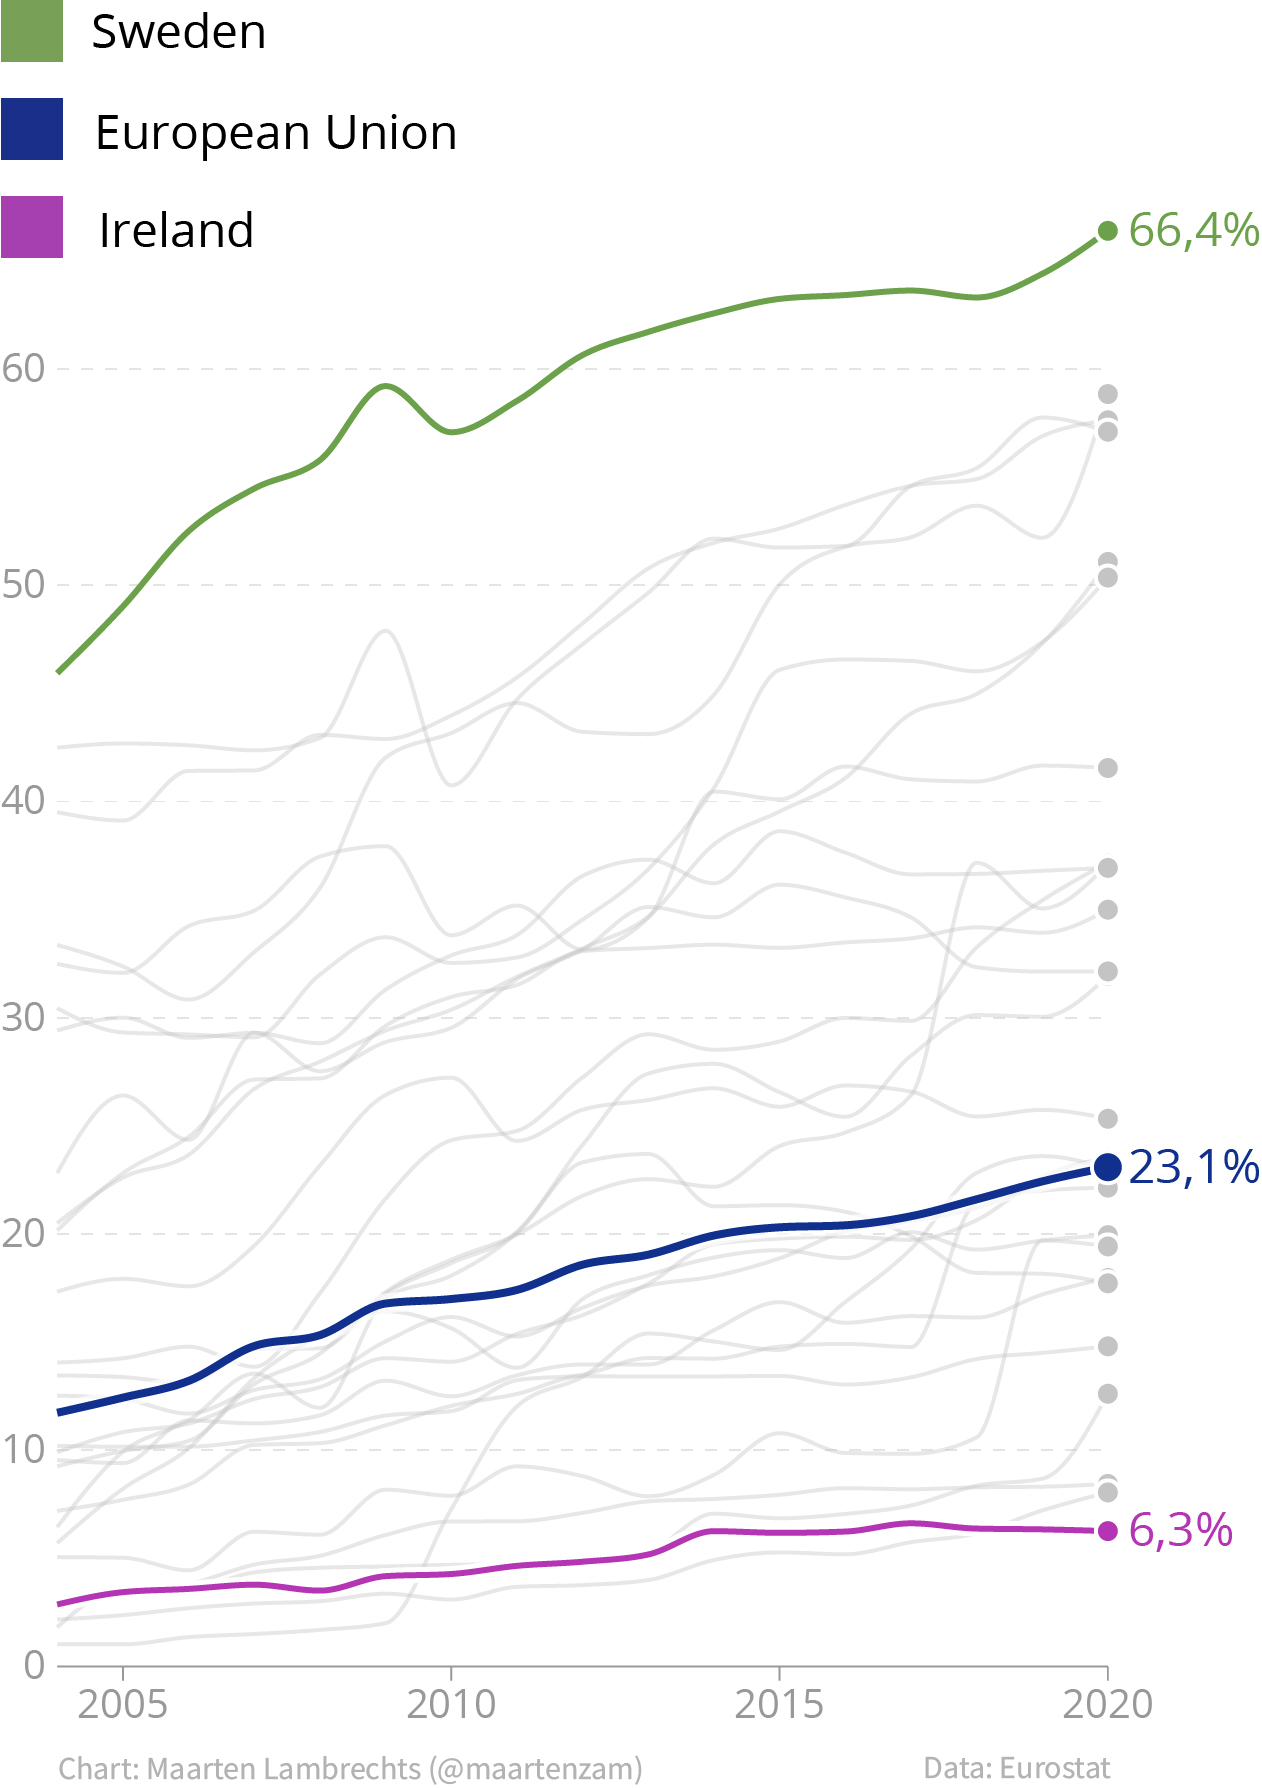
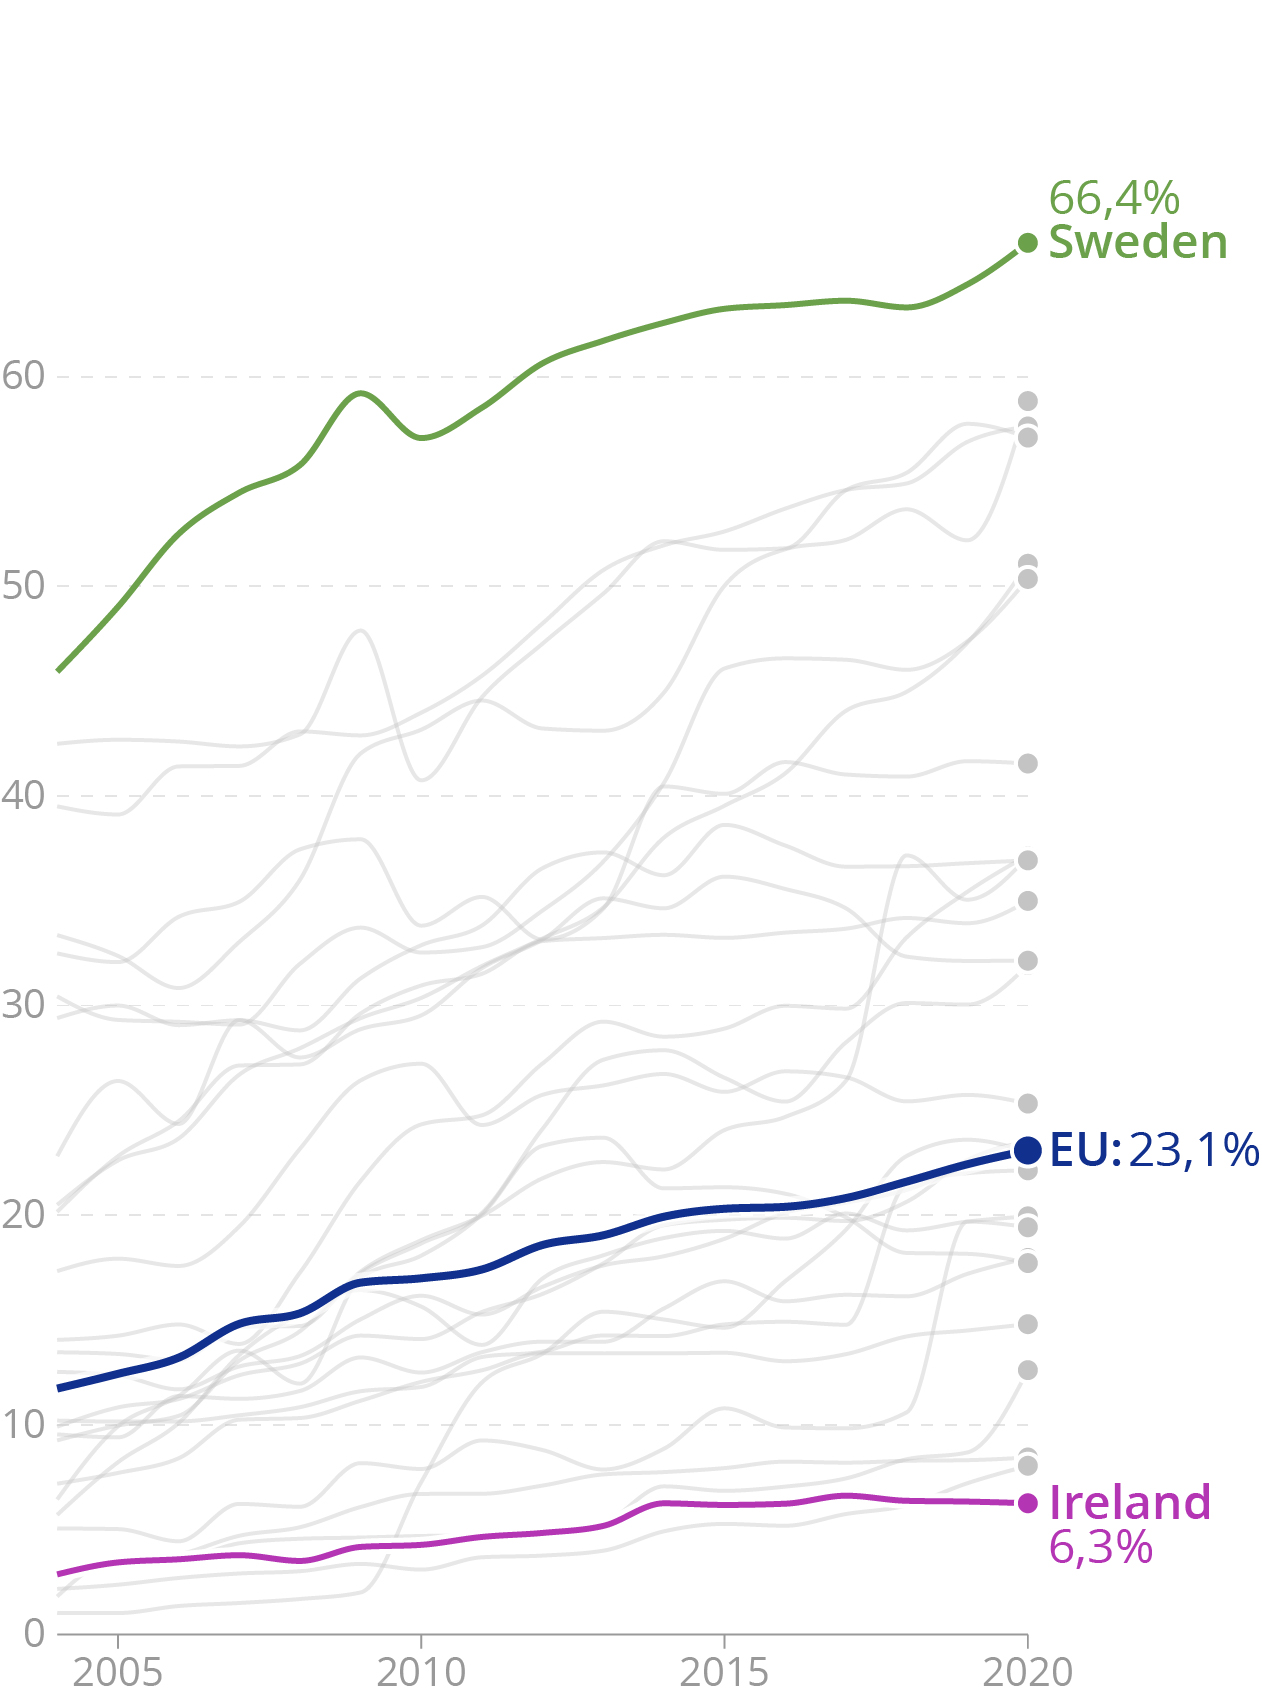
A separate colour legend vs directly labelled lines. Source: Maarten Lambrechts, CC-BY 4.0
- related to colour blind safety is the contrast between the colour of text and geometrical elements on a visualisation and the colour of their background. The contrast ratio between geometrical elements like bars and circles and their background should be bigger than 3:1, the contrast ratio between text and background should be greater than 4,5:1.
Example of a chart with colours that have too little contrast with the background of the chart. Source: Maarten Lambrechts, CC BY SA 4.0
- the graphical elements on a chart should have sufficiently large sizes in order to be perceived. Lines should have a sufficiently large stroke width, dots should have a sufficiently large radius and bars shouldn’t be too thin.
On this chart, the lines and dots are too thin, and are hard to perceive. Source: Maarten Lambrechts, CC-BY-SA 4.0
- to help the perception of neighbouring elements in visualisation, elements should be separated from each other using white space.
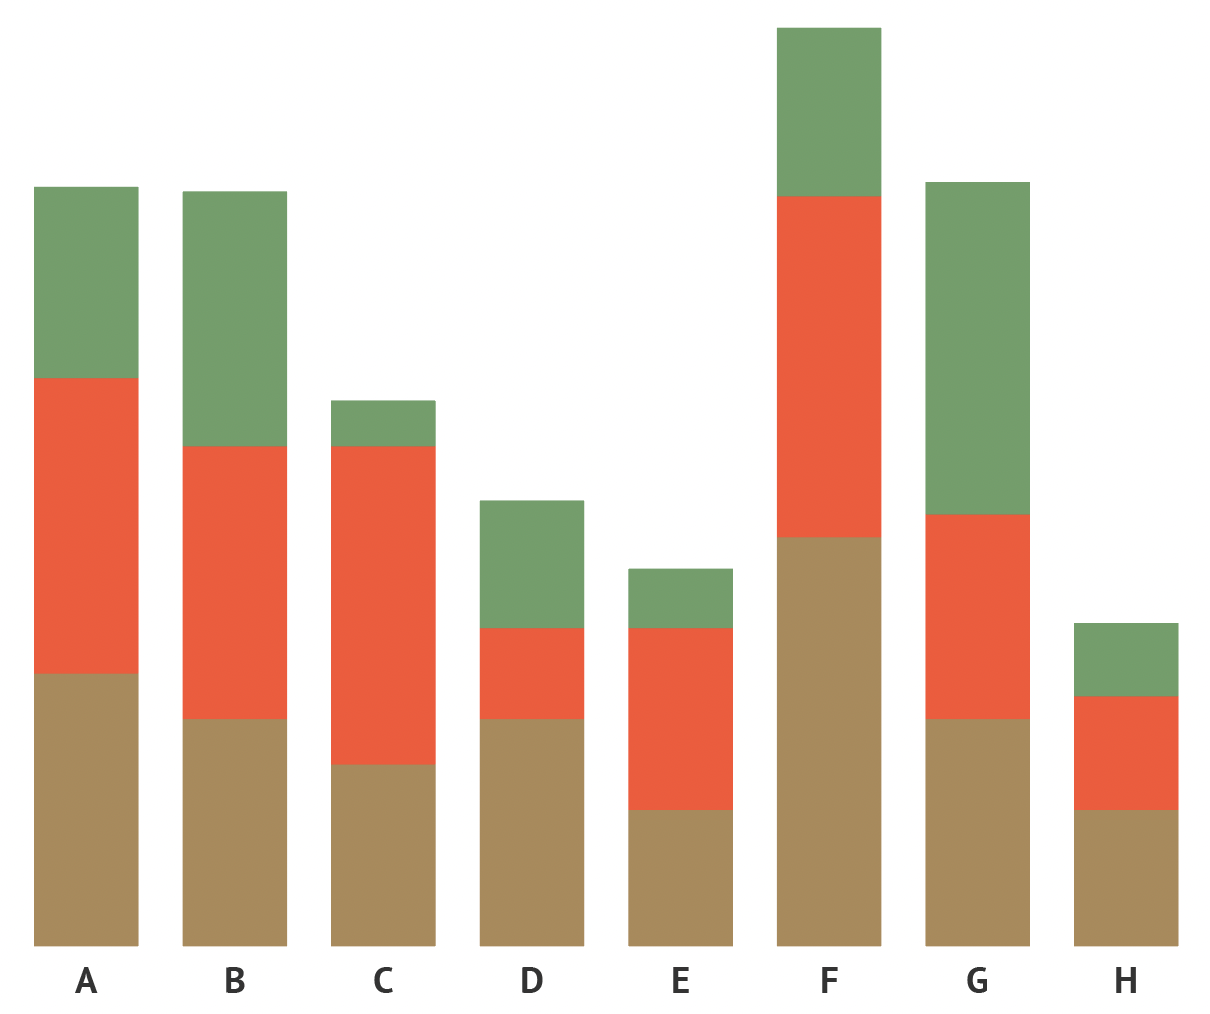
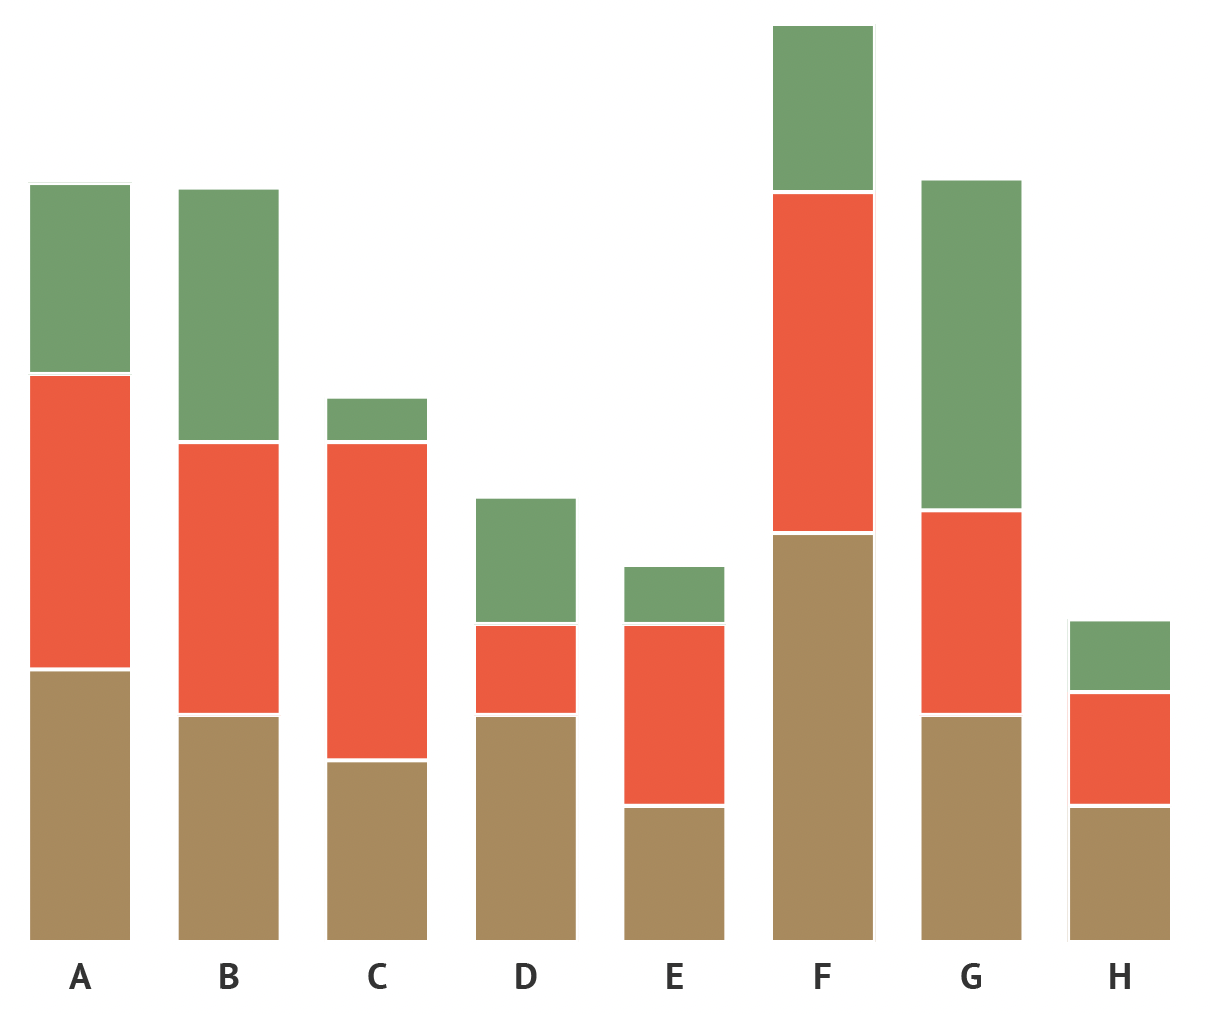
Especially on bright screens, the boundaries of the stacked bars in this visualisation are hard to perceive. Source: Maarten Lambrechts, CC BY SA 4.0
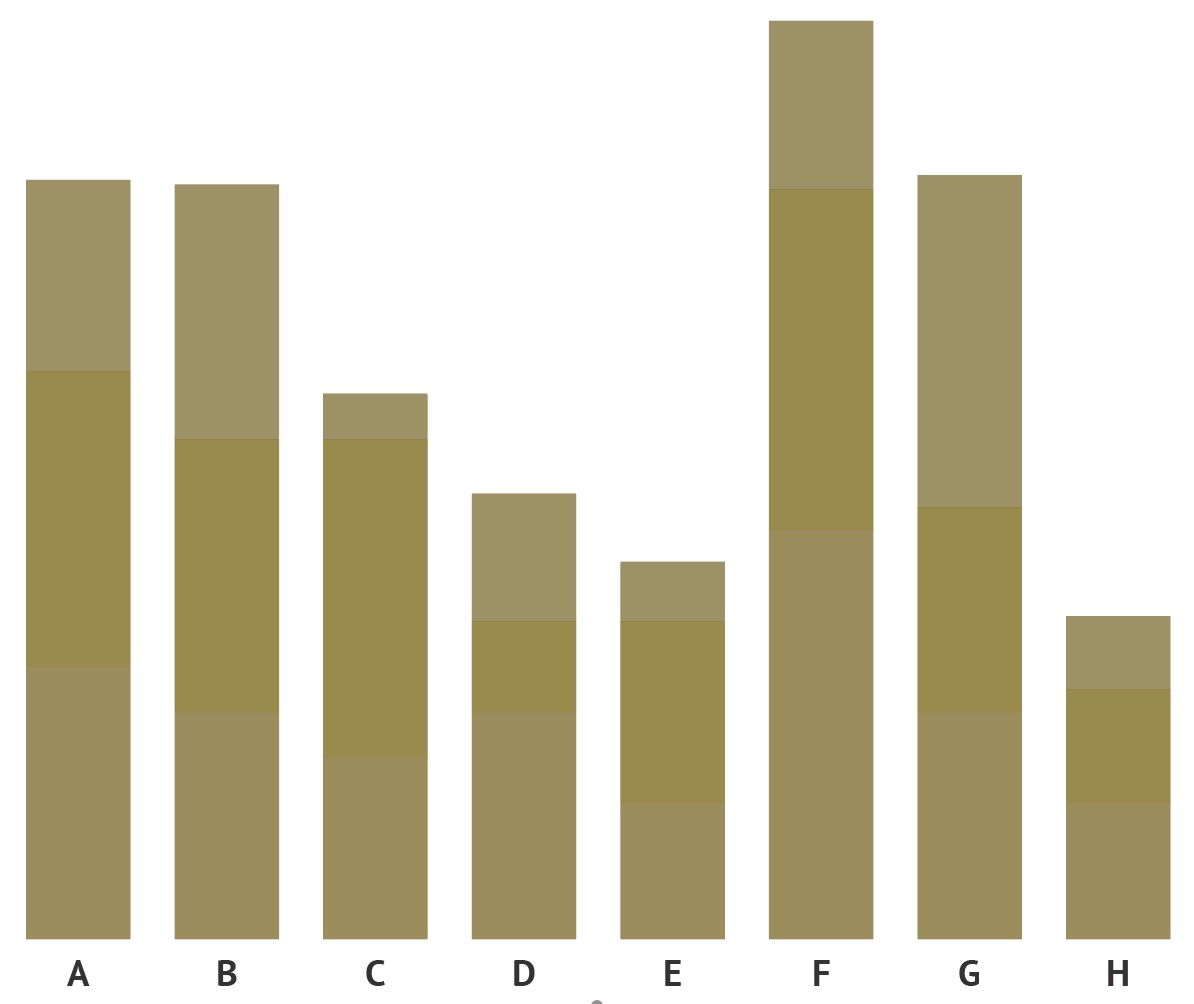
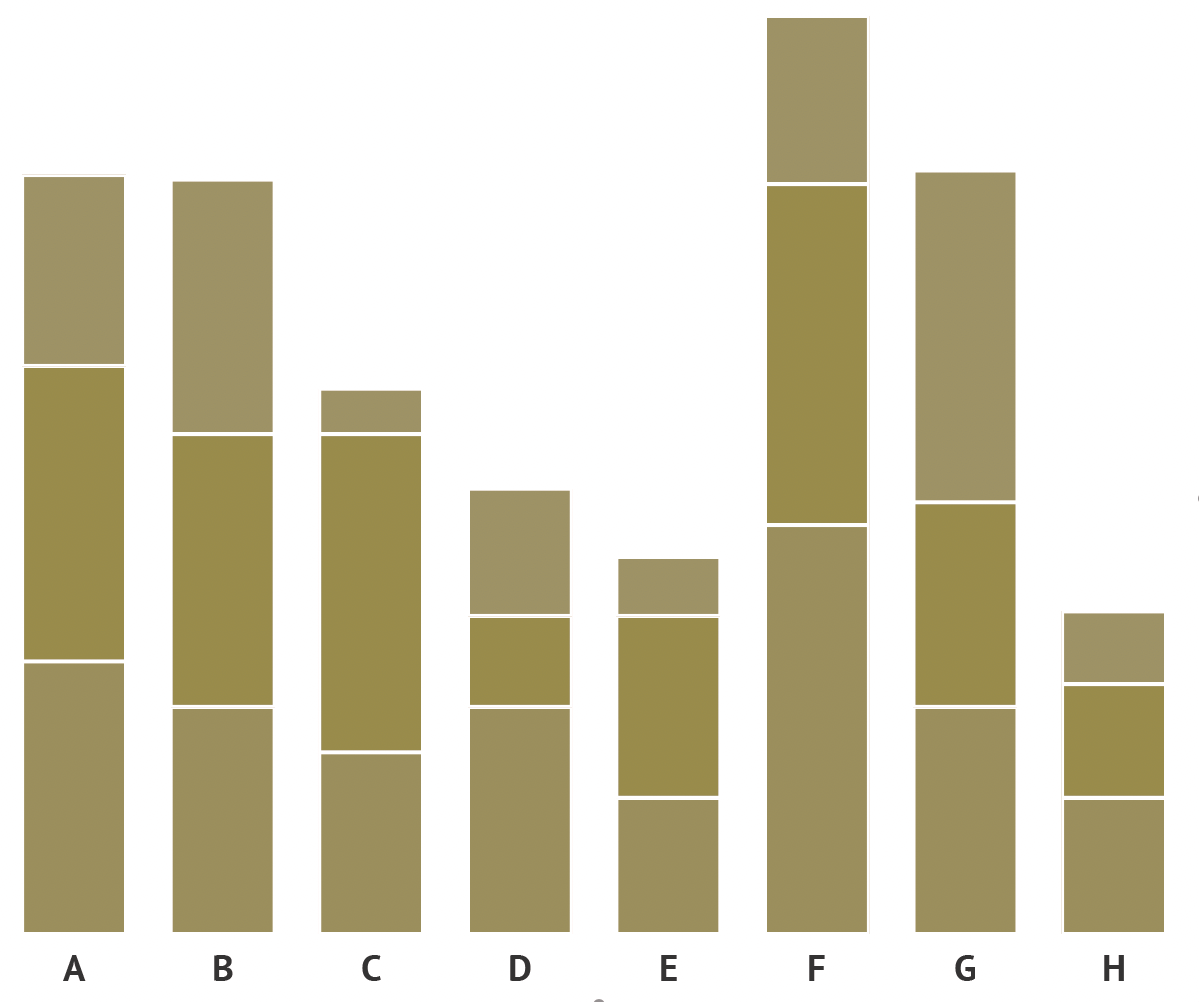
This is the same stacked bar chart as above, as perceived by people suffering from protanopia (red colour blindness). Source: Maarten Lambrechts, CC BY SA 4.0
When the stacked bars receive a white outline, the problem with the boundaries is overcome. Source: Maarten Lambrechts, CC BY SA 4.0
Giving the bars an outline also helps colour blind people in perceiving the bars in each stack. Source: Maarten Lambrechts, CC BY SA 4.0
- any text in a visualisation should not overlap other chart elements. When text is placed on top of other elements, it should have its own background colour to assure readability.