A visualisation makes no sense if it is only perceived but not understood. Making a chart more understandable can be done in many ways:
- Make it clear and explicit why a visualisation is shown to the viewer, and how it should be read, used and interpreted.
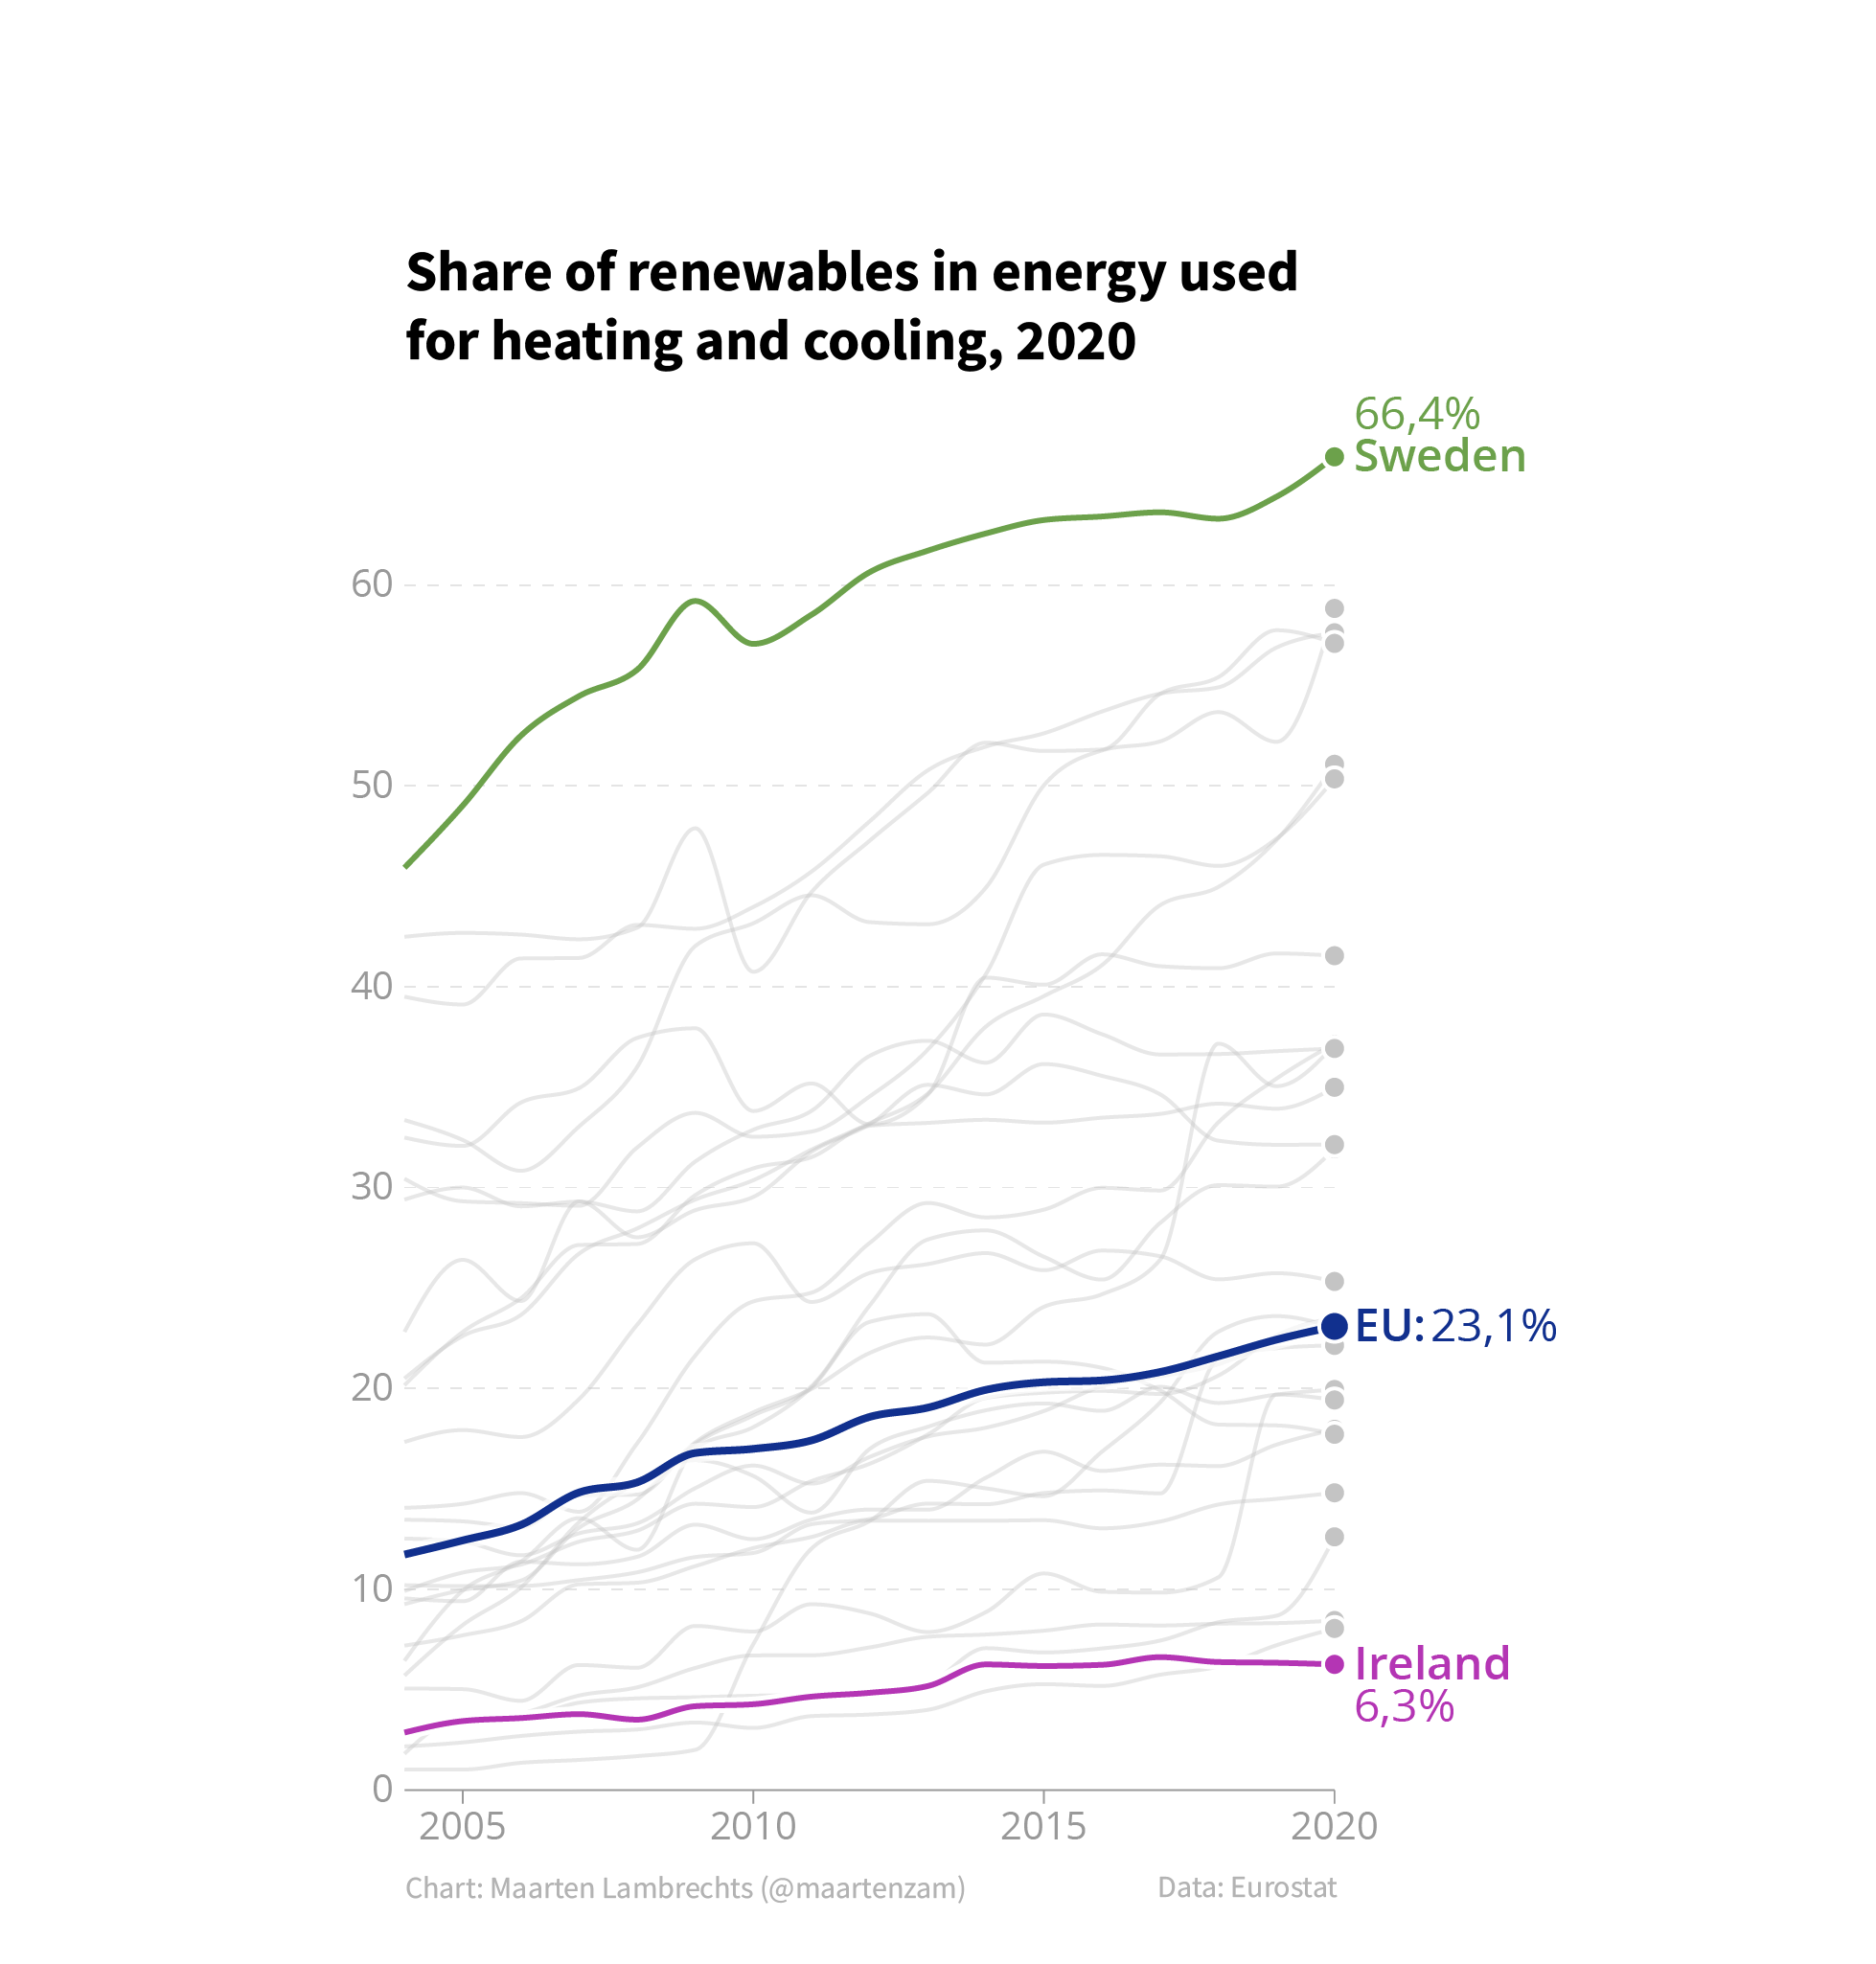
- The units the data is expressed in should be provided and should be unambiguous, and axes should be clearly labelled.
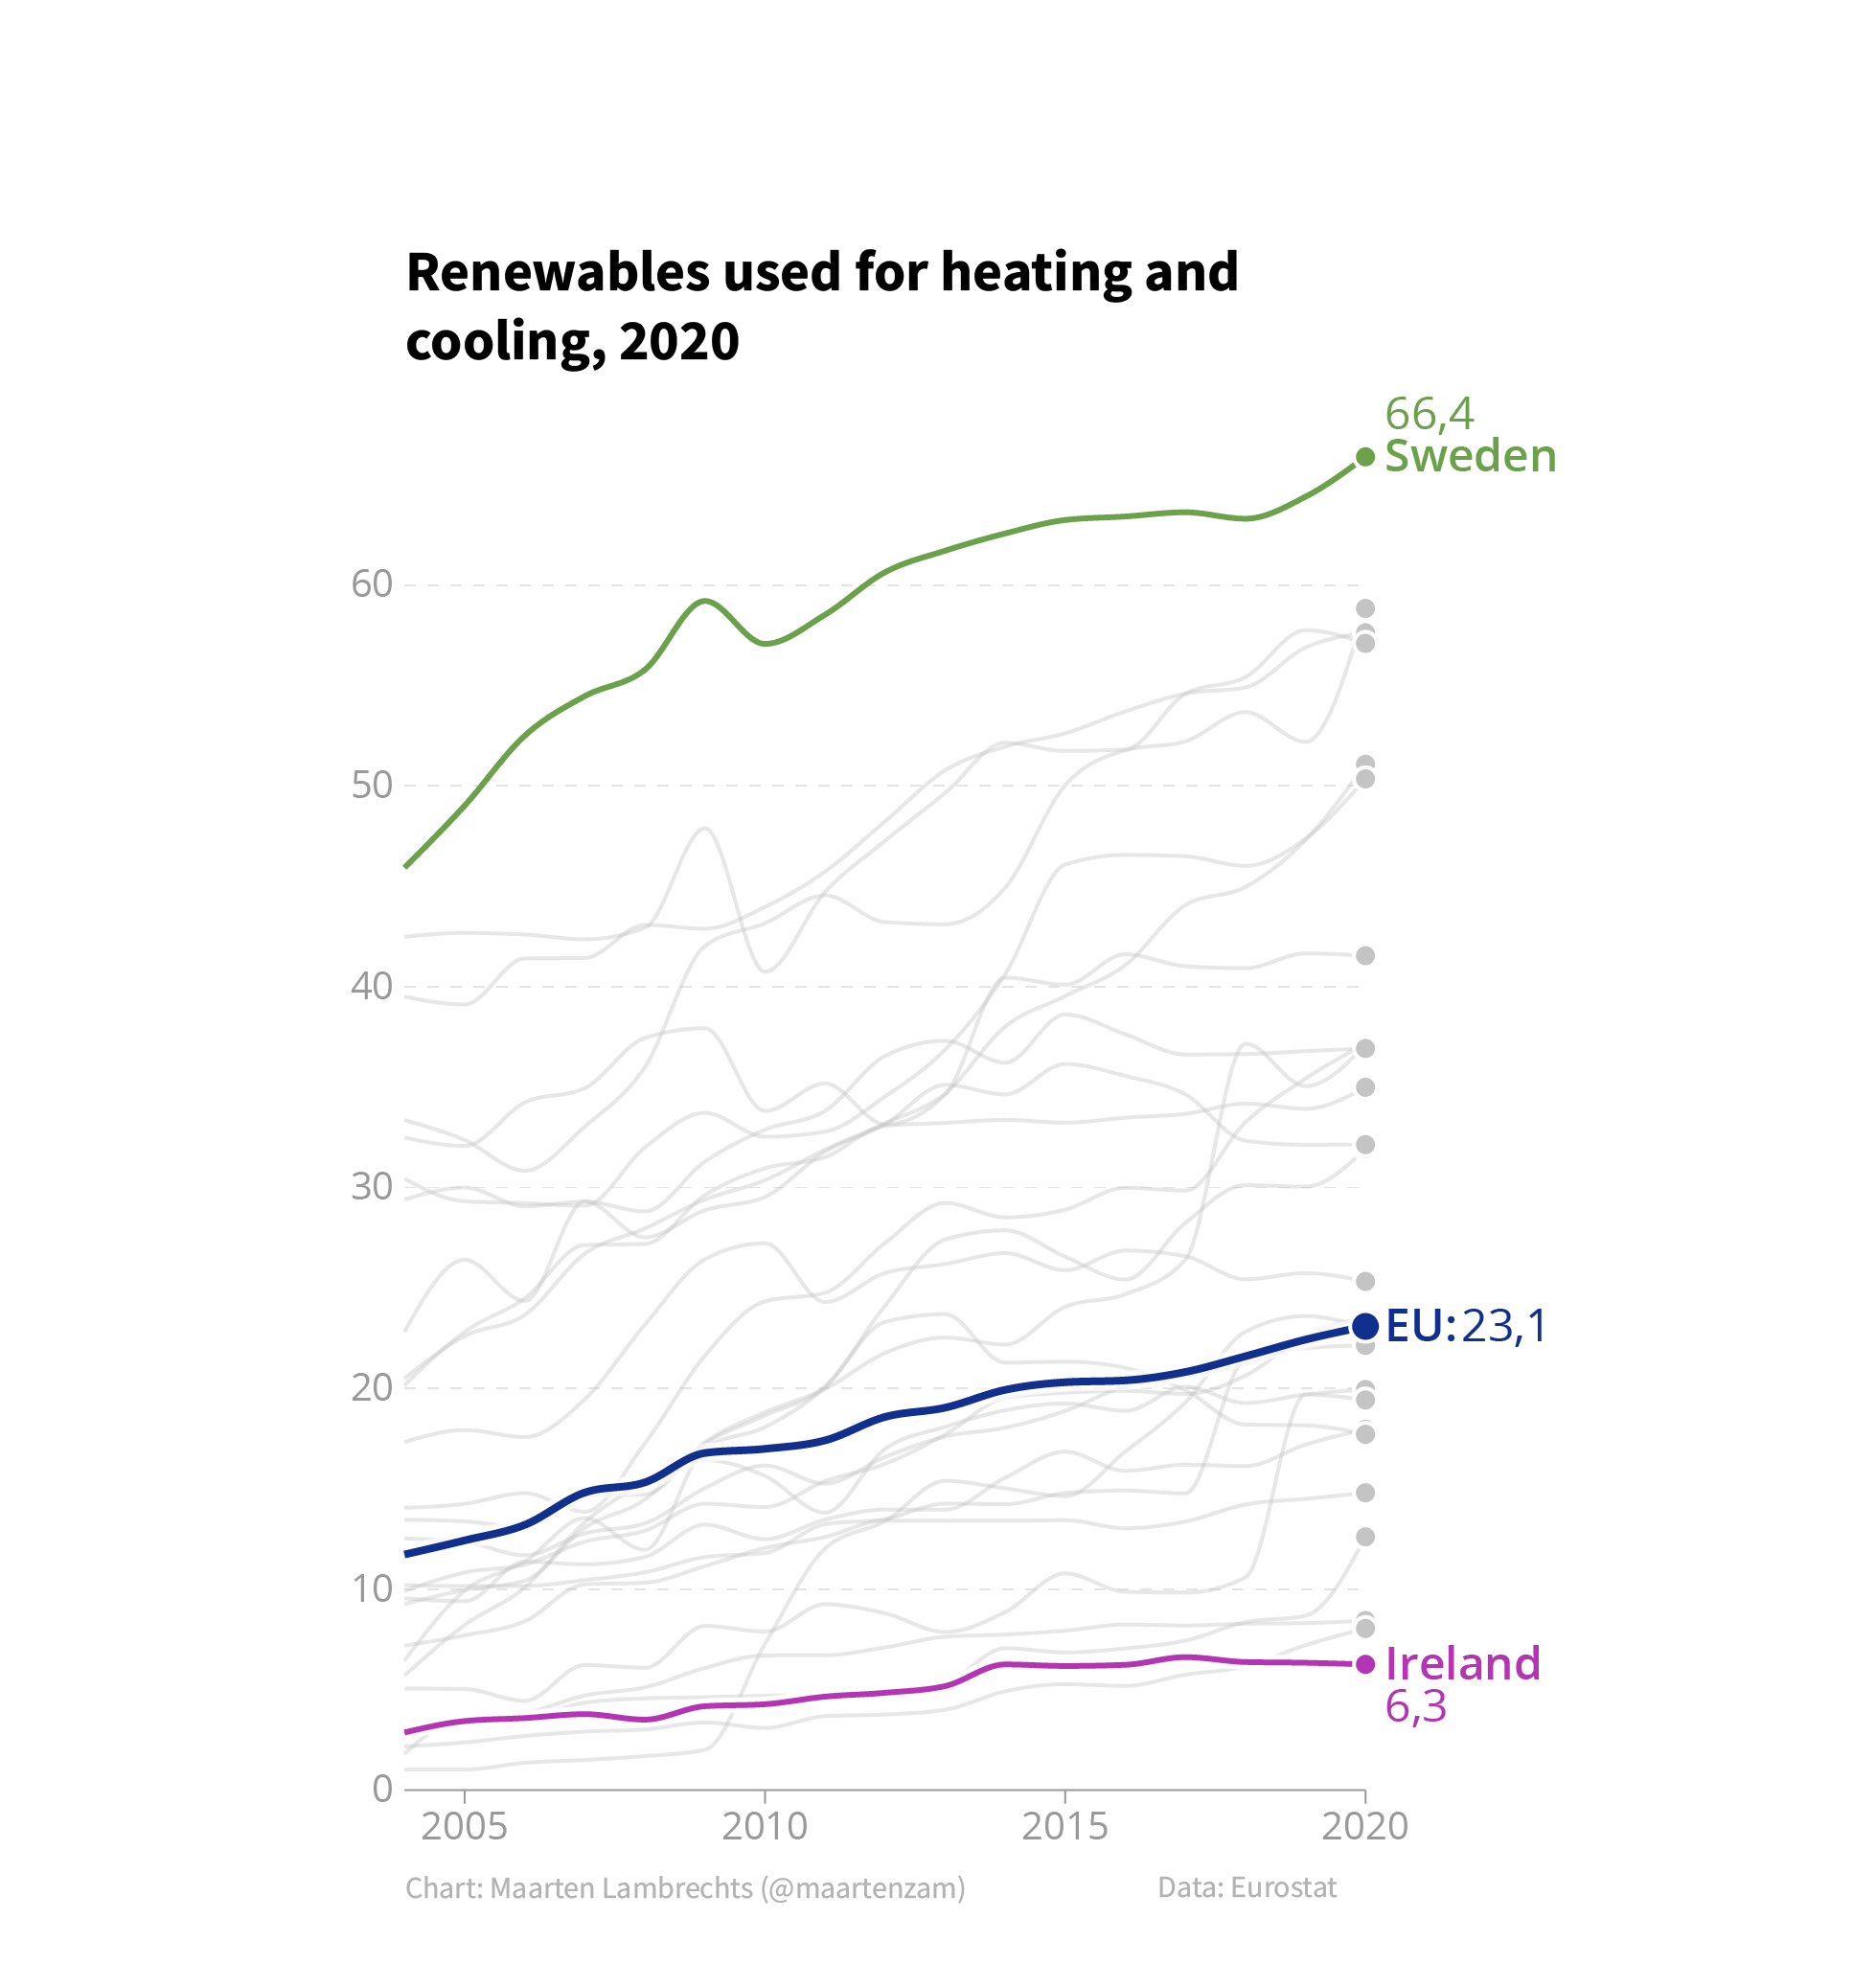
A chart without units is meaningless. Source: Maarten Lambrechts, CC BY SA 4.0
- The chart title should contain the take away message of the chart. Compare the “understandability” of the two charts below.
Source: Maarten Lambrechts, CC BY SA 4.0
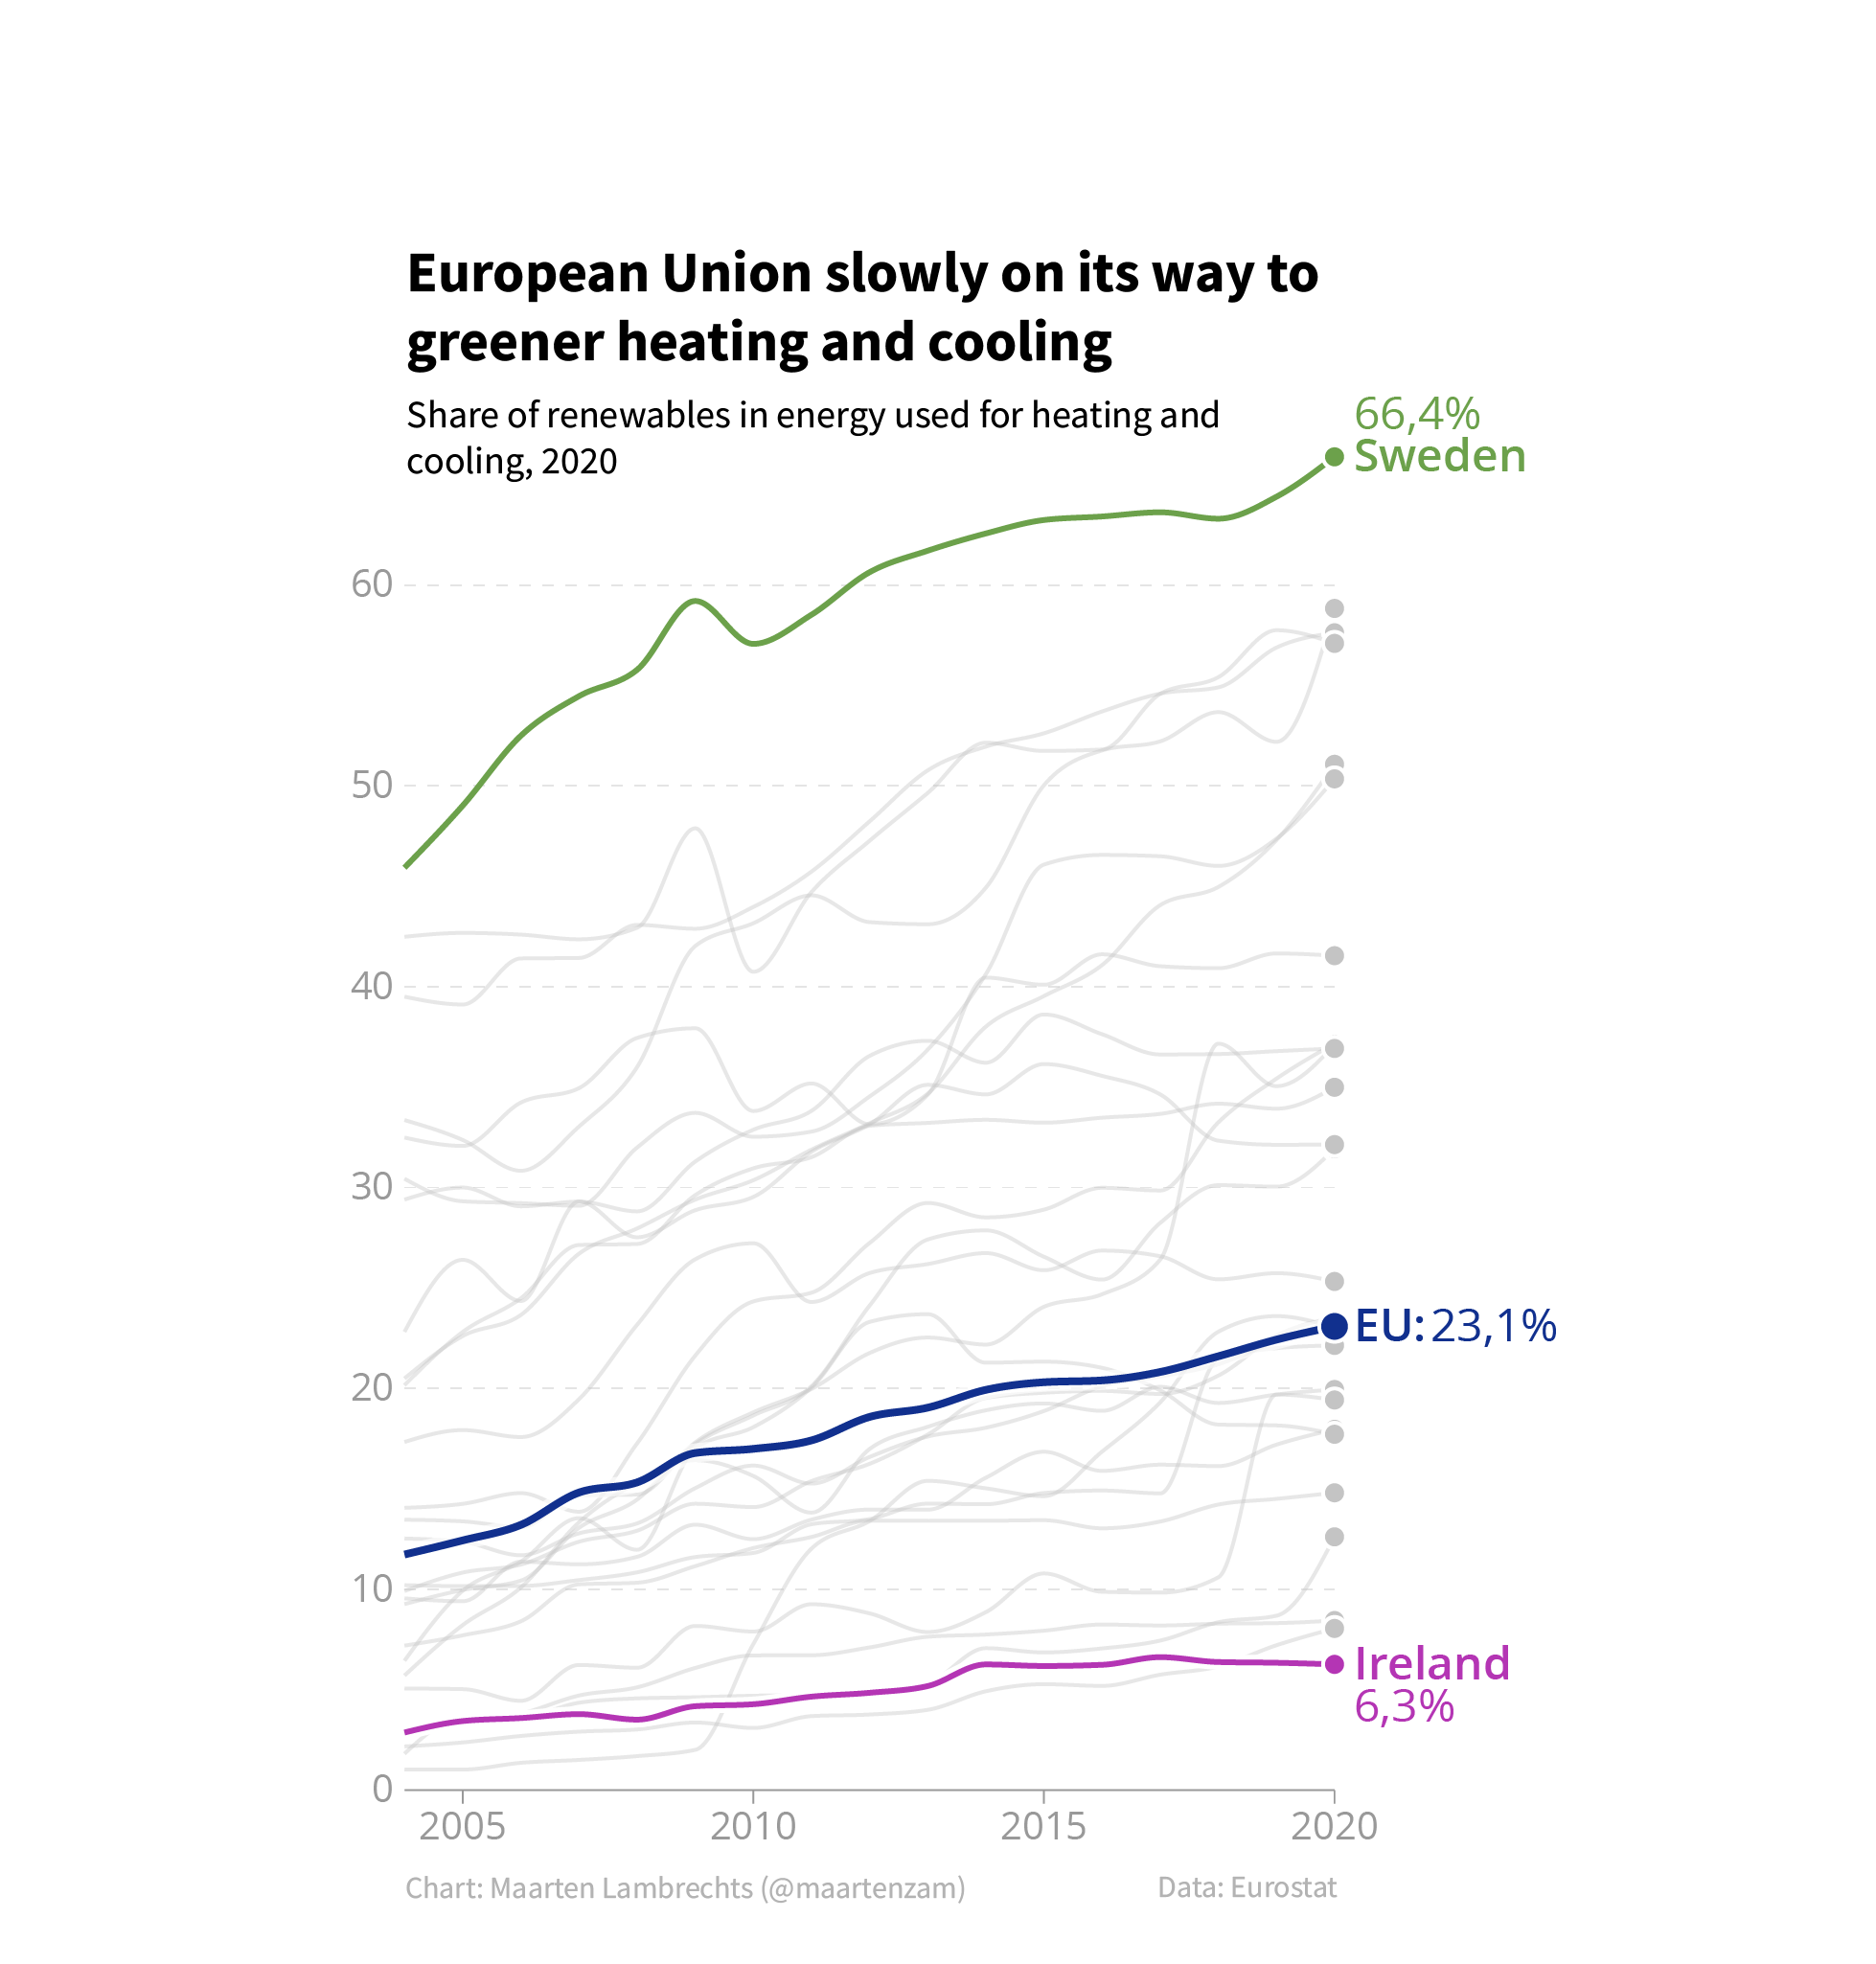
Source: Maarten Lambrechts, CC BY SA 4.0
- The used text should be clear, and free from jargon and acronyms.
- Charts should not be overloaded. The number of data points and the number of different categories shouldn’t be too high.
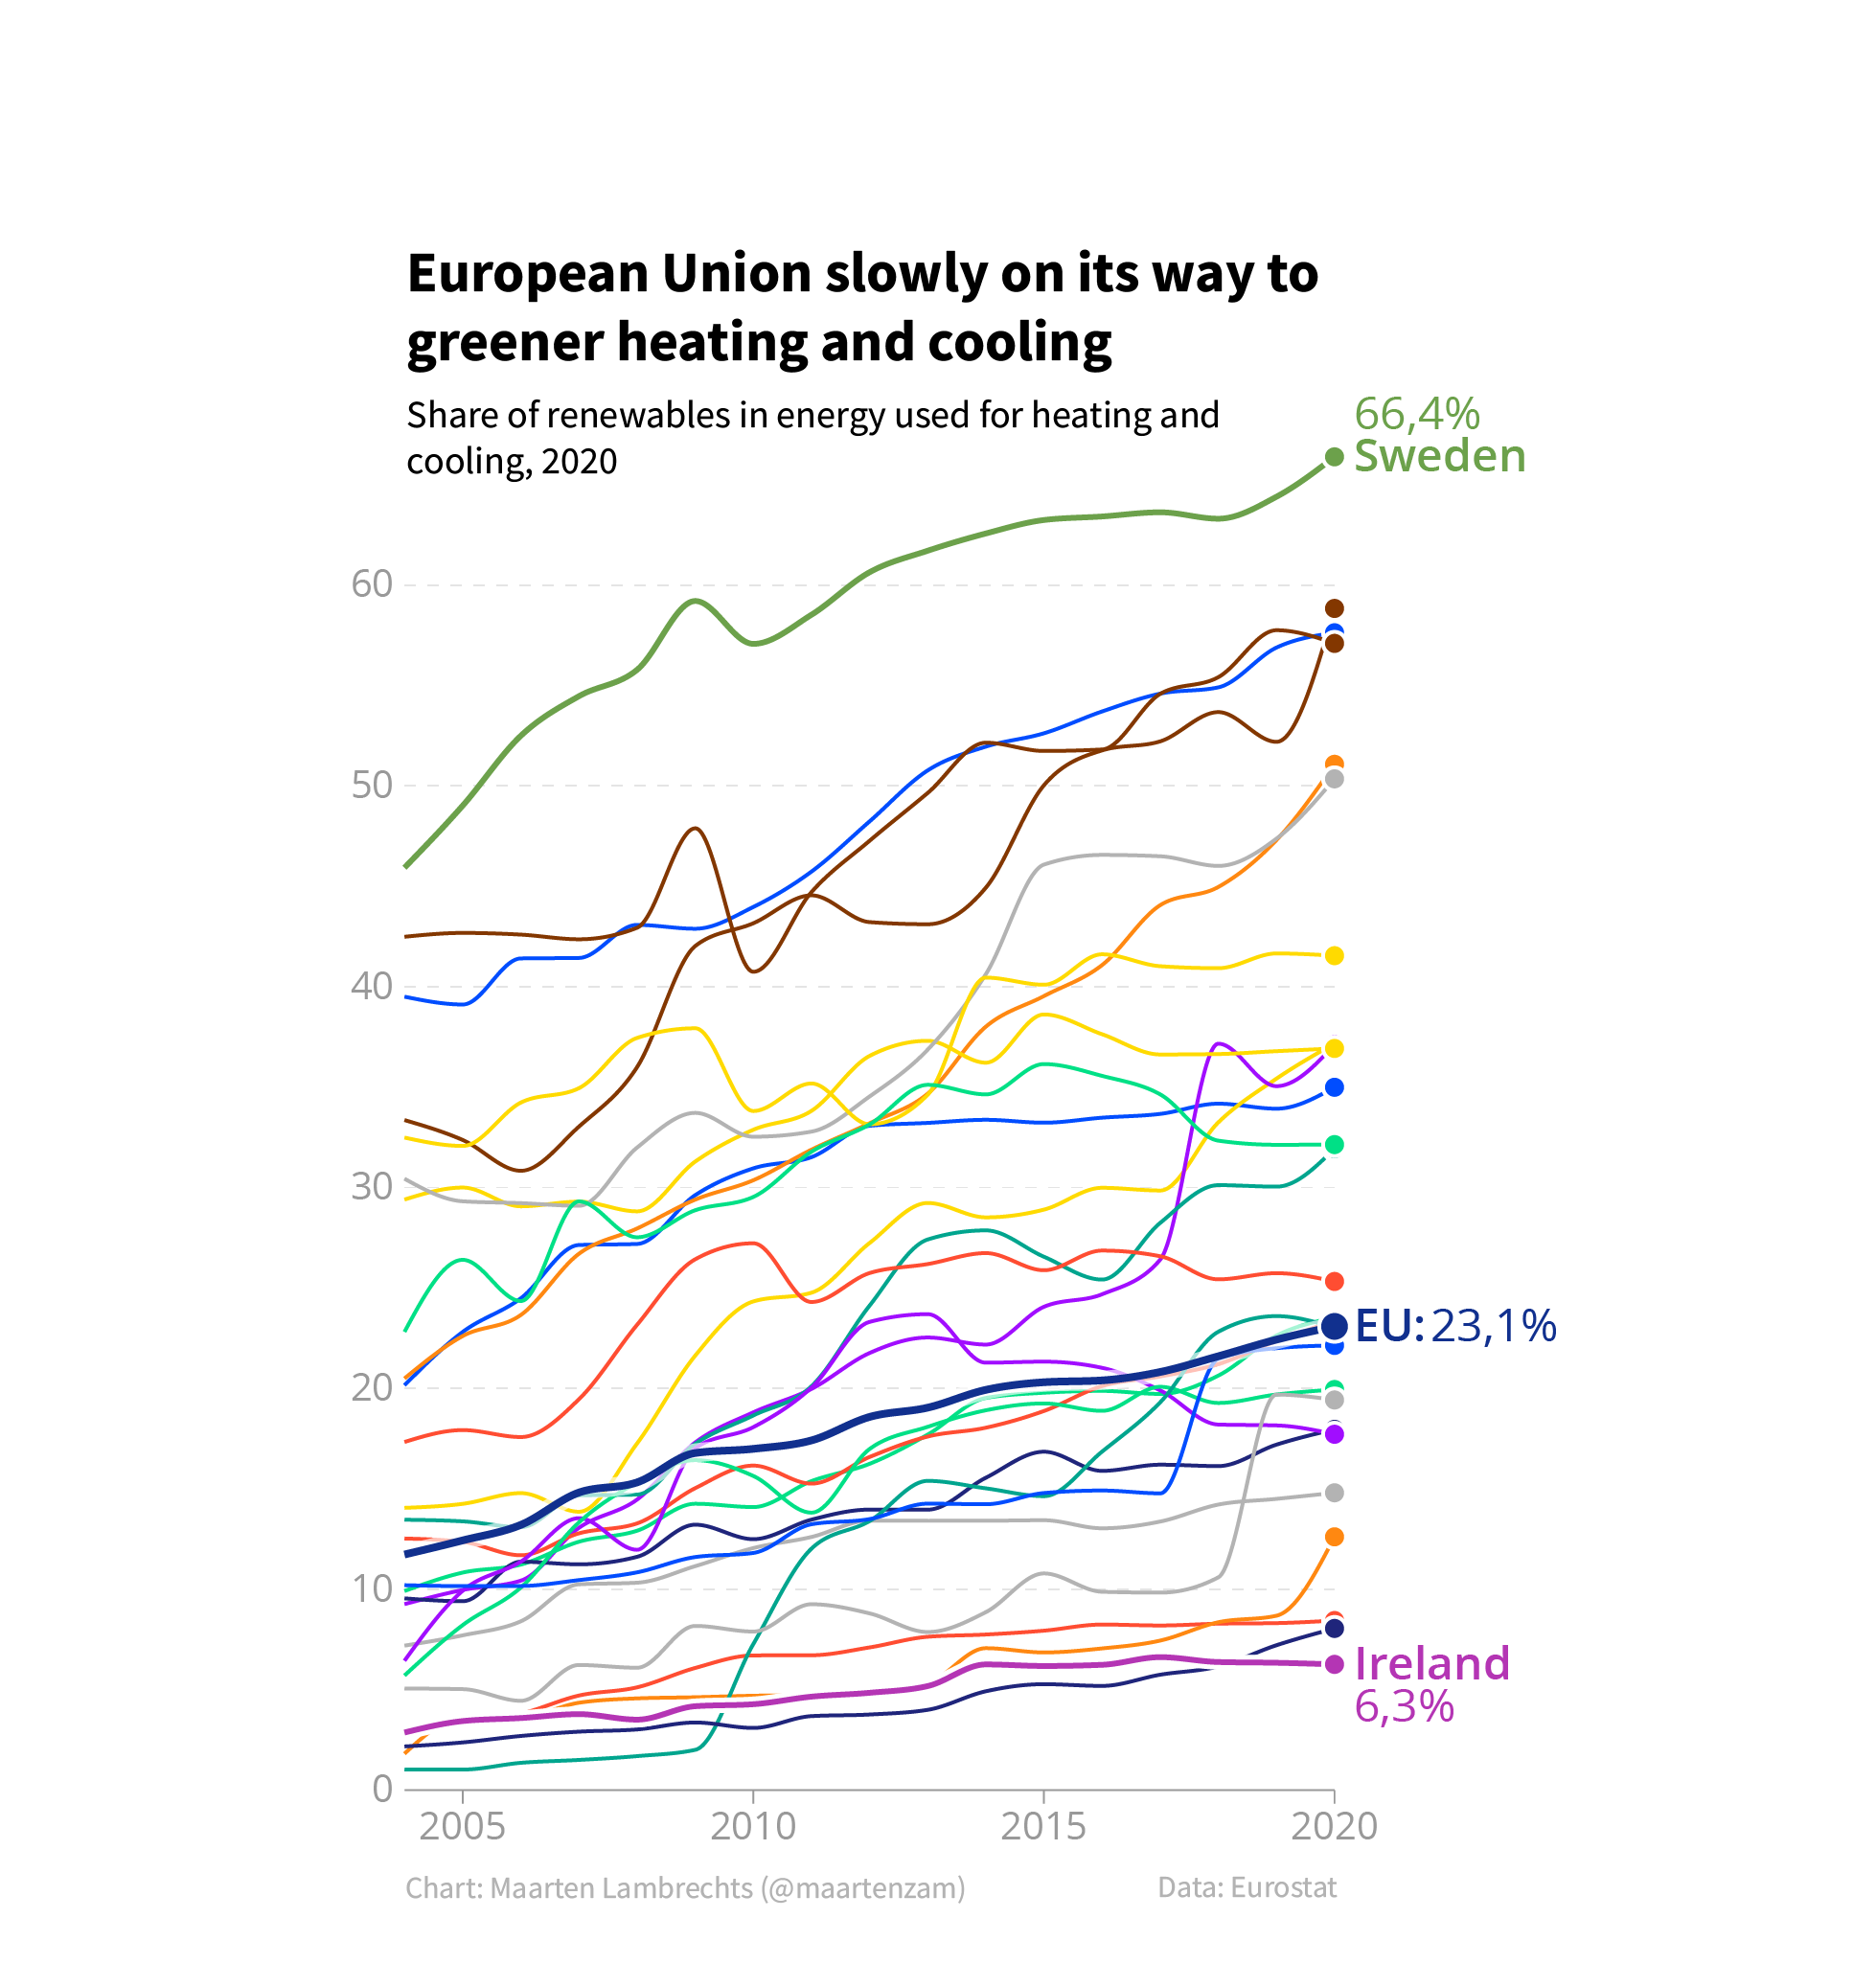
Using too many colours makes the design of a chart overloaded. Source: Maarten Lambrechts, CC BY SA 4.0
- More complex charts, with unusual encodings or with more than 2 dimensions encoded, need to be explained well. The complexity of the visualisation can be built up in steps, explaining the encoding step by step.
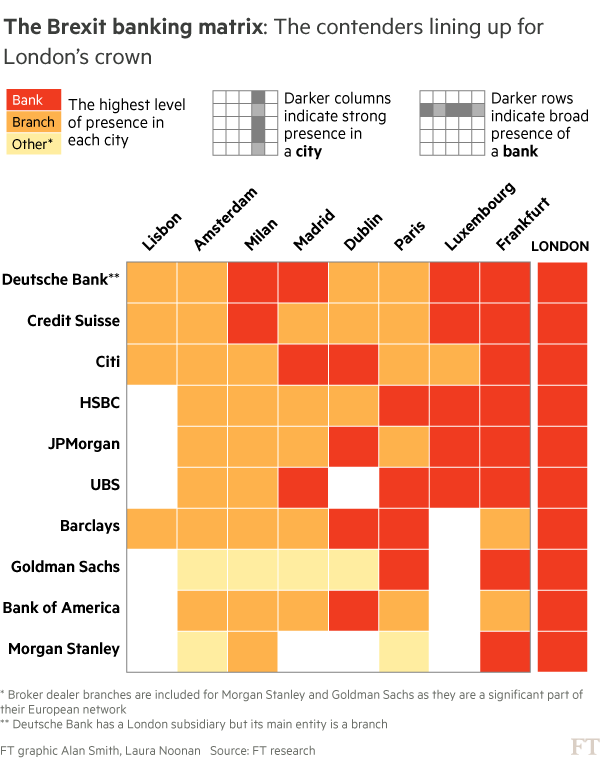
An unusual visualisation is accompanied by a little “how to read” section at the top. Source: Frankfurt vies for UK banking jobs post-Brexit, ft.com
- In interactive visualisations, changes in the visualisation should be easy to follow. When a change in the data or a change in the encoding is meaningful, changes should be animated.
The transition from a map representation of EU regions to a dot plot is animated to help the user understand. Source: Why Budapest, Warsaw, and Lithuania split themselves in two, pudding.cool
- When there is uncertainty in the data, this should be clearly presented visually and explained in text. See Visualising uncertainty
See Making data visualisations understandable for more explanations and examples regarding understandable data visualisations.