In a graphic sequence text blocks move over a fixed visual element in the background, which is replaced with a new graphic with each new text block.
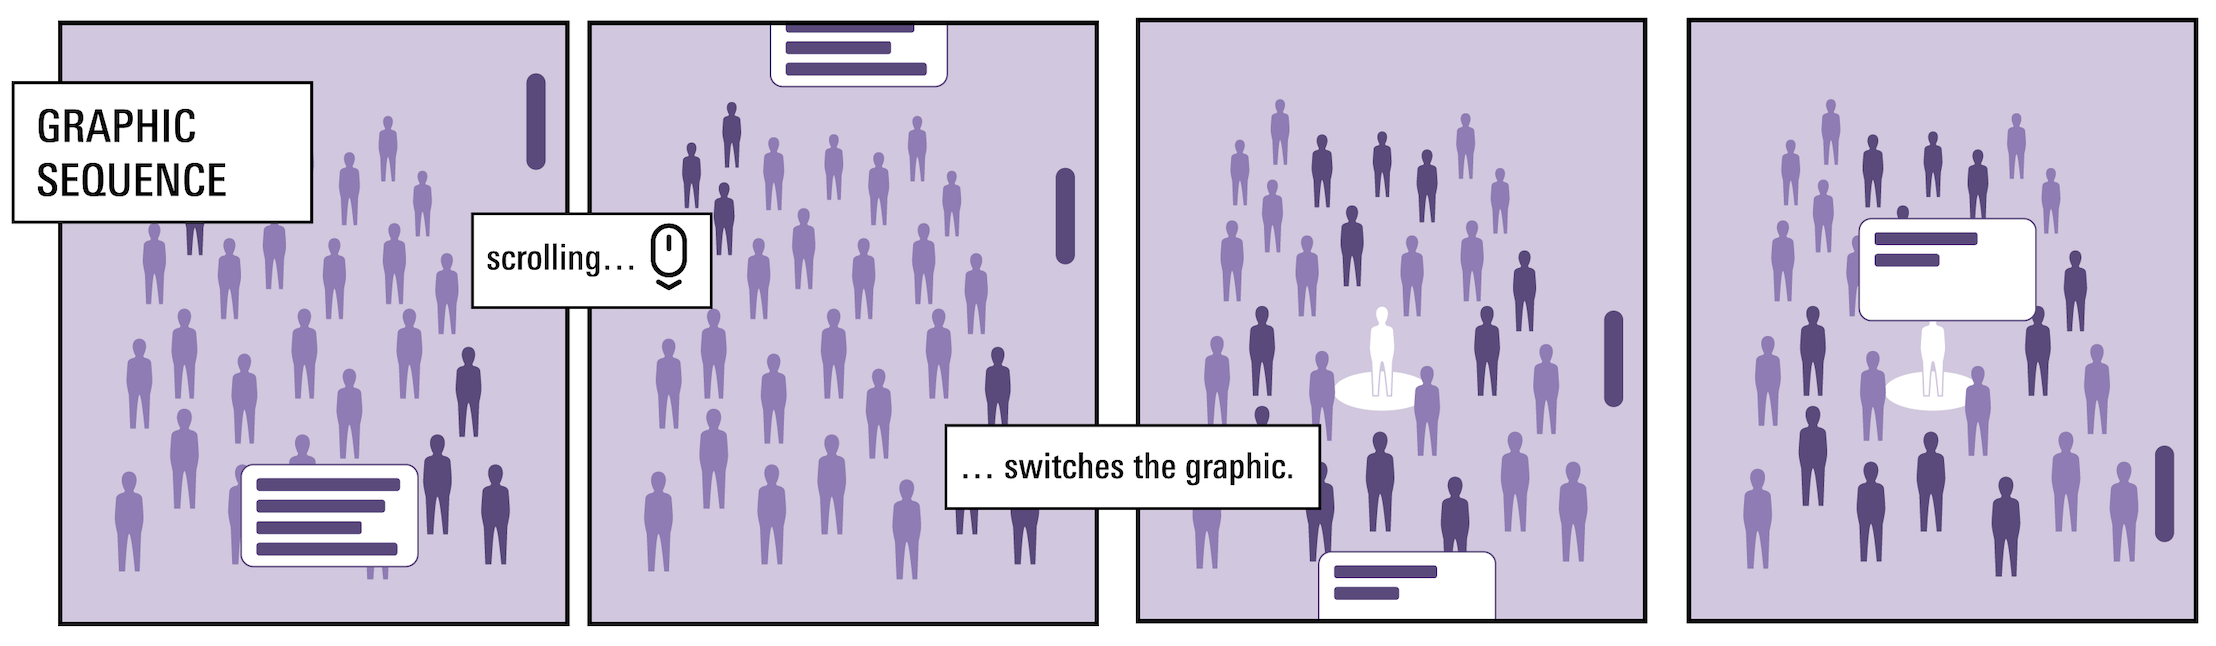
Source: Oesch, Jonas, Manuel Roth, and Adina Renner. “Scrolling into the Newsroom: A Vocabulary for Scrollytelling Techniques in Visual Online Articles.” Information Design Journal. Forthcoming 2022
Graphic sequences are often used for showing and highlighting information on a visualisation step by step. They can also work well with illustrations and photographs.
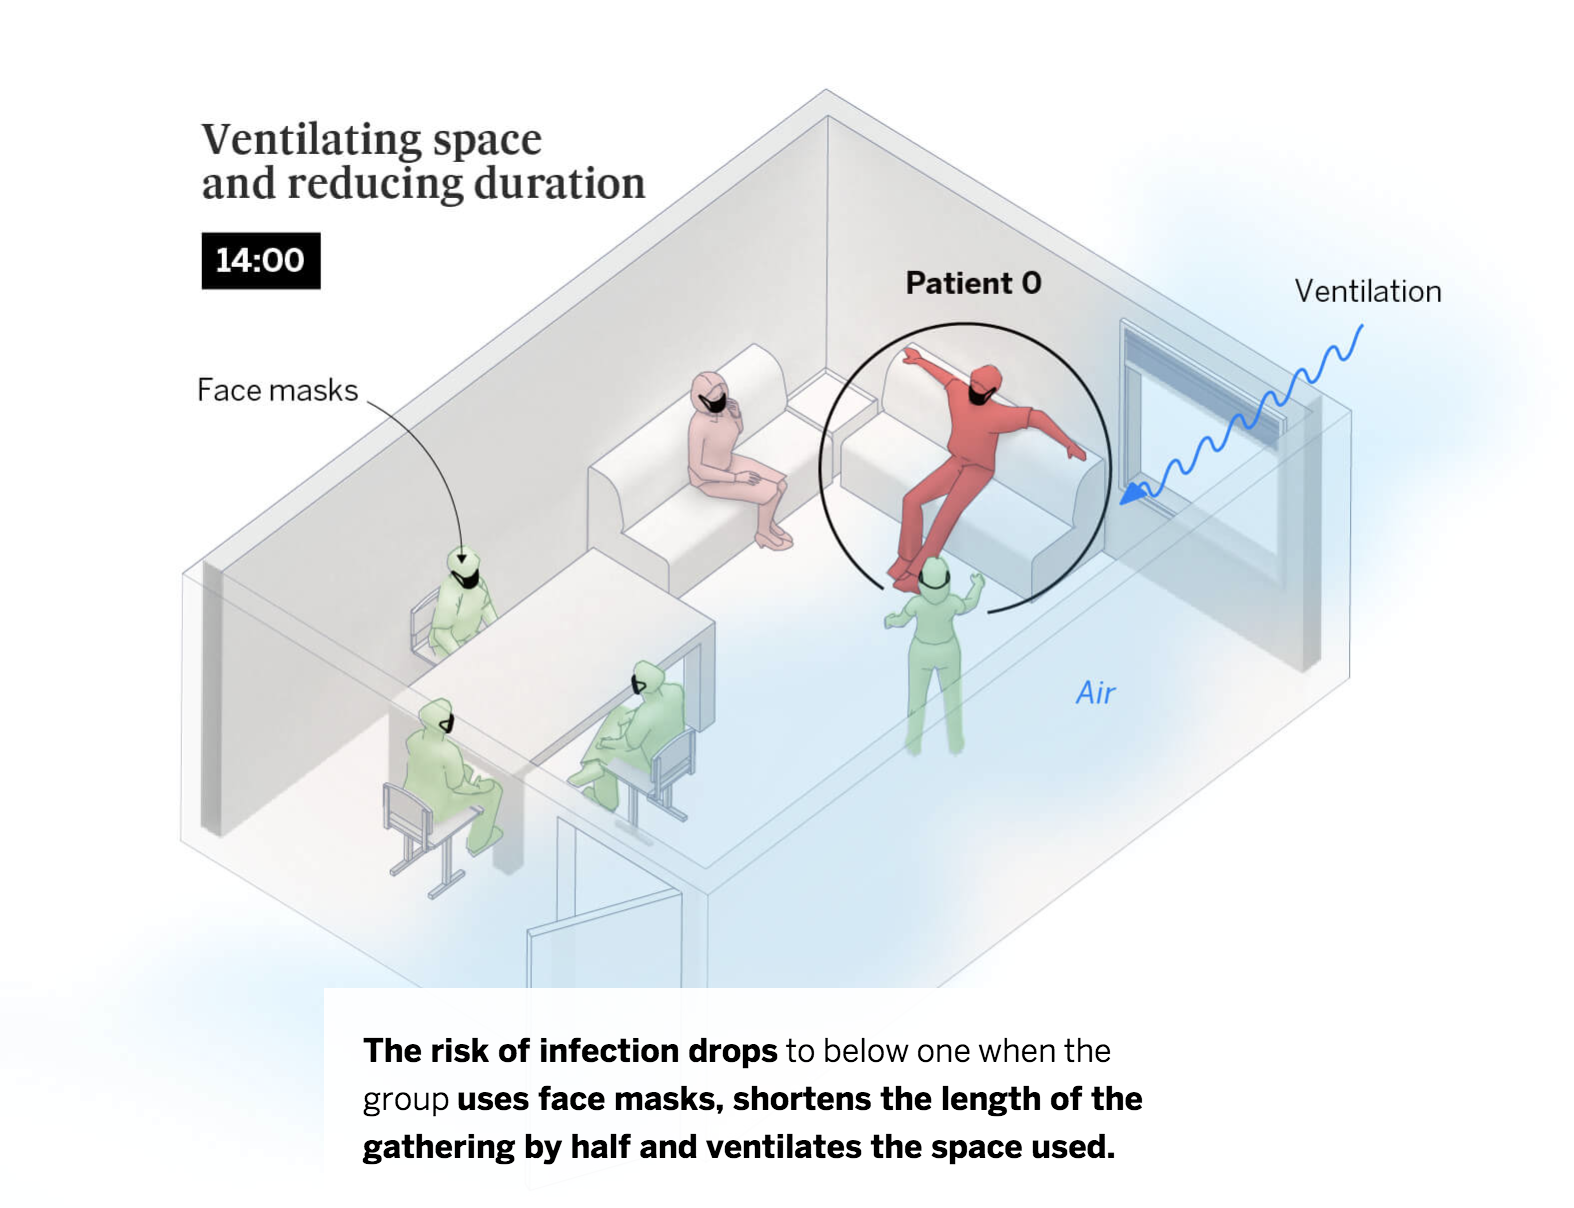
Source: A room, a bar and a classroom: how the coronavirus is spread through the air, elpais.com
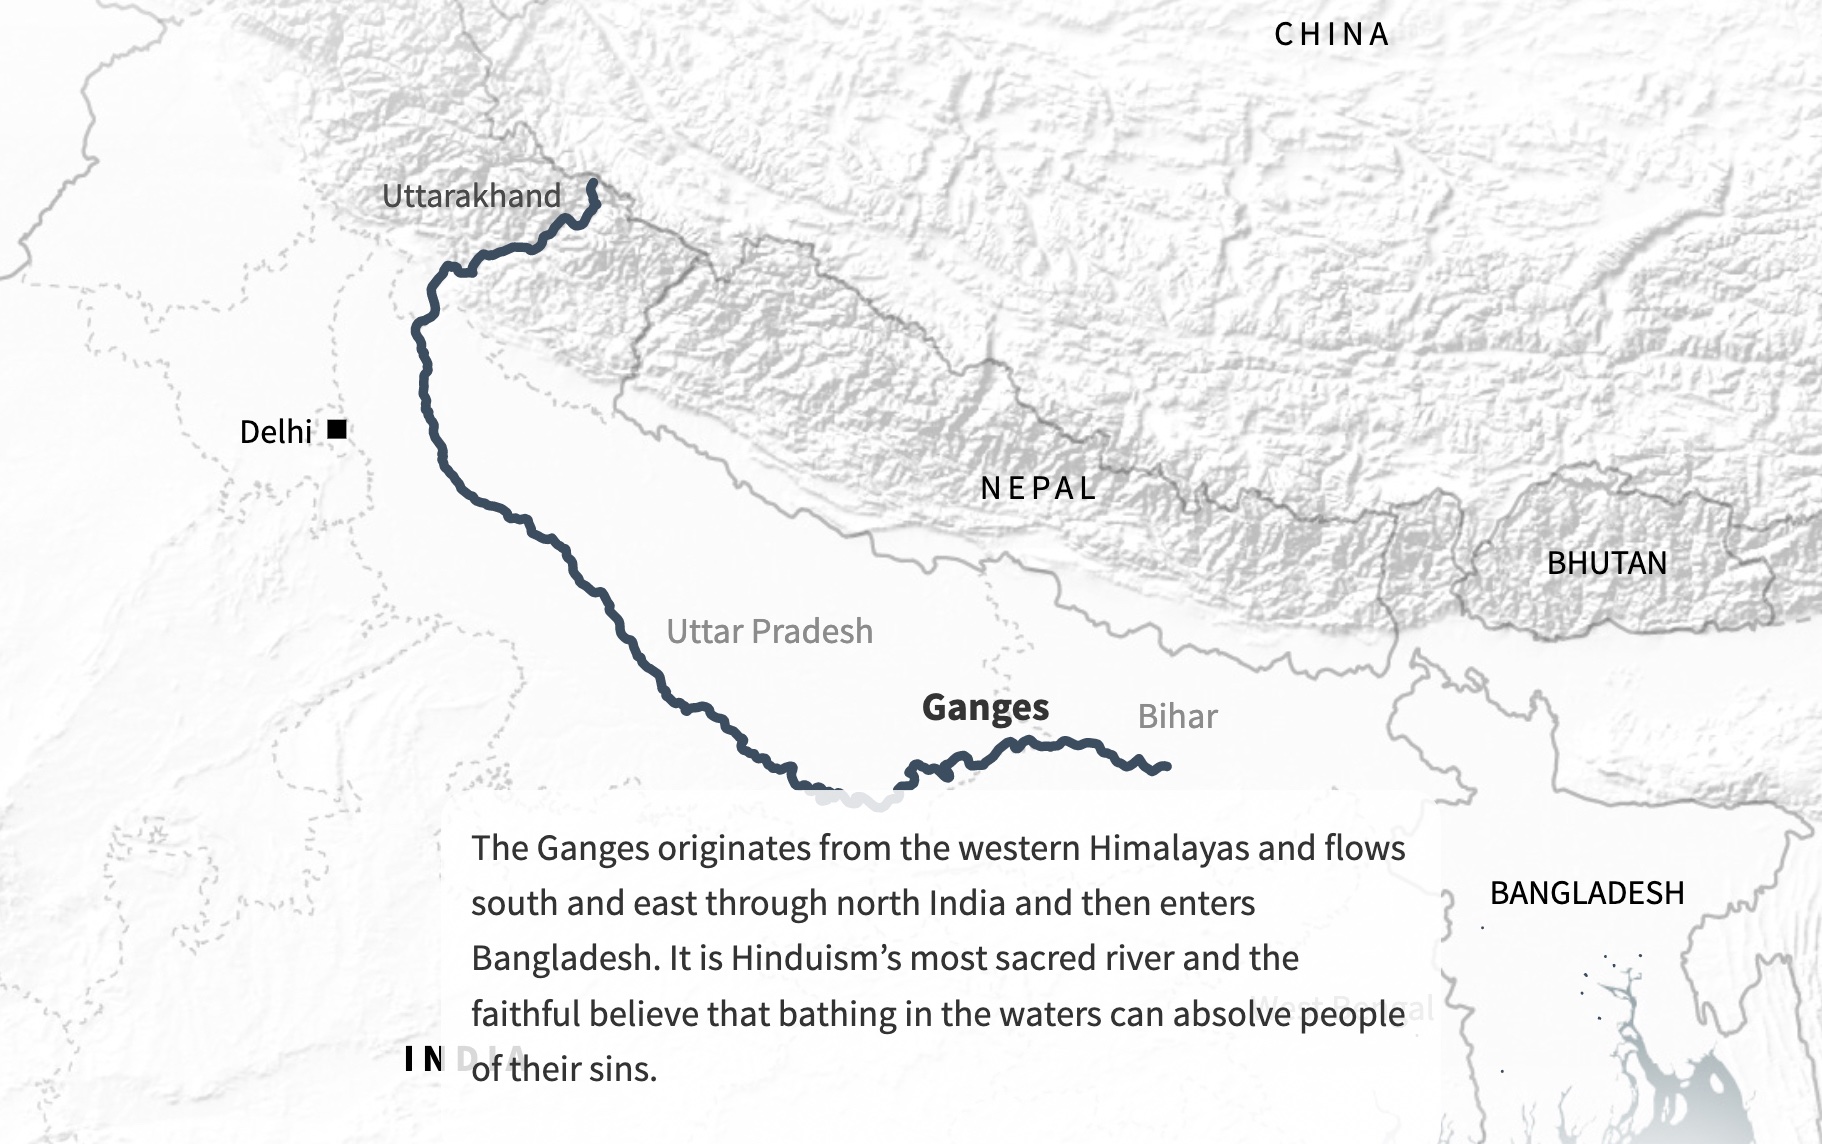
Source: The race to save the river Ganges, reuters.com
In graphic sequences, the transition between the subsequent graphics can be direct or can be faded. The graphic can use the full viewport or can have smaller dimensions. In the latter case, it is usually centered in the middle of the screen.