The geometries discussed so far can be considered primitive geometries: most of them perform a direct mapping from the data to the aesthetics of the geometries.
An exception to this is the automatic stacking of bars and areas: the positions, dimensions and shapes of each bar and area are calculated from the source data before the plot is generated. In theory, the calculations for the stacking could be performed outside of the visualisation tool, and then fed into it and visualised with the primitive geometries. But for convenience, the stacking calculations are built into the tools themselves.
For specific kinds of visualisations, other calculations are also required before a plot can be generated. For example, in order to produce a histogram, the number of observations in each bin need to be counted before the bars of the histogram can be generated.
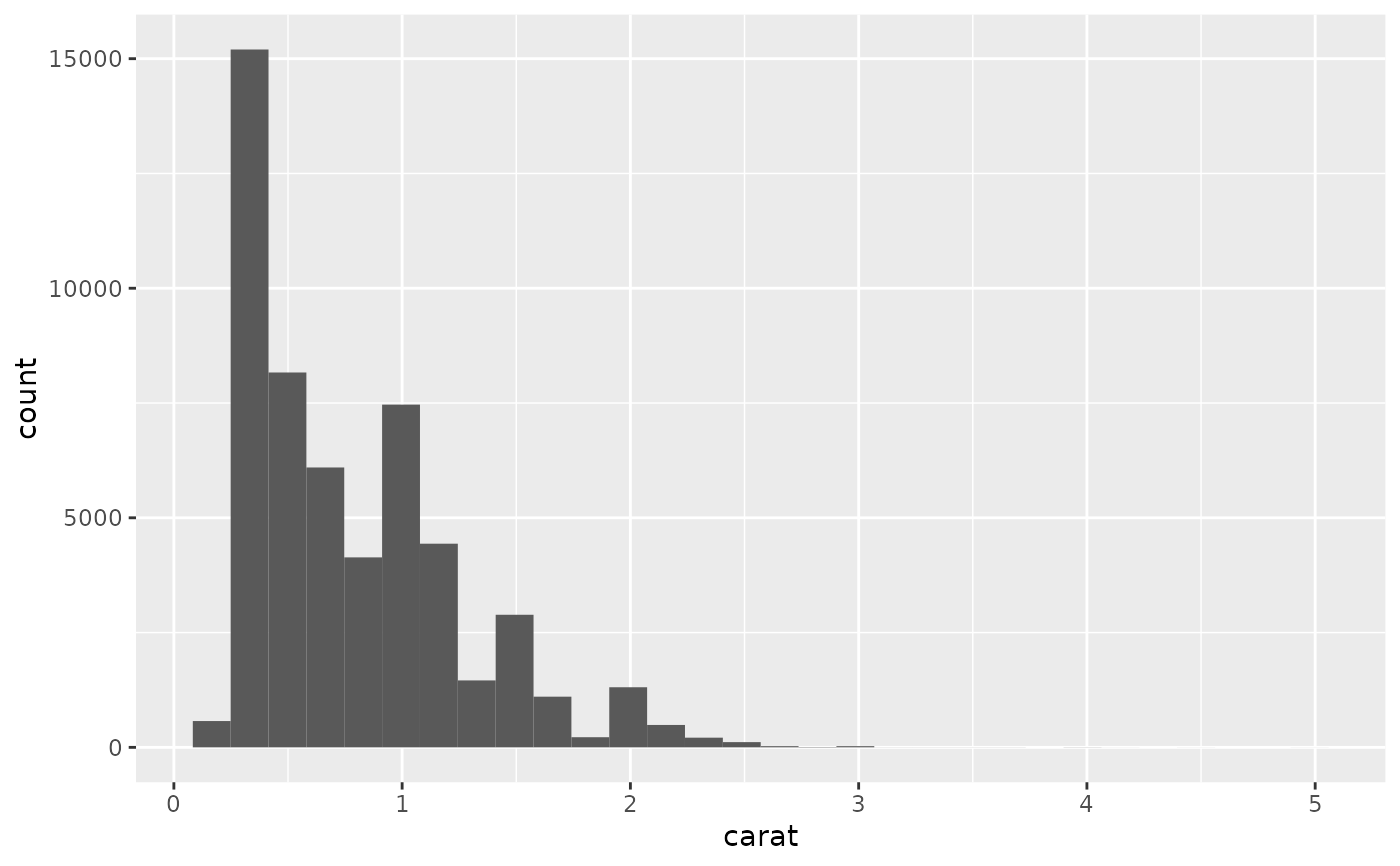
A histogram showing the number of diamonds in each bin of the carat variable. Source: ggplot2.tidyverse.org/reference/geom_histogram.html
The counting of the number of observations could be done outside of the visualisation tool, after which the calculated data could be mapped to the aesthetics of a bar geometry to construct a histogram. But because histograms are quite common charts, especially in scientific and statistical fields, the intermediate step of calculating the counts can be integrated into the visualisation tool.
This is the case with ggplot2, which has a histogram geometry that automatically calculates the number of observations in each bin. Other examples of ggplot geometries that automatically perform some kind of internal calculations are the hex and boxplot geometries:
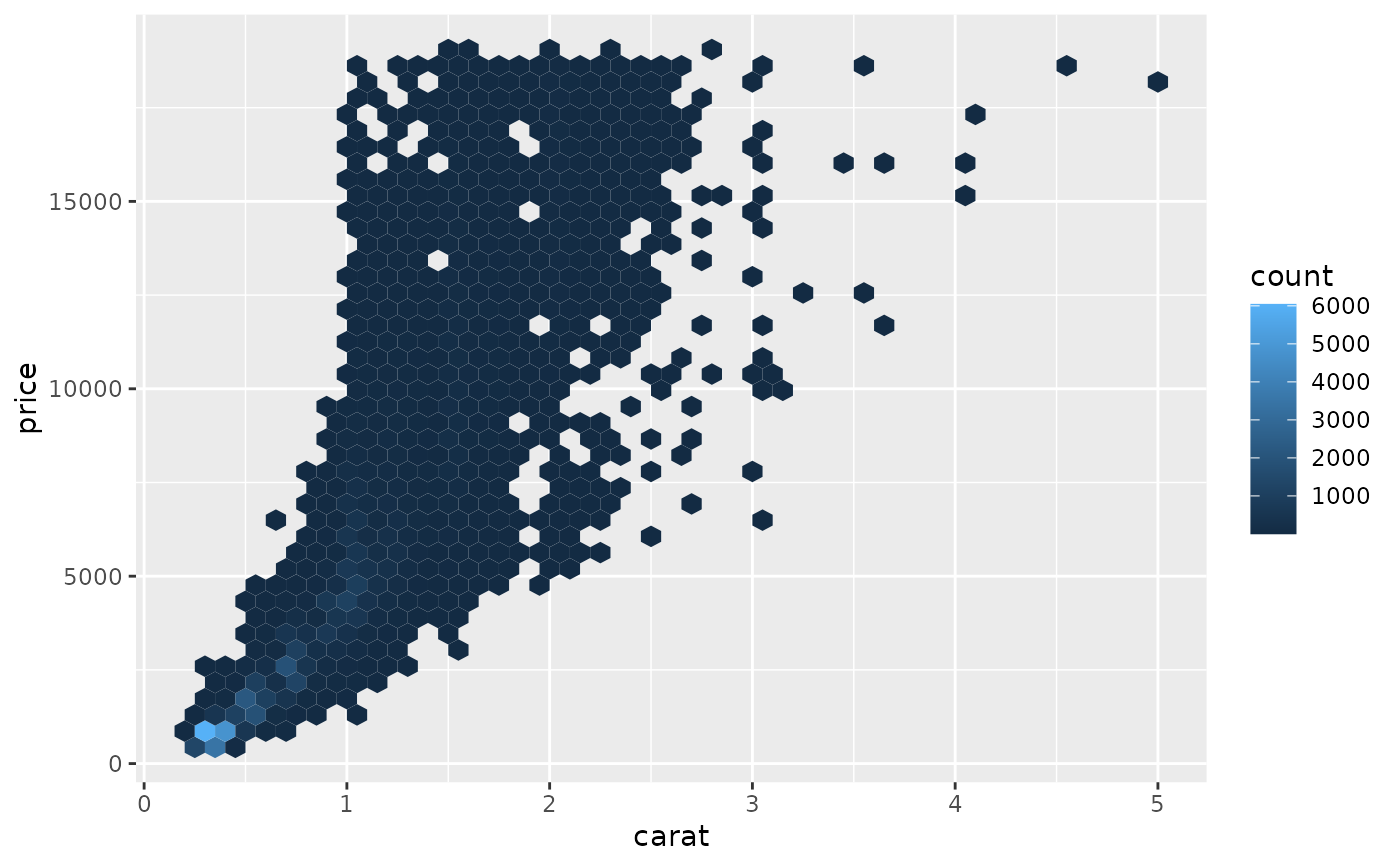
The hex geometry partitions the x-y space into hexagons and counts the number of observations in each hexagon. The counts are displayed here with the fill aesthetic of the hexagons. Source: ggplot2.tidyverse.org/reference/geom_hex.html
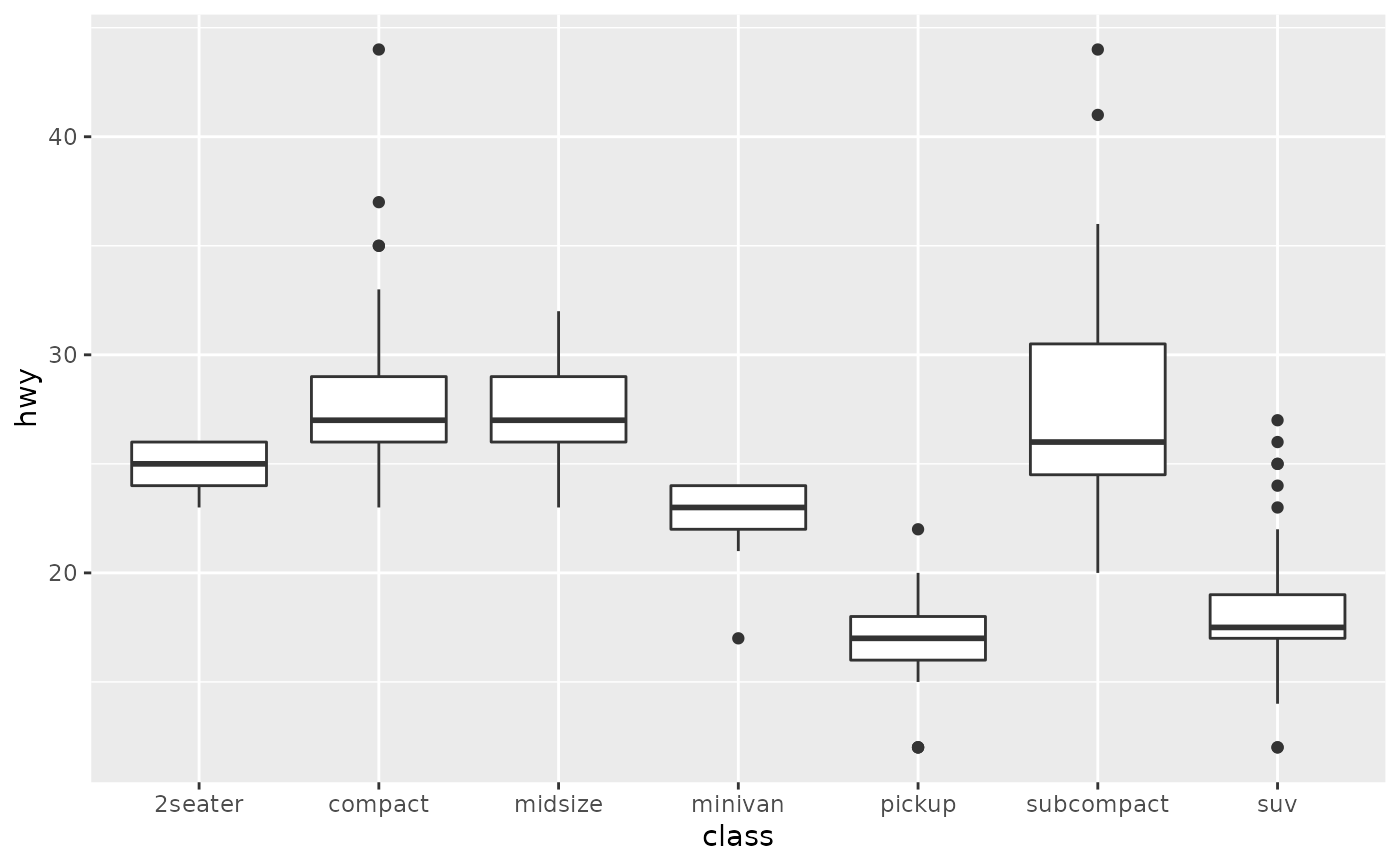
Boxplots show the quartiles of a distribution. These are calculated internally from the source data by the boxplot geometry. Source: ggplot2.tidyverse.org/reference/geom_boxplot.html
ggplot2 has some more of these geometries with integrated calculations. Vega-Lite and Observable Plot also have a couple of these geometries, which both include the box plot.
It is worth mentioning here that all 3 tools are able to produce maps, and have specific geometries to display geographical data. But mapping with the Grammar of Graphics falls outside of the scope of this training.